| Param | Original file | Final file |
|---|---|---|
| Filename | modeM0/AS1A14_126T15_9000006516_54275cztM0_level2.fits | modeM0/AS1A14_126T15_9000006516_54275cztM0_level2_quad_clean.evt |
| Size (bytes) | 525,582,720 | 118,465,920 |
| Size | 501.2 MB | 113.0 MB |
| Events in quadrant A | 4,177,968 | 788,834 |
| Events in quadrant B | 4,594,083 | 819,046 |
| Events in quadrant C | 4,631,655 | 723,908 |
| Events in quadrant D | 5,410,657 | 681,910 |
| Mode SS | |||
|---|---|---|---|
| Quadrant | BADHDUFLAG | Total packets | Discarded packets |
| A | 0 | 164 | 0 |
| B | 0 | 164 | 0 |
| C | 0 | 164 | 0 |
| D | 0 | 164 | 0 |
| Mode M0 | |||
|---|---|---|---|
| Quadrant | BADHDUFLAG | Total packets | Discarded packets |
| A | 0 | 18235 | 3 |
| B | 0 | 19519 | 2 |
| C | 0 | 19831 | 0 |
| D | 0 | 21832 | 0 |
| Quadrant | Total seconds | Saturated seconds | Saturation percentage |
|---|---|---|---|
| A | 8254 | 39 | 0.472498% |
| B | 8255 | 251 | 3.040581% |
| C | 8256 | 257 | 3.112888% |
| D | 8256 | 271 | 3.282461% |
Noise dominated data is calculated using 1-second bins in cleaned event files. If a bin has >2000 counts, and if more than 50% of those come from <1% of pixels, then it is considered to be noise-dominated and hence unusable.
| Quadrant | # 1 sec bins | Bins with >0 counts | Bins with >2000 counts | High rate bins dominated by noise | Noise dominated (total time) | Noise dominated (detector-on time) | Marked lightcurve |
|---|---|---|---|---|---|---|---|
| A | 8256 | 8255 | 37 | 37 | 0.45% | 0.45% | 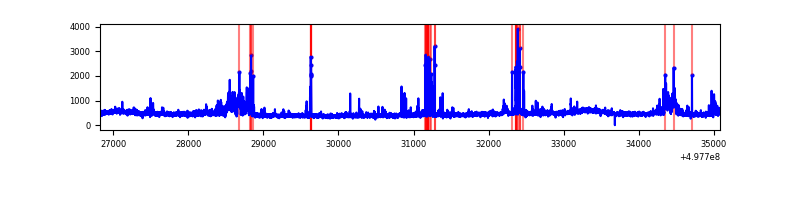 |
| B | 8255 | 8255 | 198 | 198 | 2.40% | 2.40% | 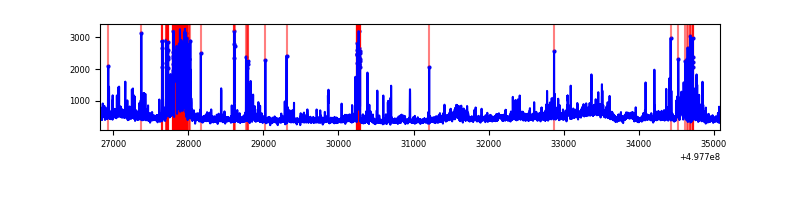 |
| C | 8256 | 8256 | 206 | 206 | 2.50% | 2.50% | 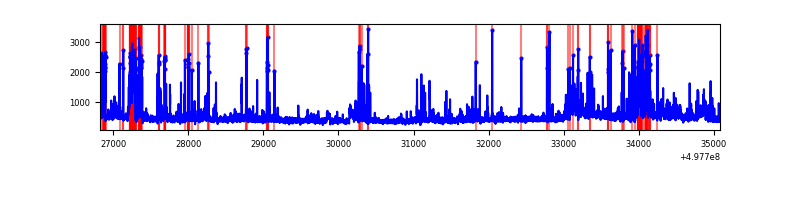 |
| D | 8256 | 8256 | 264 | 264 | 3.20% | 3.20% | 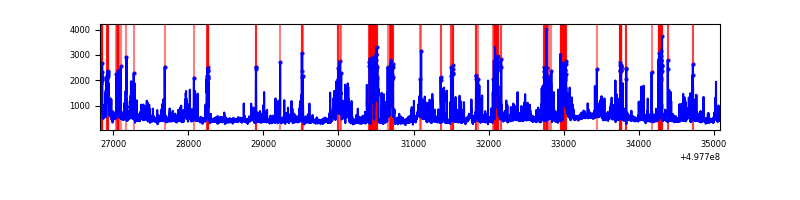 |
Top three noisy pixels from each quadrant. If the there are fewer than three noisy pixels in the level2.evt file, extra rows are filled as -1
| Pixel properties | Quadrant properties | ||||||
|---|---|---|---|---|---|---|---|
| Quadrant | DetID | PixID | Counts | Sigma | Mean | Median | Sigma |
| A | 4 | 5 | 265427 | 1211.6 | 879 | 858 | 218.4 |
| A | 0 | 8 | 126536 | 575.55 | 879 | 858 | 218.4 |
| A | 11 | 3 | 117338 | 533.42 | 879 | 858 | 218.4 |
| B | 5 | 185 | 438750 | 2385.31 | 859 | 828 | 183.6 |
| B | 5 | 172 | 302968 | 1645.72 | 859 | 828 | 183.6 |
| B | 0 | 213 | 138276 | 748.66 | 859 | 828 | 183.6 |
| C | 1 | 29 | 378241 | 1654.05 | 843 | 836 | 228.2 |
| C | 12 | 249 | 275754 | 1204.88 | 843 | 836 | 228.2 |
| C | 4 | 5 | 188281 | 821.51 | 843 | 836 | 228.2 |
| D | 3 | 12 | 1280029 | 5333.55 | 848 | 809 | 239.8 |
| D | 8 | 176 | 181350 | 752.74 | 848 | 809 | 239.8 |
| D | 10 | 181 | 150312 | 623.33 | 848 | 809 | 239.8 |
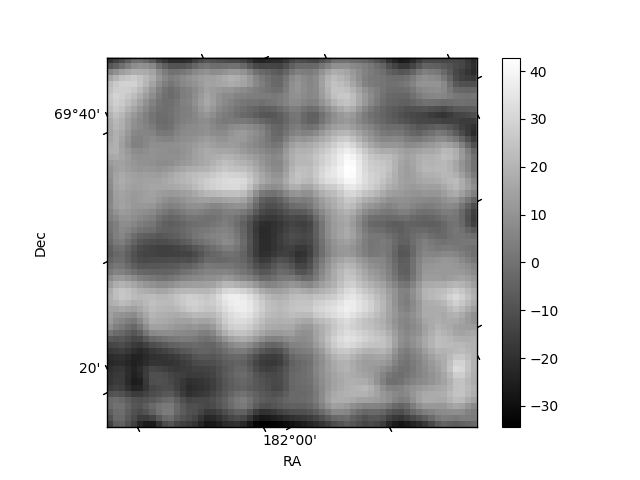
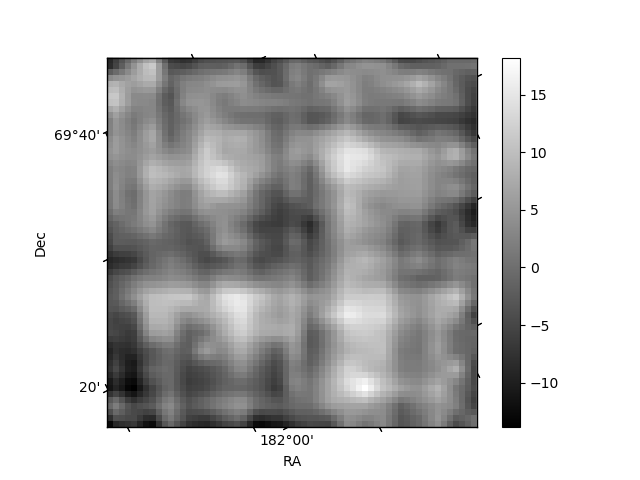
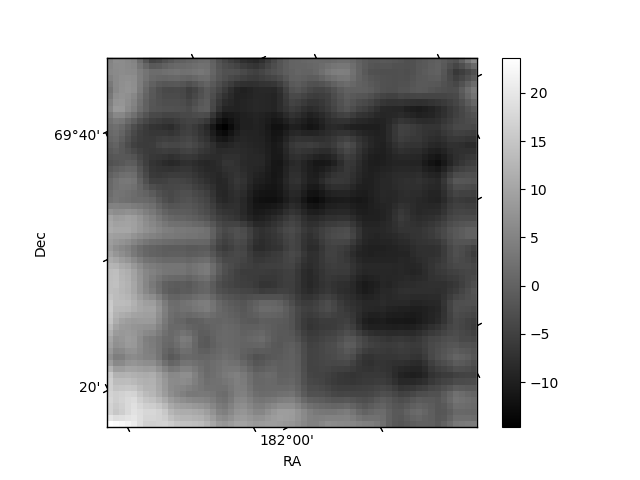
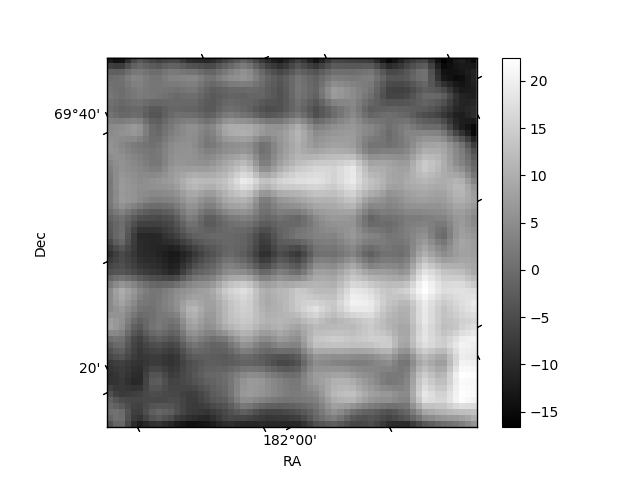
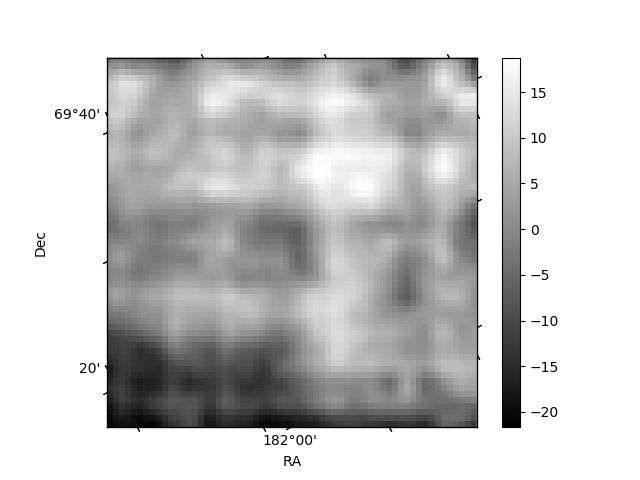
Histogram calculated using DETX and DETY for each event in the final _common_clean file
| Quadrant A | 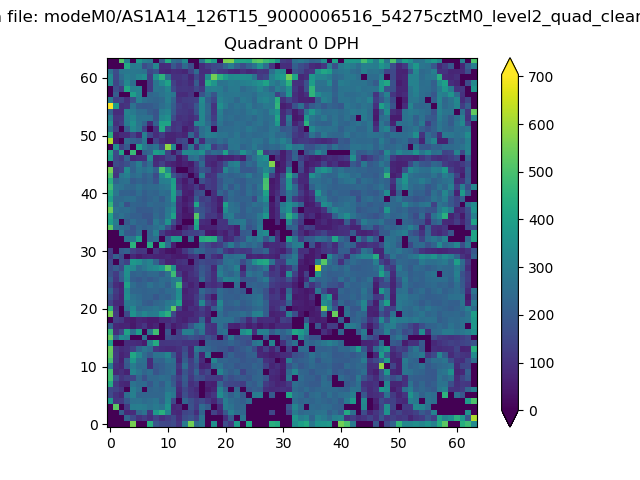 |
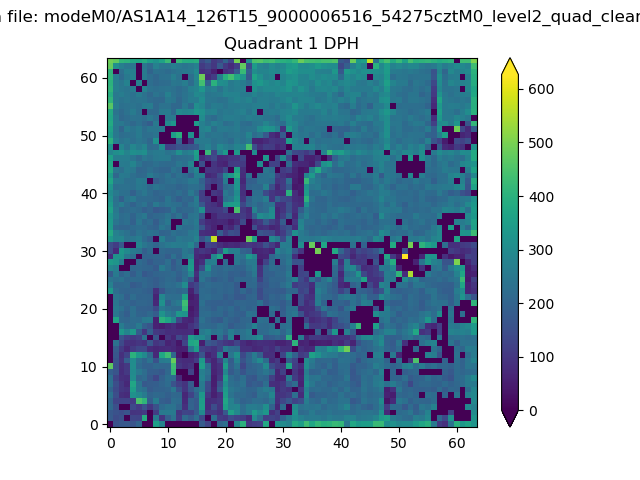 |
Quadrant B |
|---|---|---|---|
| Quadrant D | 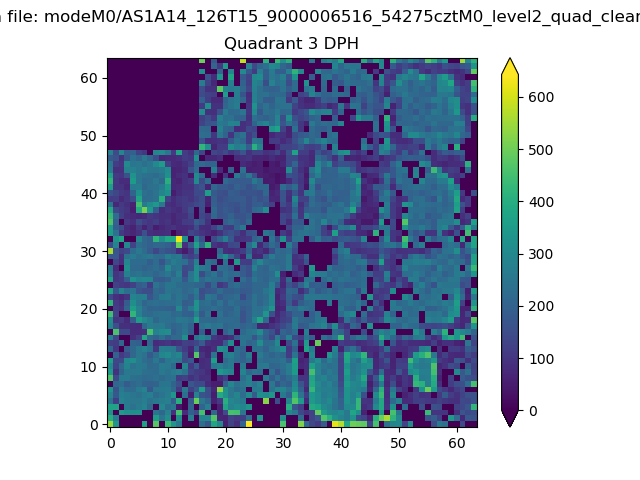 |
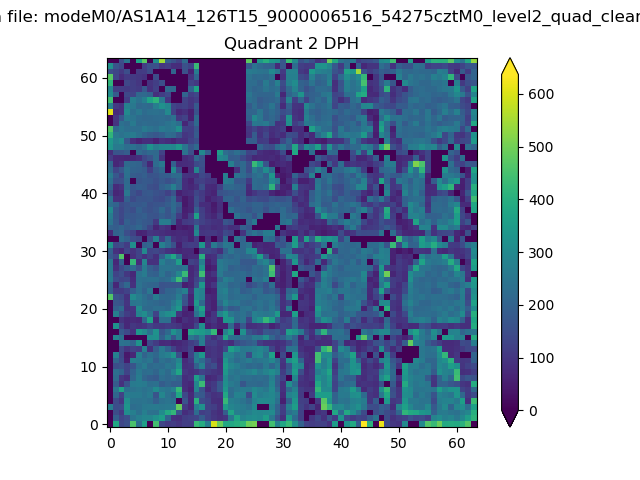 |
Quadrant C |
| Plot type | Count rate plots | Images |
|---|---|---|
| Comparison with Poisson distribution Blue bars denote a histogram of data divided into 1 sec bins. Red curve is a Poisson curve with rate = median count rate of data. |
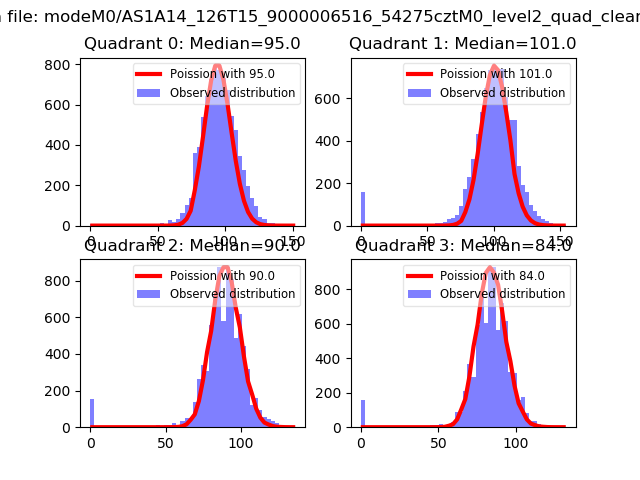 |
 |
| Quadrant-wise count rates Data is divided into 100 sec bins |
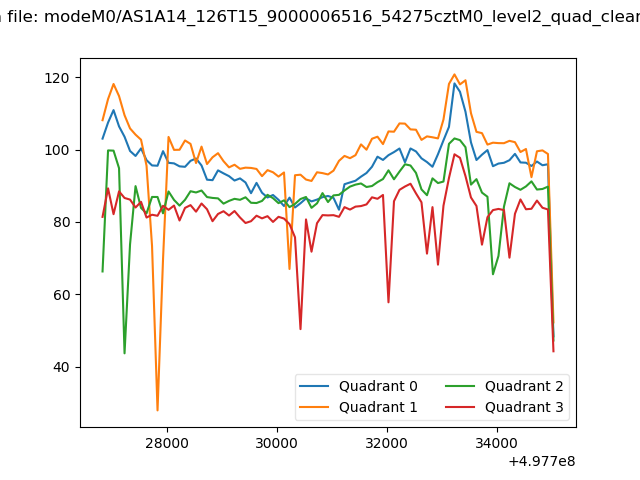 |
|
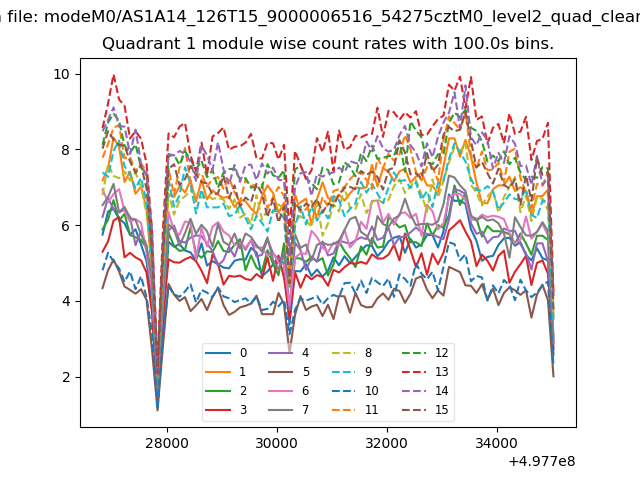
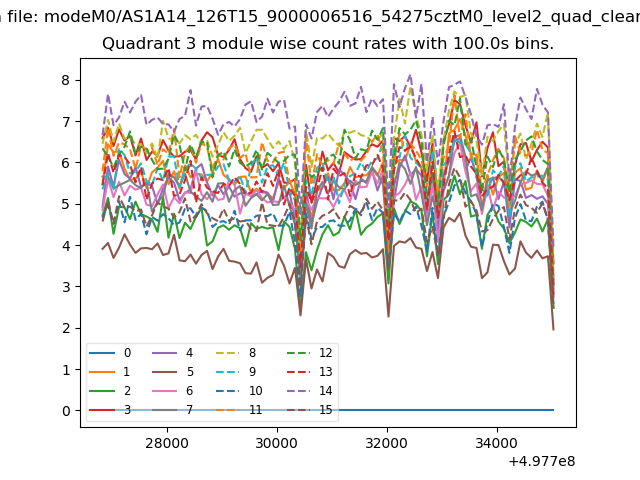
| Module-wise count rates for Quadrant A Data is divided into 100 sec bins |
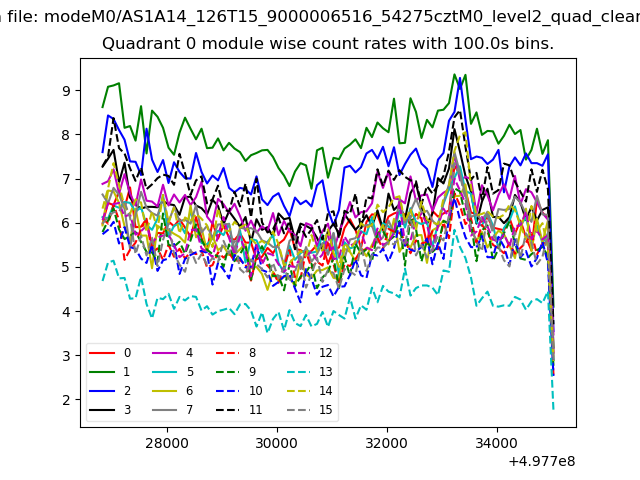 |
 |
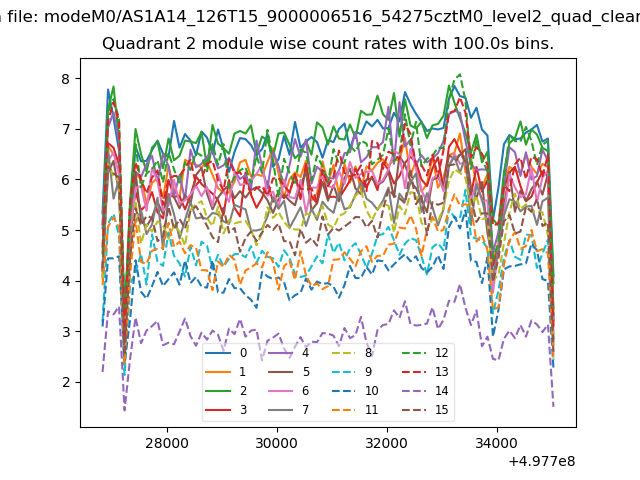
| Module-wise count rates for Quadrant B Data is divided into 100 sec bins |
 |
 |
| Module-wise count rates for Quadrant C Data is divided into 100 sec bins |
 |
 |
| Module-wise count rates for Quadrant D Data is divided into 100 sec bins |
 |
 |
| Parameter | Plot |
|---|---|
| CZT HV Monitor | 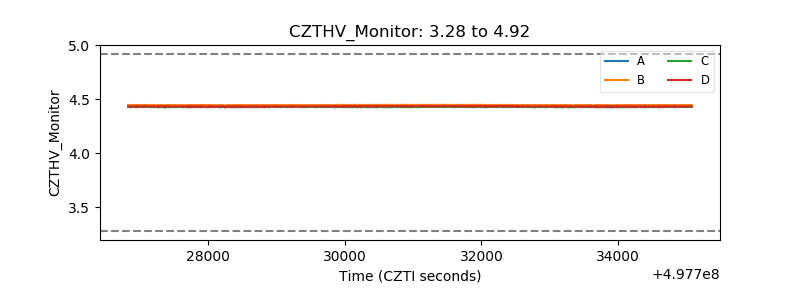 |
| D_VDD | 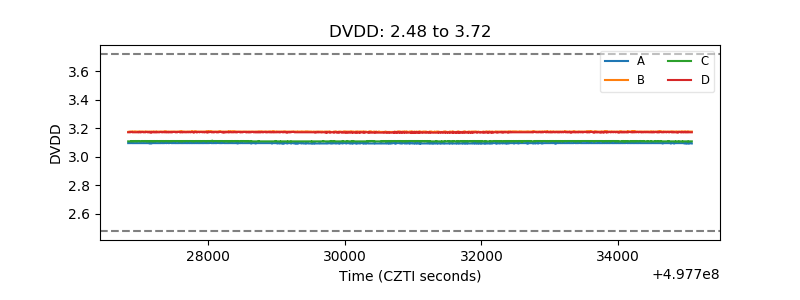 |
| Temperature 1 | 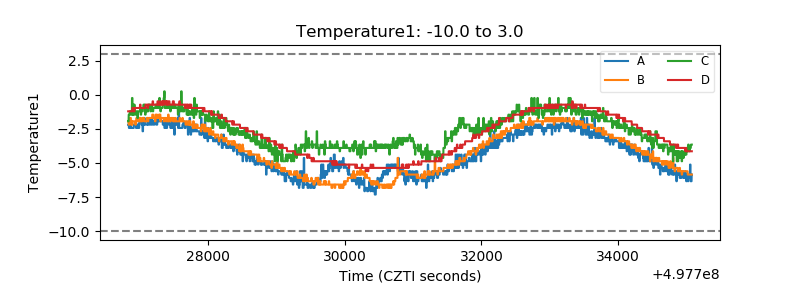 |
| Veto HV Monitor | 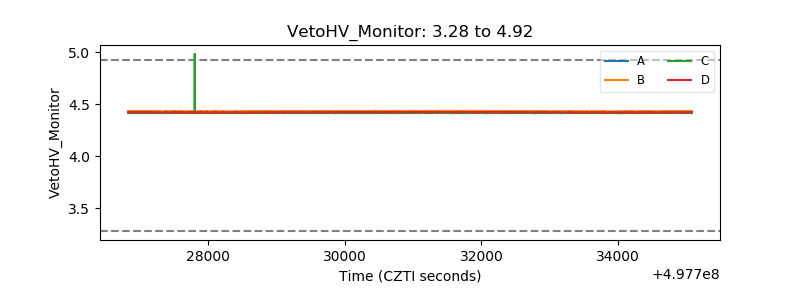 |
| Veto LLD | 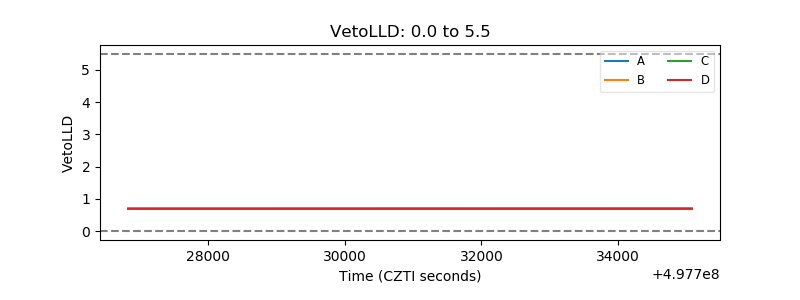 |
| Alpha Counter | 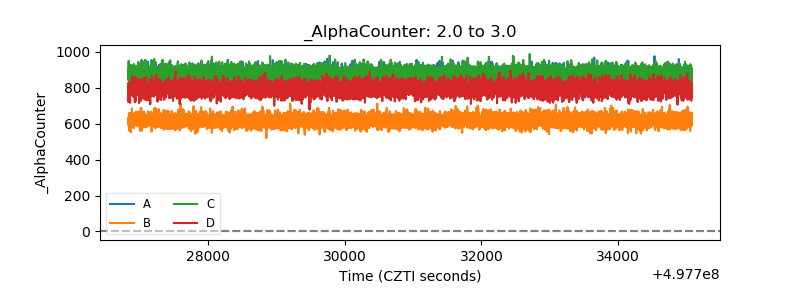 |
| _CPM_Rate | 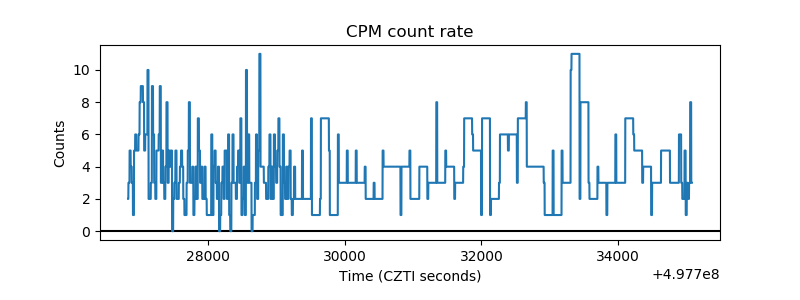 |
| CZT Counter | 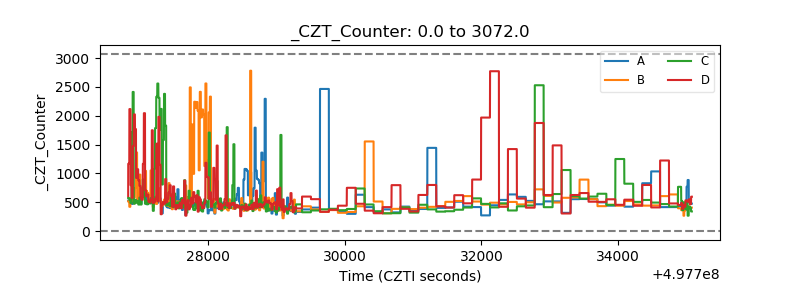 |
| +2.5 Volts monitor |  |
| +5 Volts monitor |  |
| _ROLL_ROT | 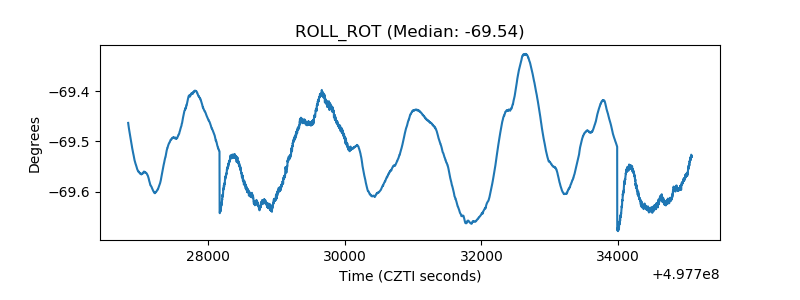 |
| _Roll_DEC | 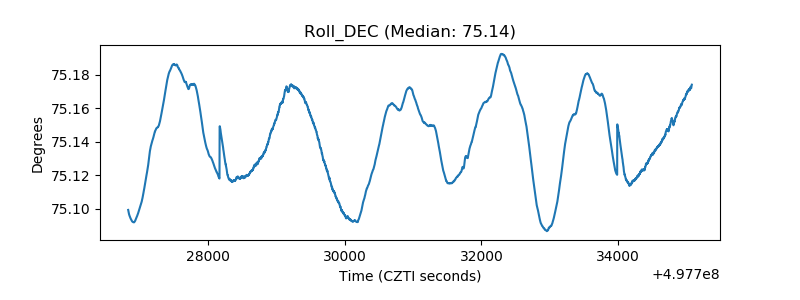 |
| _Roll_RA | 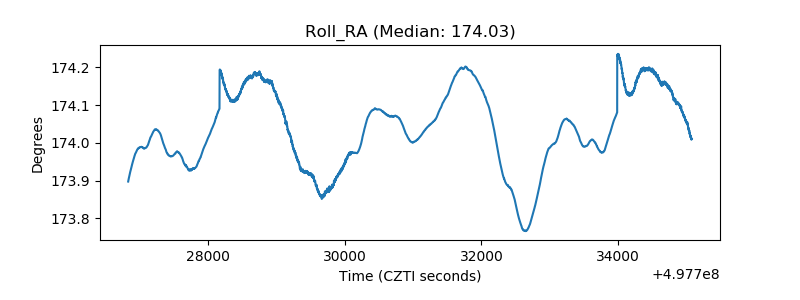 |
| Veto Counter | 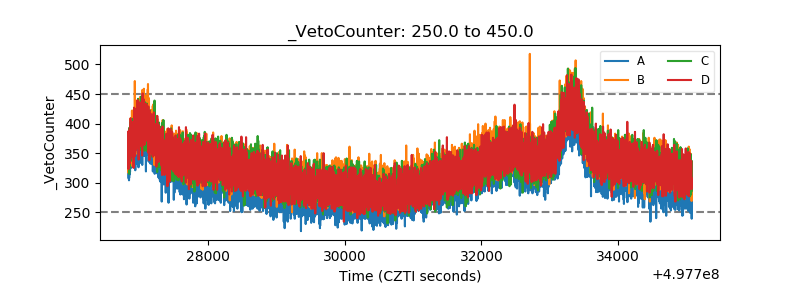 |