| Param | Original file | Final file |
|---|---|---|
| Filename | modeM0/AS1A14_126T15_9000006516_54278cztM0_level2.fits | modeM0/AS1A14_126T15_9000006516_54278cztM0_level2_quad_clean.evt |
| Size (bytes) | 1,457,997,120 | 263,373,120 |
| Size | 1.4 GB | 251.2 MB |
| Events in quadrant A | 9,420,540 | 1,814,668 |
| Events in quadrant B | 10,273,824 | 1,941,753 |
| Events in quadrant C | 15,172,239 | 1,481,508 |
| Events in quadrant D | 17,593,554 | 1,391,600 |
| Mode SS | |||
|---|---|---|---|
| Quadrant | BADHDUFLAG | Total packets | Discarded packets |
| A | 0 | 396 | 0 |
| B | 0 | 396 | 0 |
| C | 0 | 396 | 0 |
| D | 0 | 396 | 0 |
| Mode M0 | |||
|---|---|---|---|
| Quadrant | BADHDUFLAG | Total packets | Discarded packets |
| A | 0 | 42325 | 4 |
| B | 0 | 44589 | 4 |
| C | 0 | 59576 | 4 |
| D | 0 | 65796 | 4 |
| Mode M9 | |||
|---|---|---|---|
| Quadrant | BADHDUFLAG | Total packets | Discarded packets |
| A | 0 | 14 | 0 |
| B | 0 | 14 | 0 |
| C | 0 | 14 | 0 |
| D | 0 | 14 | 0 |
| Quadrant | Total seconds | Saturated seconds | Saturation percentage |
|---|---|---|---|
| A | 19514 | 182 | 0.932664% |
| B | 19515 | 230 | 1.178581% |
| C | 19515 | 2506 | 12.841404% |
| D | 19515 | 2516 | 12.892647% |
Noise dominated data is calculated using 1-second bins in cleaned event files. If a bin has >2000 counts, and if more than 50% of those come from <1% of pixels, then it is considered to be noise-dominated and hence unusable.
| Quadrant | # 1 sec bins | Bins with >0 counts | Bins with >2000 counts | High rate bins dominated by noise | Noise dominated (total time) | Noise dominated (detector-on time) | Marked lightcurve |
|---|---|---|---|---|---|---|---|
| A | 20954 | 19518 | 105 | 105 | 0.50% | 0.54% | 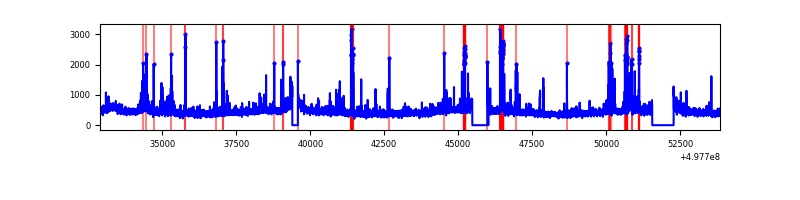 |
| B | 20955 | 19519 | 61 | 61 | 0.29% | 0.31% | 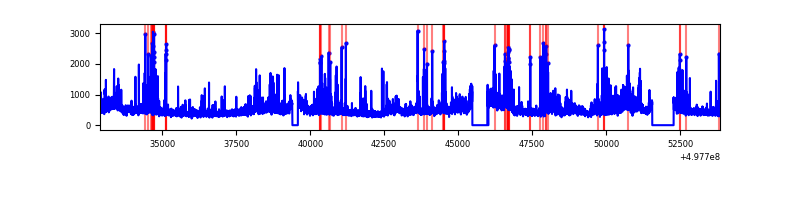 |
| C | 20955 | 19517 | 2357 | 2357 | 11.25% | 12.08% | 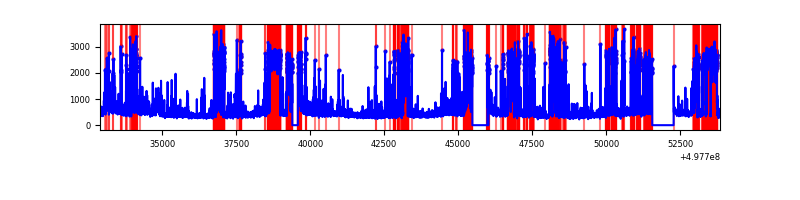 |
| D | 20955 | 19519 | 2546 | 2546 | 12.15% | 13.04% | 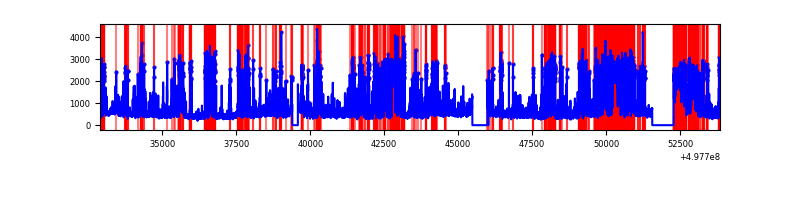 |
Top three noisy pixels from each quadrant. If the there are fewer than three noisy pixels in the level2.evt file, extra rows are filled as -1
| Pixel properties | Quadrant properties | ||||||
|---|---|---|---|---|---|---|---|
| Quadrant | DetID | PixID | Counts | Sigma | Mean | Median | Sigma |
| A | 15 | 174 | 414213 | 809.26 | 2058 | 2006 | 509.4 |
| A | 4 | 3 | 214966 | 418.09 | 2058 | 2006 | 509.4 |
| A | 4 | 5 | 189992 | 369.06 | 2058 | 2006 | 509.4 |
| B | 7 | 0 | 843177 | 1938.13 | 2036 | 1959 | 434.0 |
| B | 8 | 234 | 340422 | 779.8 | 2036 | 1959 | 434.0 |
| B | 5 | 172 | 260498 | 595.66 | 2036 | 1959 | 434.0 |
| C | 1 | 241 | 5224417 | 10088.64 | 1892 | 1876 | 517.7 |
| C | 4 | 5 | 647979 | 1248.11 | 1892 | 1876 | 517.7 |
| C | 12 | 252 | 531210 | 1022.54 | 1892 | 1876 | 517.7 |
| D | 8 | 176 | 4301410 | 7964.19 | 1890 | 1804 | 539.9 |
| D | 6 | 239 | 1707881 | 3160.18 | 1890 | 1804 | 539.9 |
| D | 3 | 12 | 1386809 | 2565.45 | 1890 | 1804 | 539.9 |
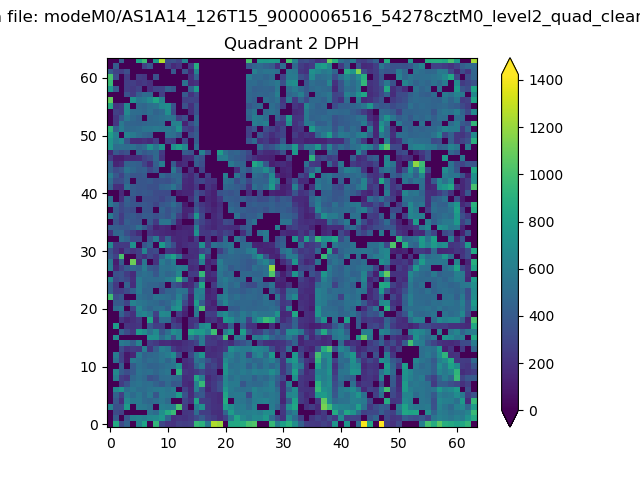
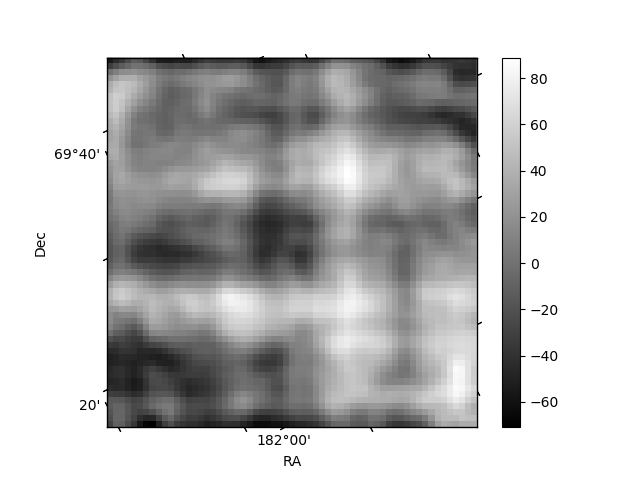
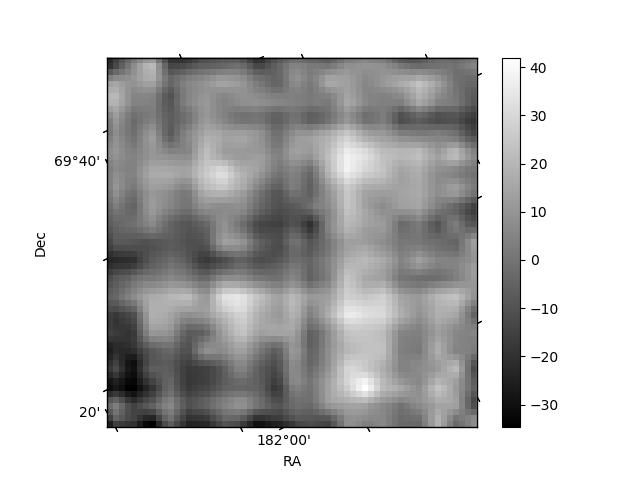
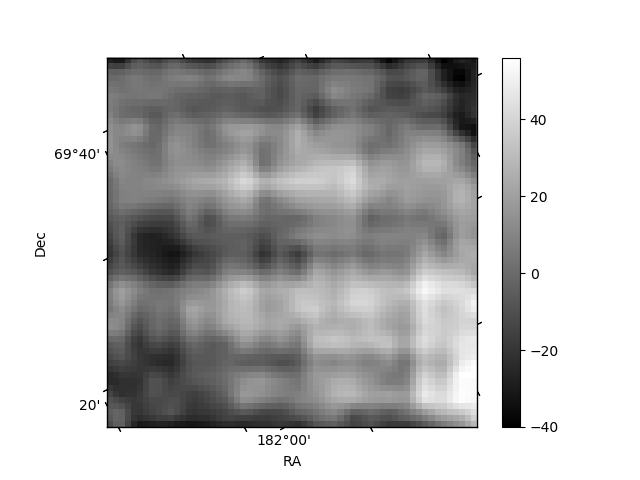
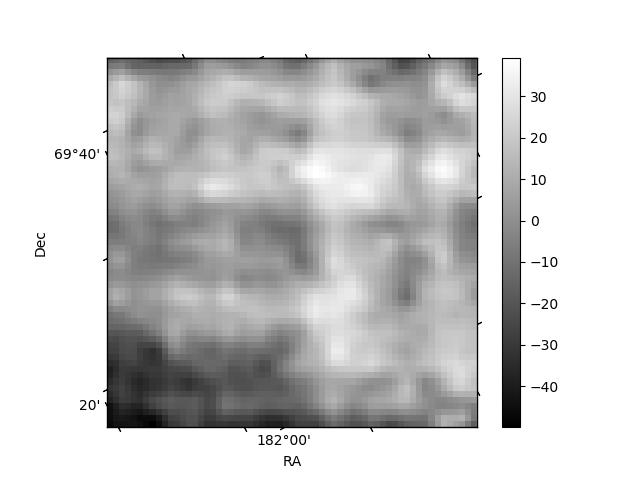
Histogram calculated using DETX and DETY for each event in the final _common_clean file
| Quadrant A | 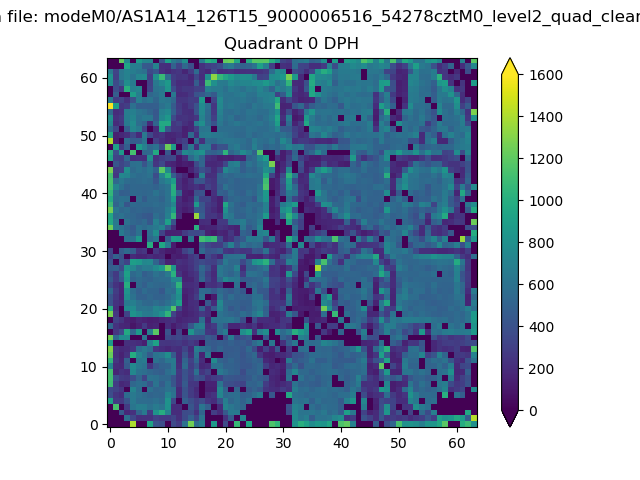 |
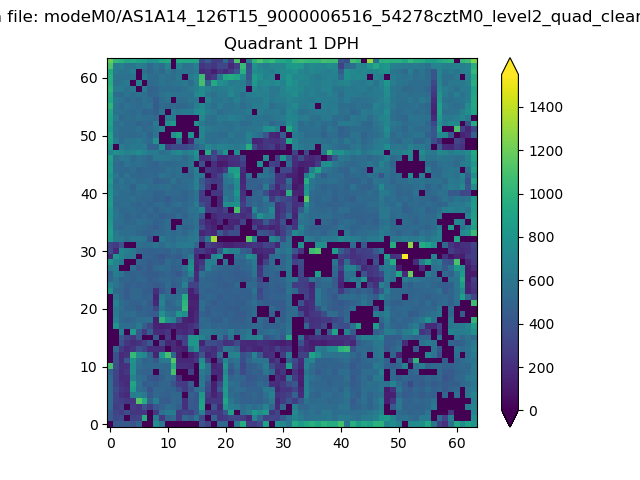 |
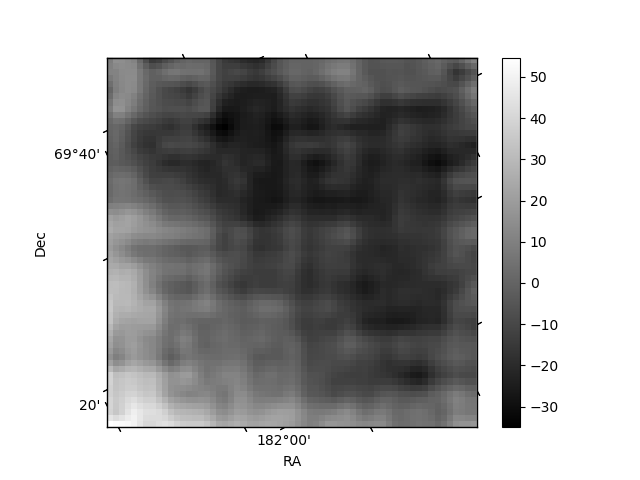
Quadrant B |
|---|---|---|---|
| Quadrant D | 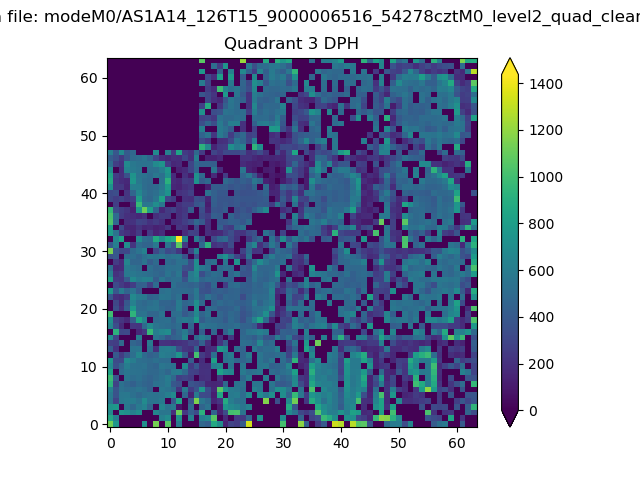 |
 |
Quadrant C |
| Plot type | Count rate plots | Images |
|---|---|---|
| Comparison with Poisson distribution Blue bars denote a histogram of data divided into 1 sec bins. Red curve is a Poisson curve with rate = median count rate of data. |
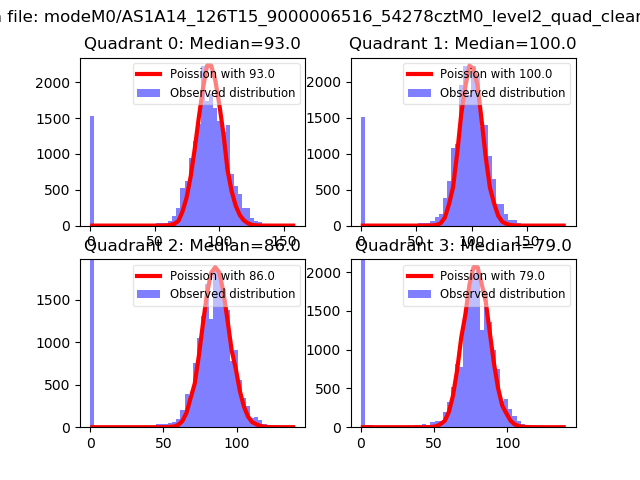 |
 |
| Quadrant-wise count rates Data is divided into 100 sec bins |
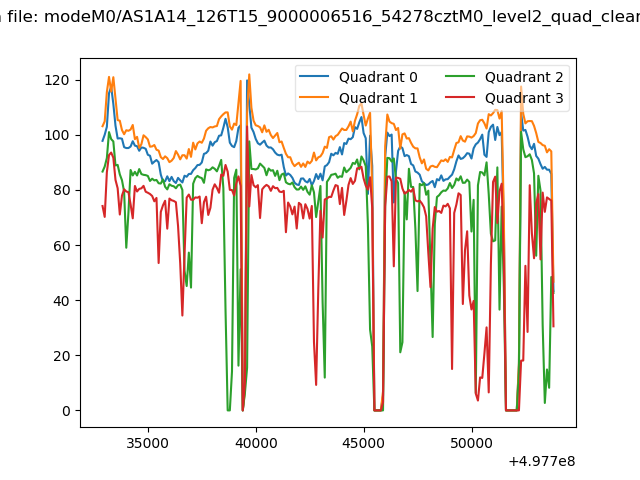 |
|
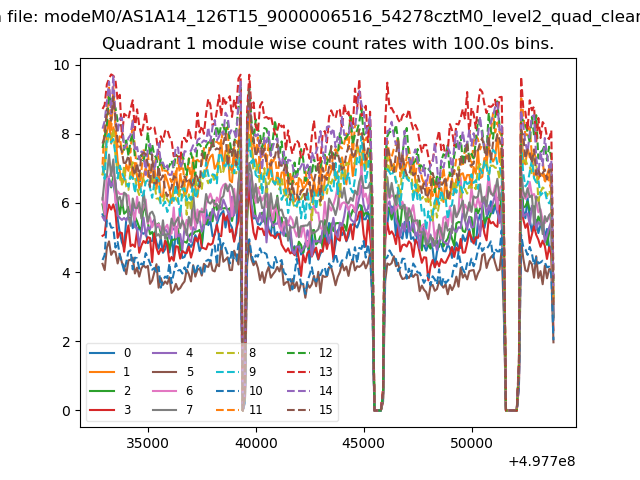
| Module-wise count rates for Quadrant A Data is divided into 100 sec bins |
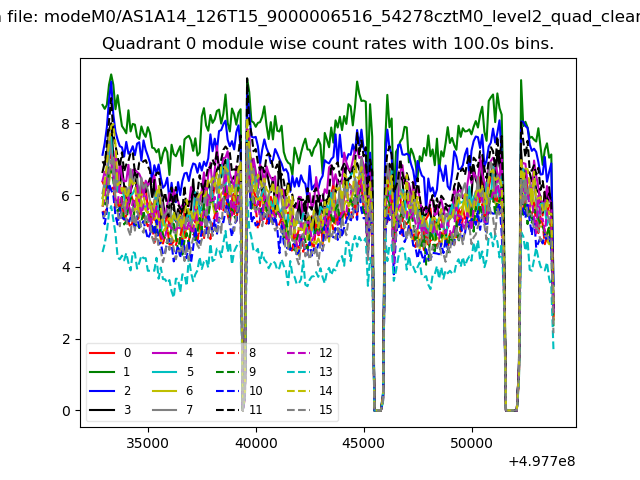 |
 |
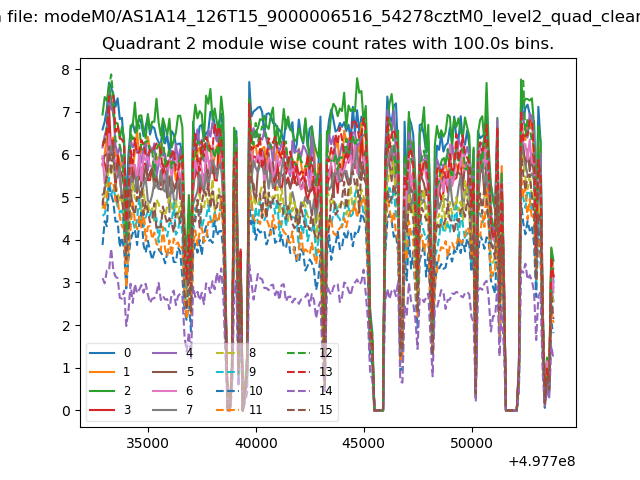
| Module-wise count rates for Quadrant B Data is divided into 100 sec bins |
 |
 |
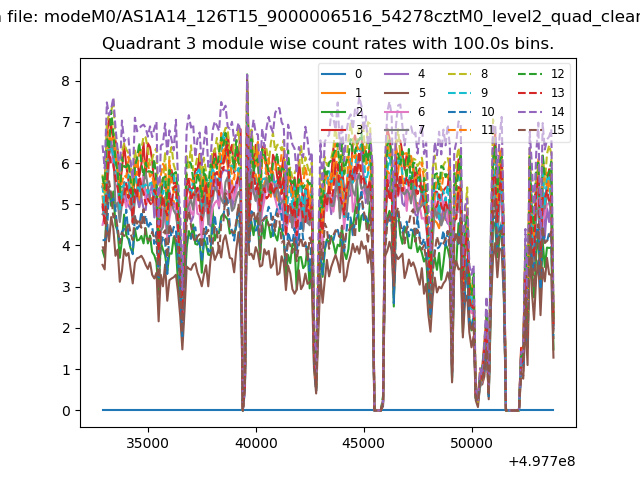
| Module-wise count rates for Quadrant C Data is divided into 100 sec bins |
 |
 |
| Module-wise count rates for Quadrant D Data is divided into 100 sec bins |
 |
 |
| Parameter | Plot |
|---|---|
| CZT HV Monitor | 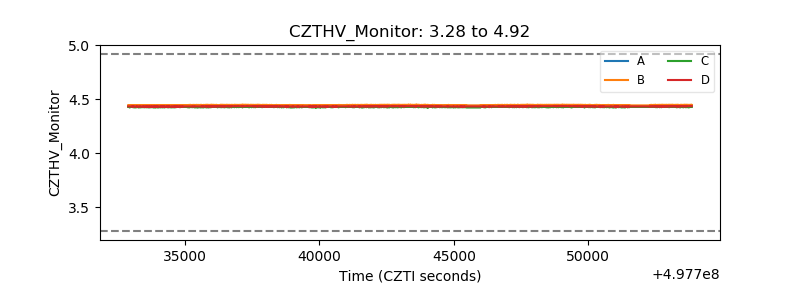 |
| D_VDD | 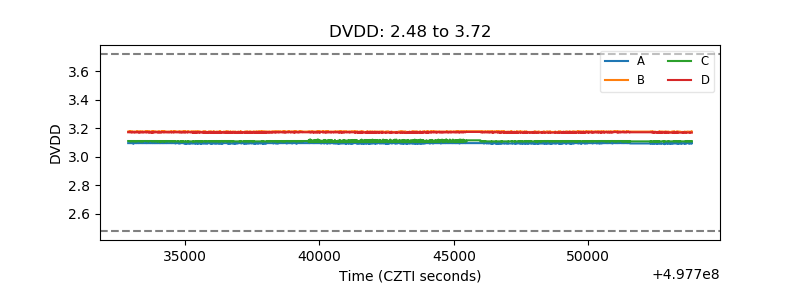 |
| Temperature 1 | 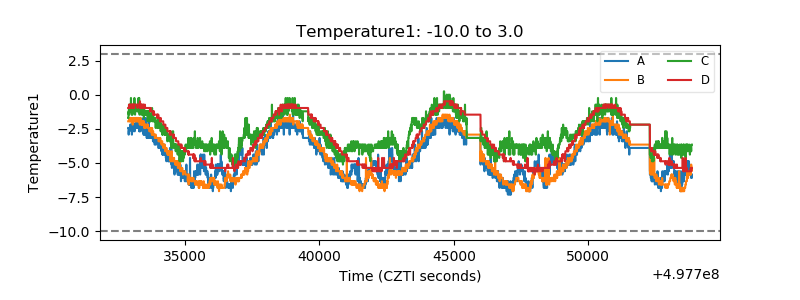 |
| Veto HV Monitor | 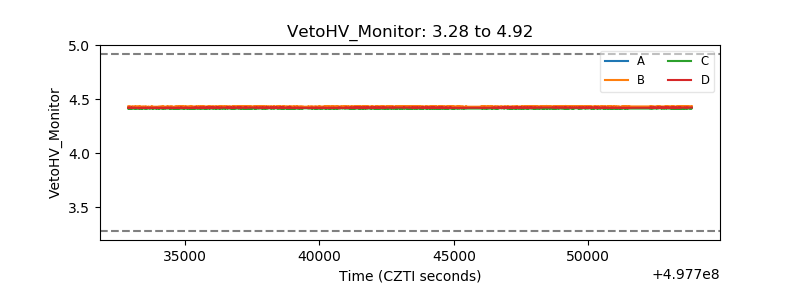 |
| Veto LLD | 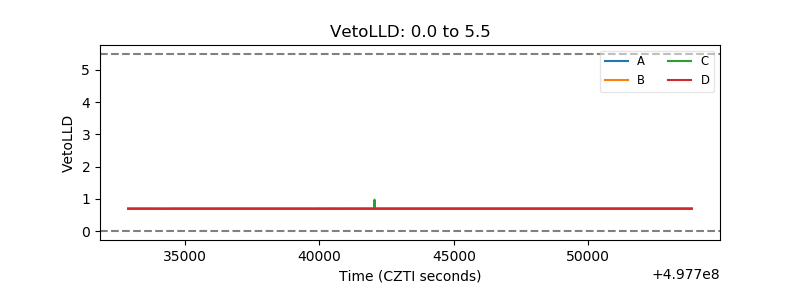 |
| Alpha Counter | 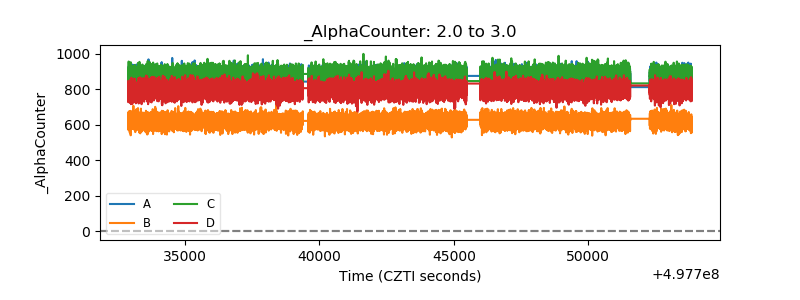 |
| _CPM_Rate | 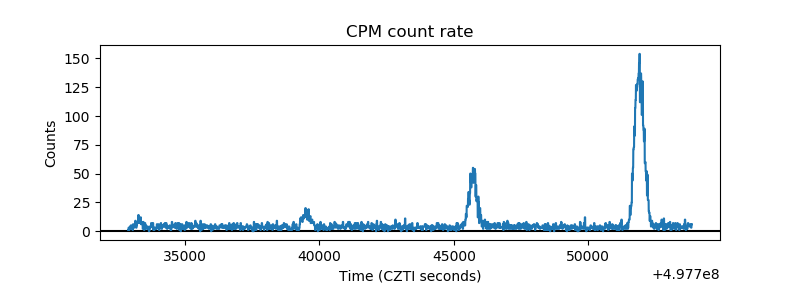 |
| CZT Counter | 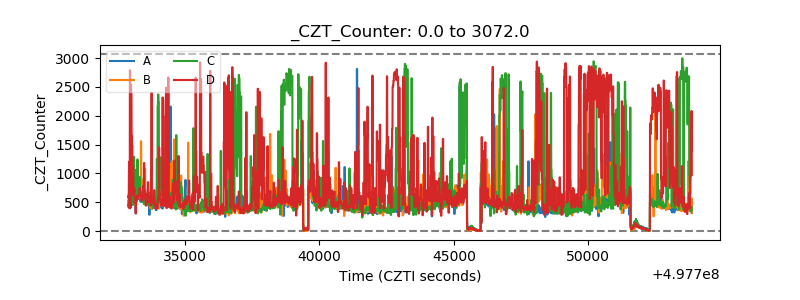 |
| +2.5 Volts monitor | 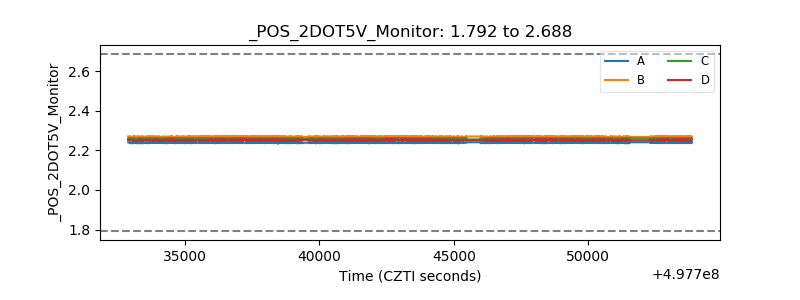 |
| +5 Volts monitor |  |
| _ROLL_ROT | 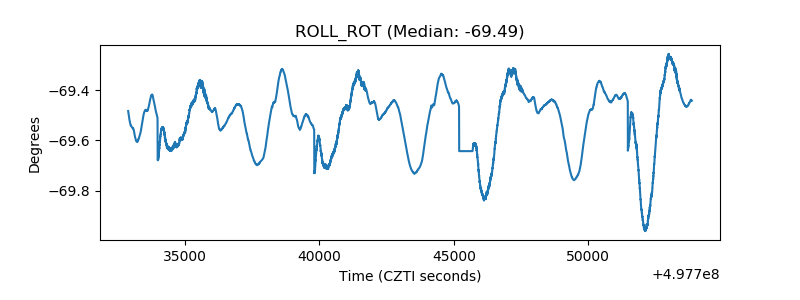 |
| _Roll_DEC |  |
| _Roll_RA | 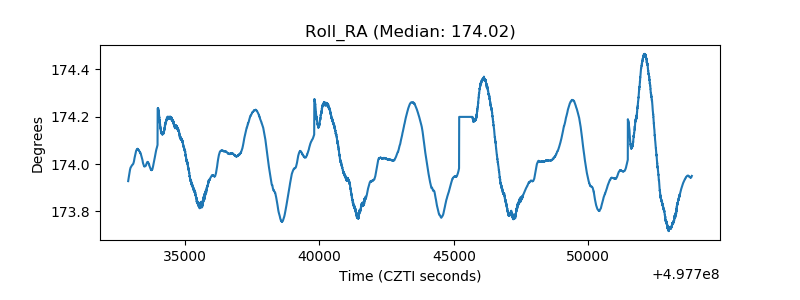 |
| Veto Counter | 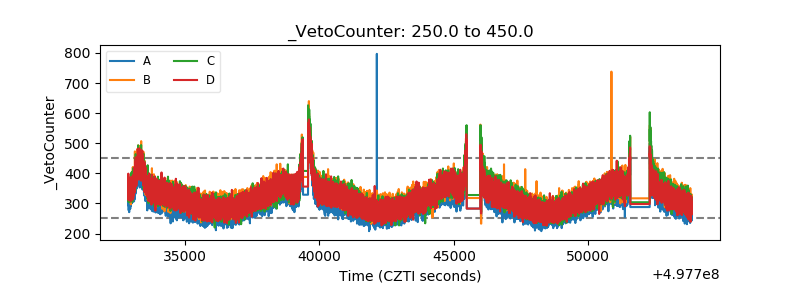 |