| Param | Original file | Final file |
|---|---|---|
| Filename | modeM0/AS1A14_126T15_9000006516_54279cztM0_level2.fits | modeM0/AS1A14_126T15_9000006516_54279cztM0_level2_quad_clean.evt |
| Size (bytes) | 466,804,800 | 96,036,480 |
| Size | 445.2 MB | 91.6 MB |
| Events in quadrant A | 3,020,965 | 644,476 |
| Events in quadrant B | 3,381,924 | 691,547 |
| Events in quadrant C | 4,765,551 | 563,292 |
| Events in quadrant D | 5,574,438 | 528,504 |
| Mode SS | |||
|---|---|---|---|
| Quadrant | BADHDUFLAG | Total packets | Discarded packets |
| A | 0 | 138 | 0 |
| B | 0 | 138 | 0 |
| C | 0 | 138 | 0 |
| D | 0 | 138 | 0 |
| Mode M0 | |||
|---|---|---|---|
| Quadrant | BADHDUFLAG | Total packets | Discarded packets |
| A | 0 | 14066 | 2 |
| B | 0 | 15406 | 1 |
| C | 0 | 19389 | 1 |
| D | 0 | 21581 | 1 |
| Mode M9 | |||
|---|---|---|---|
| Quadrant | BADHDUFLAG | Total packets | Discarded packets |
| A | 0 | 9 | 0 |
| B | 0 | 9 | 0 |
| C | 0 | 9 | 0 |
| D | 0 | 9 | 0 |
| Quadrant | Total seconds | Saturated seconds | Saturation percentage |
|---|---|---|---|
| A | 6895 | 10 | 0.145033% |
| B | 6896 | 48 | 0.696056% |
| C | 6896 | 684 | 9.918794% |
| D | 6896 | 706 | 10.237819% |
Noise dominated data is calculated using 1-second bins in cleaned event files. If a bin has >2000 counts, and if more than 50% of those come from <1% of pixels, then it is considered to be noise-dominated and hence unusable.
| Quadrant | # 1 sec bins | Bins with >0 counts | Bins with >2000 counts | High rate bins dominated by noise | Noise dominated (total time) | Noise dominated (detector-on time) | Marked lightcurve |
|---|---|---|---|---|---|---|---|
| A | 7780 | 6896 | 4 | 4 | 0.05% | 0.06% | 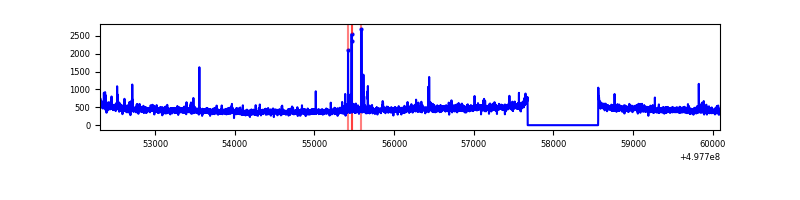 |
| B | 7781 | 6897 | 13 | 13 | 0.17% | 0.19% | 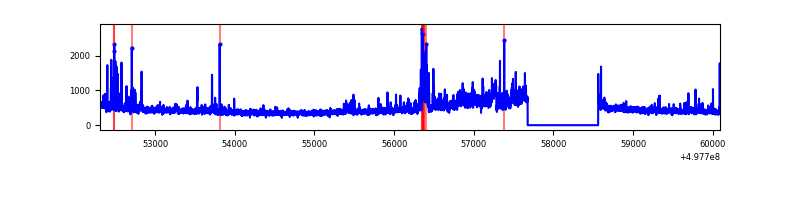 |
| C | 7781 | 6897 | 698 | 698 | 8.97% | 10.12% | 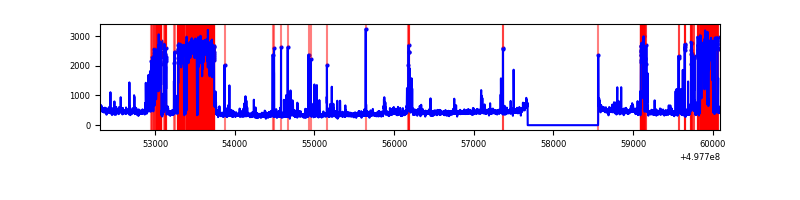 |
| D | 7781 | 6896 | 730 | 730 | 9.38% | 10.59% | 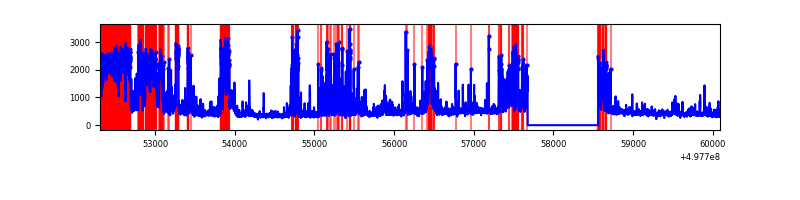 |
Top three noisy pixels from each quadrant. If the there are fewer than three noisy pixels in the level2.evt file, extra rows are filled as -1
| Pixel properties | Quadrant properties | ||||||
|---|---|---|---|---|---|---|---|
| Quadrant | DetID | PixID | Counts | Sigma | Mean | Median | Sigma |
| A | 4 | 3 | 77086 | 431.35 | 715 | 700 | 177.1 |
| A | 6 | 195 | 59797 | 333.72 | 715 | 700 | 177.1 |
| A | 11 | 3 | 55945 | 311.97 | 715 | 700 | 177.1 |
| B | 7 | 0 | 267069 | 1746.85 | 711 | 686 | 152.5 |
| B | 8 | 234 | 95963 | 624.8 | 711 | 686 | 152.5 |
| B | 5 | 185 | 67844 | 440.4 | 711 | 686 | 152.5 |
| C | 1 | 241 | 1825912 | 9909.32 | 672 | 665 | 184.2 |
| C | 14 | 254 | 115501 | 623.45 | 672 | 665 | 184.2 |
| C | 12 | 2 | 52477 | 281.29 | 672 | 665 | 184.2 |
| D | 2 | 62 | 1016061 | 5247.14 | 672 | 640 | 193.5 |
| D | 8 | 176 | 456940 | 2357.91 | 672 | 640 | 193.5 |
| D | 2 | 172 | 381168 | 1966.36 | 672 | 640 | 193.5 |
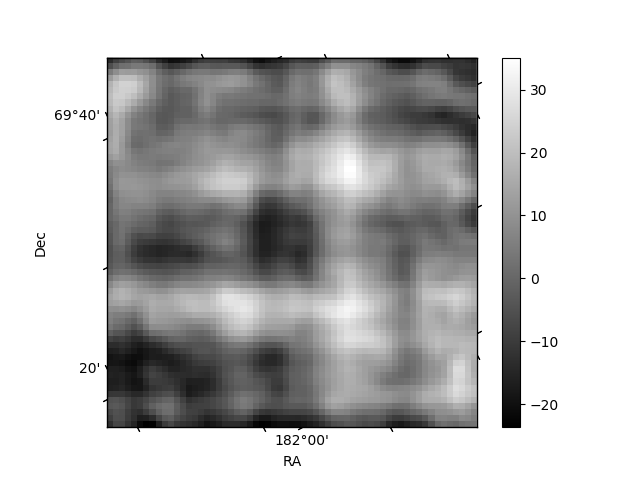
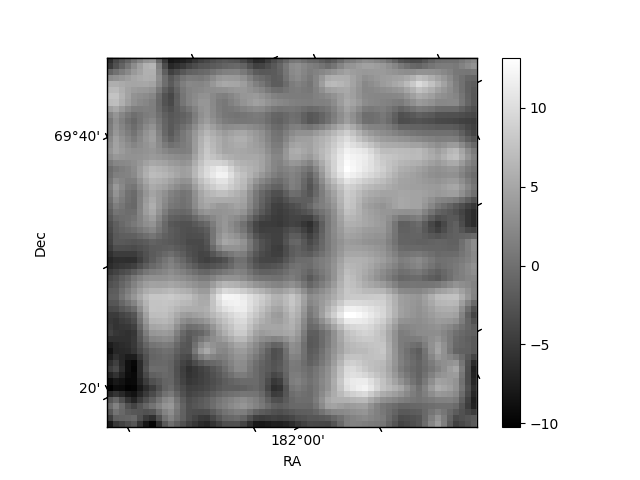
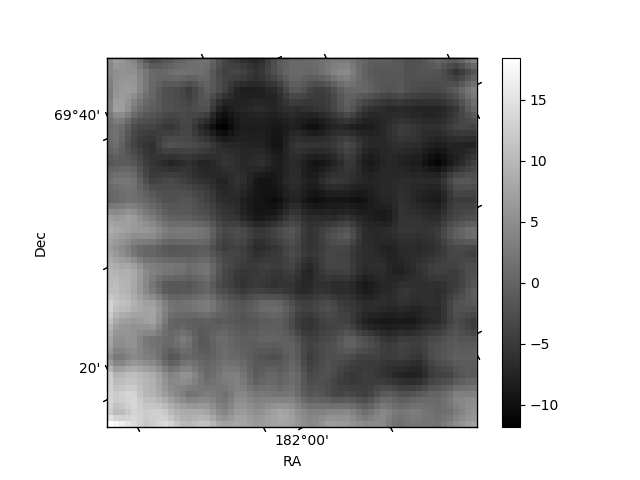
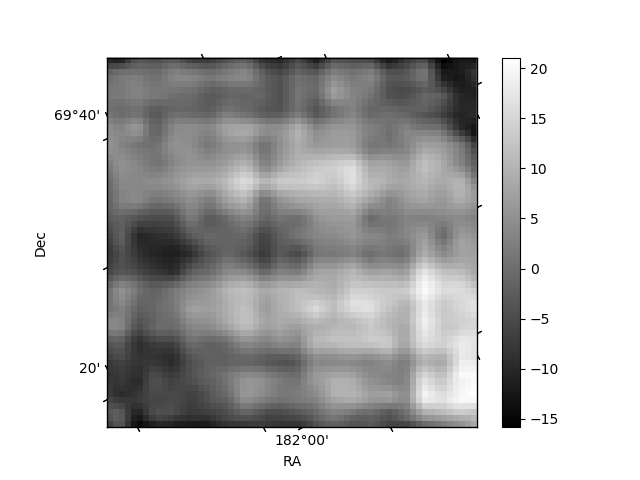
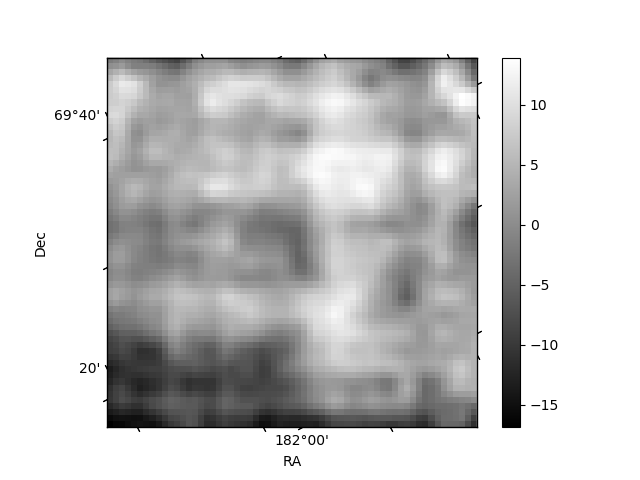
Histogram calculated using DETX and DETY for each event in the final _common_clean file
| Quadrant A | 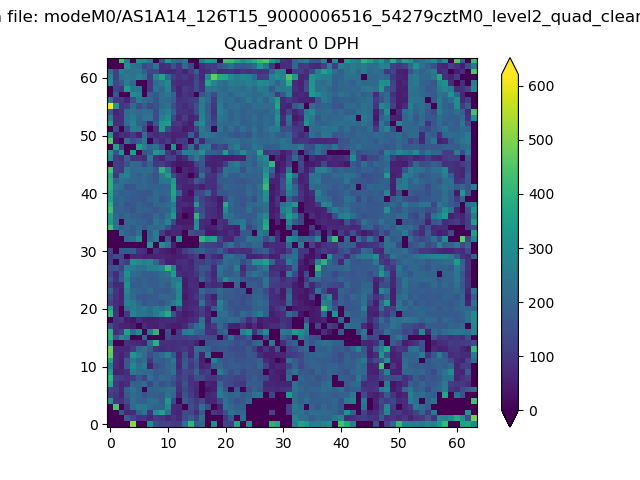 |
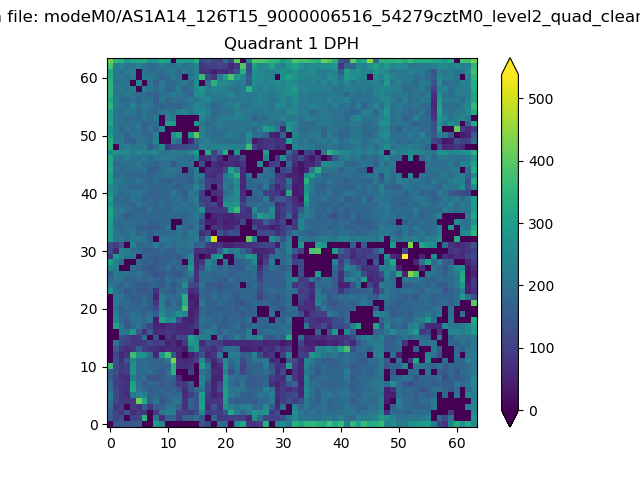 |
Quadrant B |
|---|---|---|---|
| Quadrant D | 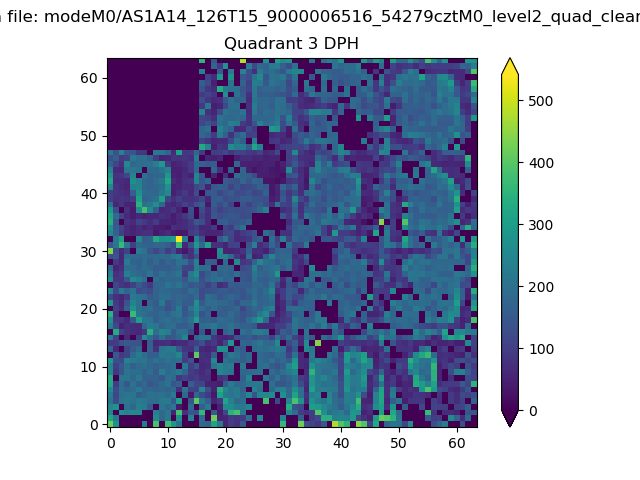 |
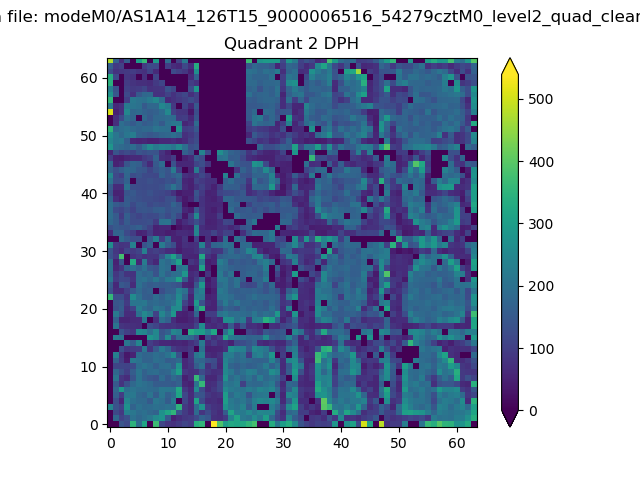 |
Quadrant C |
| Plot type | Count rate plots | Images |
|---|---|---|
| Comparison with Poisson distribution Blue bars denote a histogram of data divided into 1 sec bins. Red curve is a Poisson curve with rate = median count rate of data. |
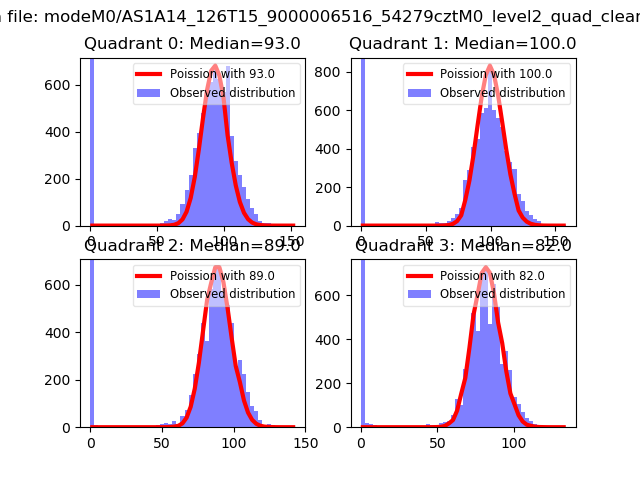 |
 |
| Quadrant-wise count rates Data is divided into 100 sec bins |
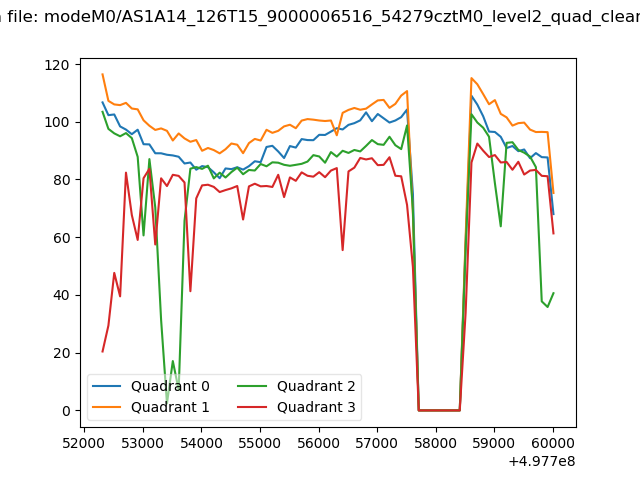 |
|
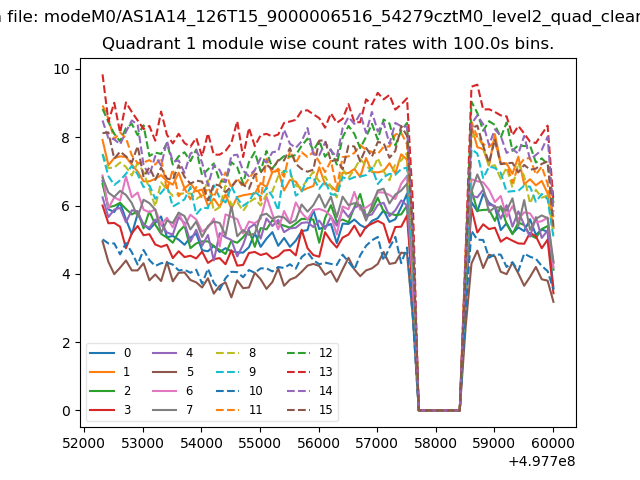
| Module-wise count rates for Quadrant A Data is divided into 100 sec bins |
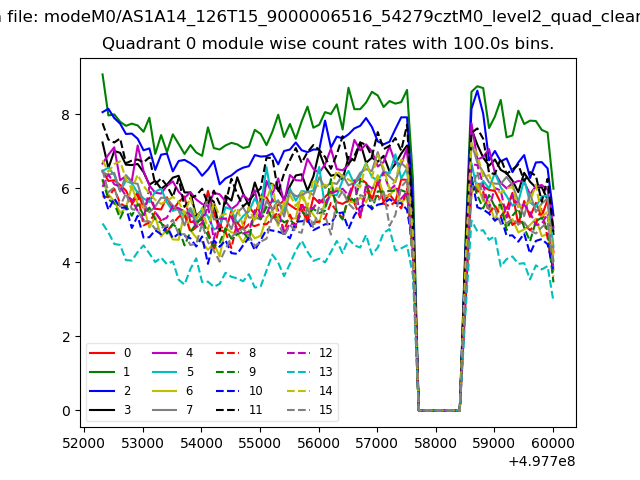 |
 |
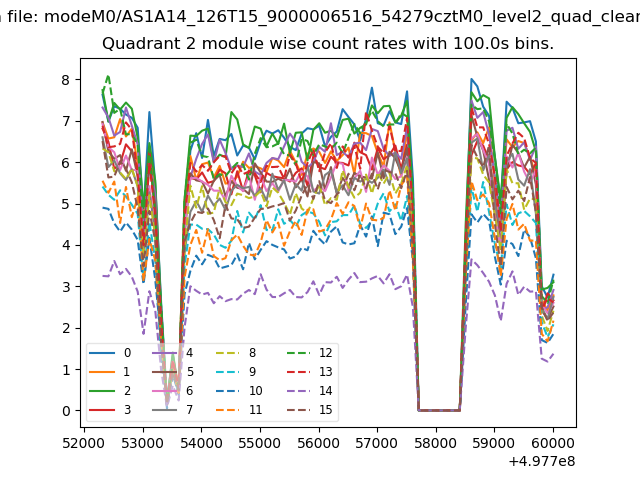
| Module-wise count rates for Quadrant B Data is divided into 100 sec bins |
 |
 |
| Module-wise count rates for Quadrant C Data is divided into 100 sec bins |
 |
 |
| Module-wise count rates for Quadrant D Data is divided into 100 sec bins |
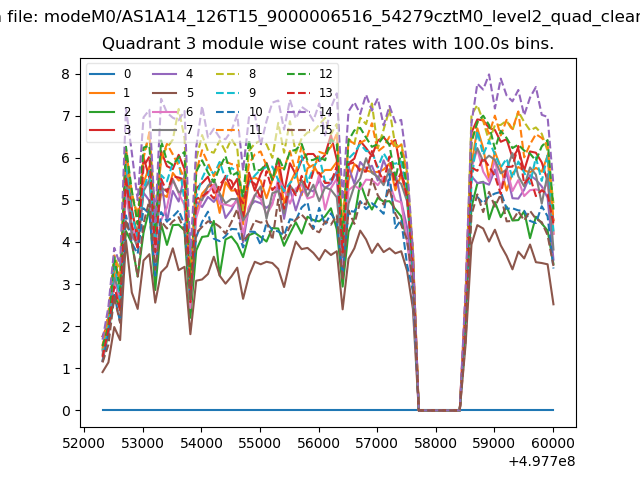 |
 |
| Parameter | Plot |
|---|---|
| CZT HV Monitor | 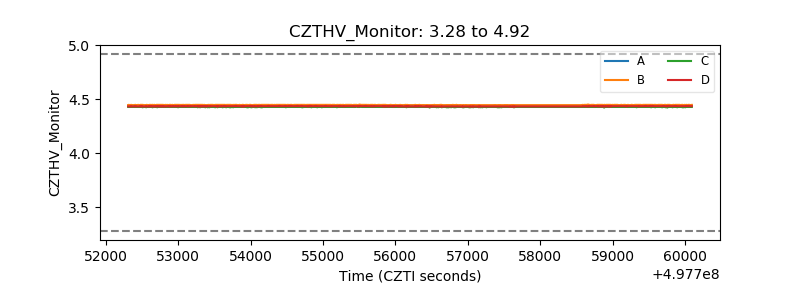 |
| D_VDD | 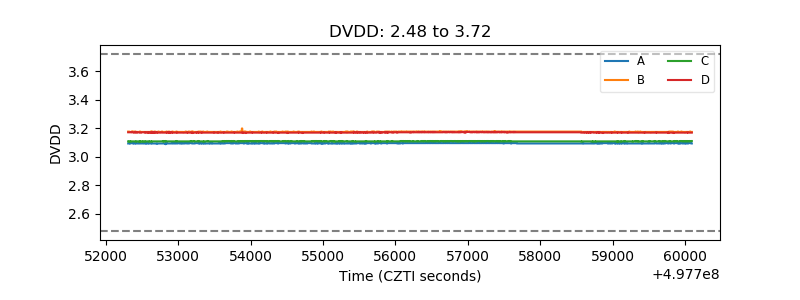 |
| Temperature 1 | 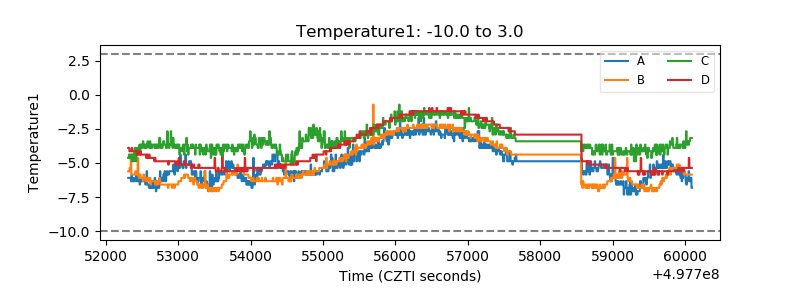 |
| Veto HV Monitor | 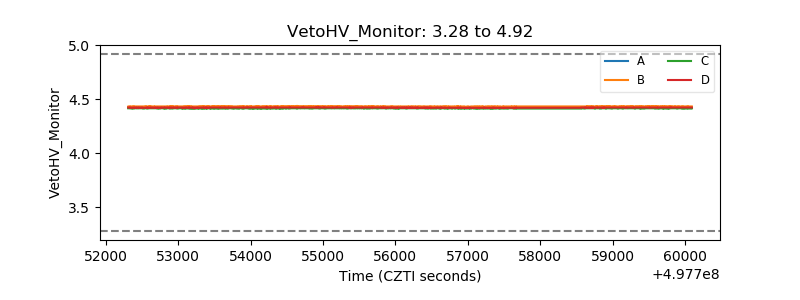 |
| Veto LLD | 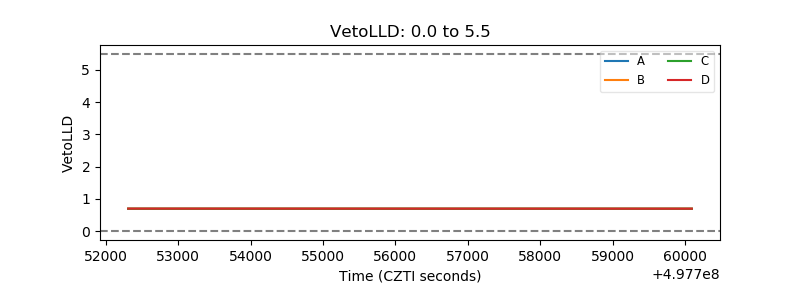 |
| Alpha Counter | 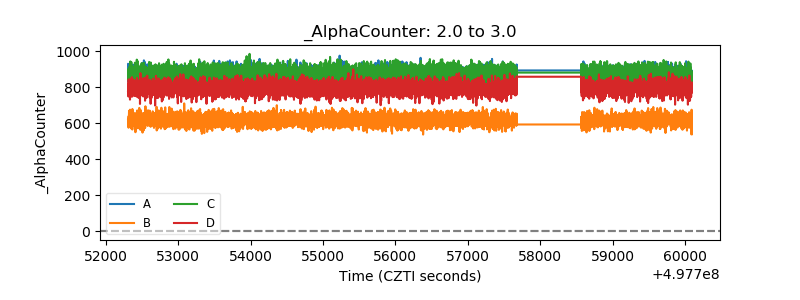 |
| _CPM_Rate | 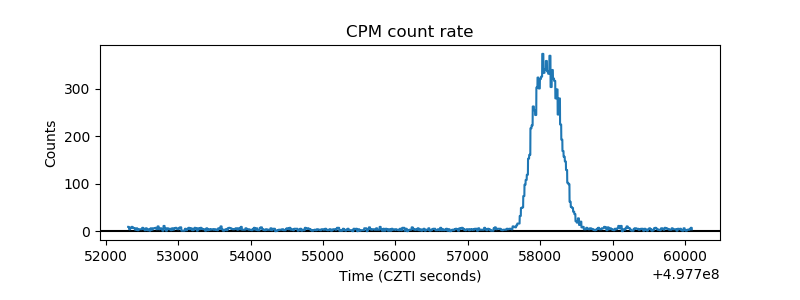 |
| CZT Counter | 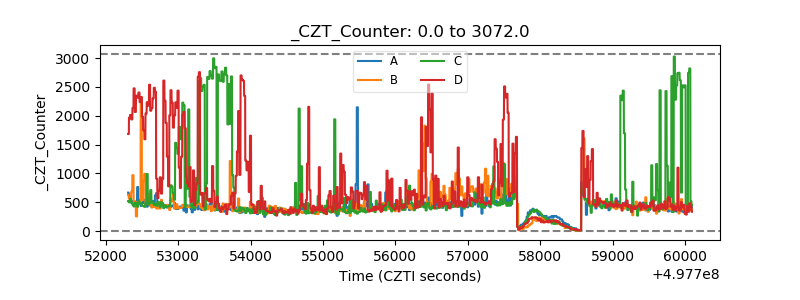 |
| +2.5 Volts monitor | 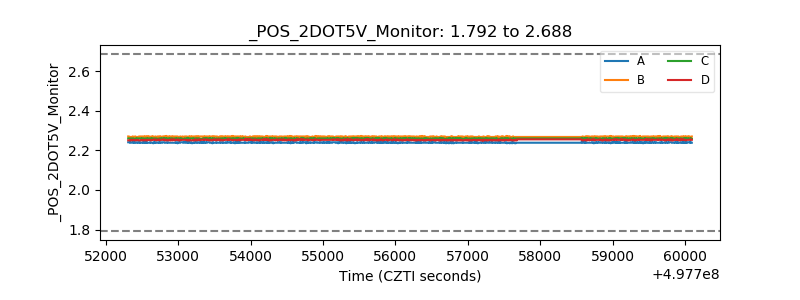 |
| +5 Volts monitor |  |
| _ROLL_ROT | 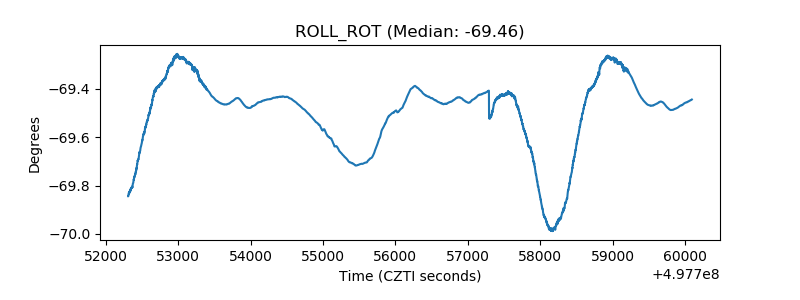 |
| _Roll_DEC | 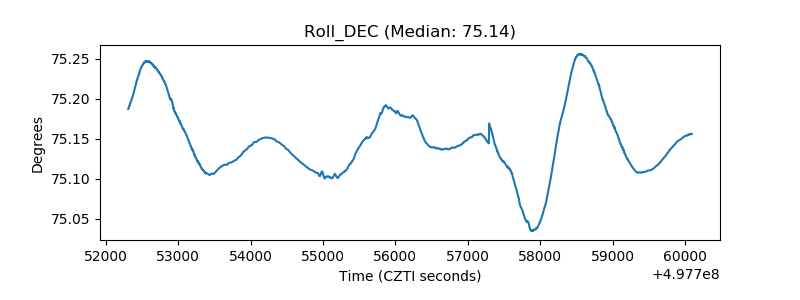 |
| _Roll_RA | 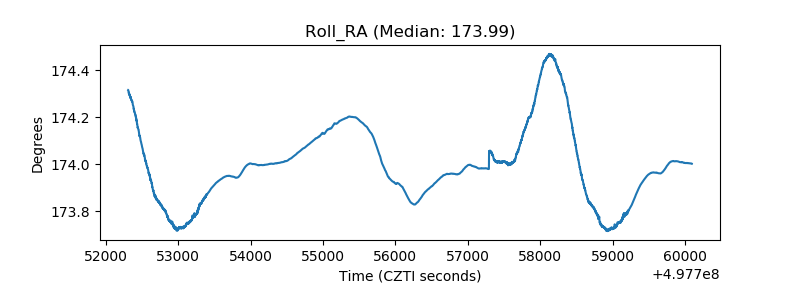 |
| Veto Counter | 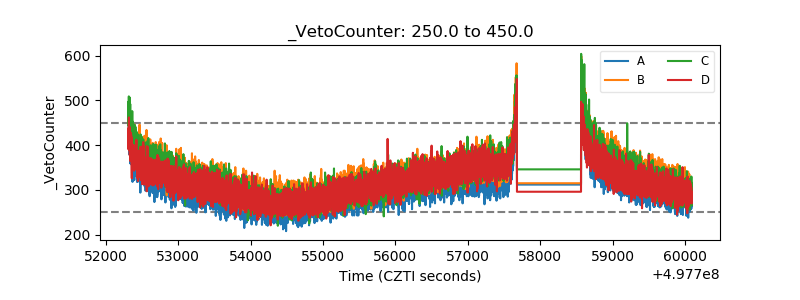 |