| Param | Original file | Final file |
|---|---|---|
| Filename | modeM0/AS1A14_126T15_9000006516_54281cztM0_level2.fits | modeM0/AS1A14_126T15_9000006516_54281cztM0_level2_quad_clean.evt |
| Size (bytes) | 445,498,560 | 90,601,920 |
| Size | 424.9 MB | 86.4 MB |
| Events in quadrant A | 2,845,981 | 614,518 |
| Events in quadrant B | 3,236,362 | 661,221 |
| Events in quadrant C | 6,475,418 | 470,654 |
| Events in quadrant D | 3,428,356 | 545,069 |
| Mode SS | |||
|---|---|---|---|
| Quadrant | BADHDUFLAG | Total packets | Discarded packets |
| A | 0 | 130 | 0 |
| B | 0 | 130 | 0 |
| C | 0 | 130 | 0 |
| D | 0 | 130 | 0 |
| Mode M0 | |||
|---|---|---|---|
| Quadrant | BADHDUFLAG | Total packets | Discarded packets |
| A | 0 | 13410 | 1 |
| B | 0 | 14328 | 1 |
| C | 0 | 23833 | 1 |
| D | 0 | 14878 | 1 |
| Mode M9 | |||
|---|---|---|---|
| Quadrant | BADHDUFLAG | Total packets | Discarded packets |
| A | 0 | 11 | 0 |
| B | 0 | 11 | 0 |
| C | 0 | 11 | 0 |
| D | 0 | 11 | 0 |
| Quadrant | Total seconds | Saturated seconds | Saturation percentage |
|---|---|---|---|
| A | 6482 | 26 | 0.401111% |
| B | 6483 | 44 | 0.678698% |
| C | 6483 | 1398 | 21.564091% |
| D | 6483 | 73 | 1.126022% |
Noise dominated data is calculated using 1-second bins in cleaned event files. If a bin has >2000 counts, and if more than 50% of those come from <1% of pixels, then it is considered to be noise-dominated and hence unusable.
| Quadrant | # 1 sec bins | Bins with >0 counts | Bins with >2000 counts | High rate bins dominated by noise | Noise dominated (total time) | Noise dominated (detector-on time) | Marked lightcurve |
|---|---|---|---|---|---|---|---|
| A | 7507 | 6483 | 10 | 10 | 0.13% | 0.15% | 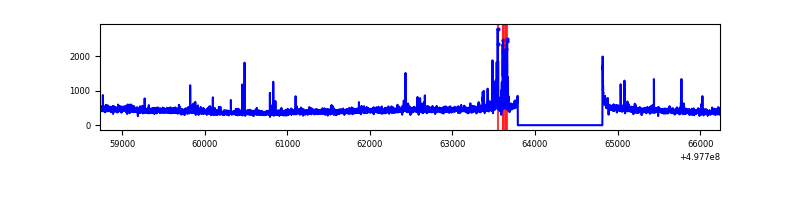 |
| B | 7508 | 6483 | 15 | 15 | 0.20% | 0.23% | 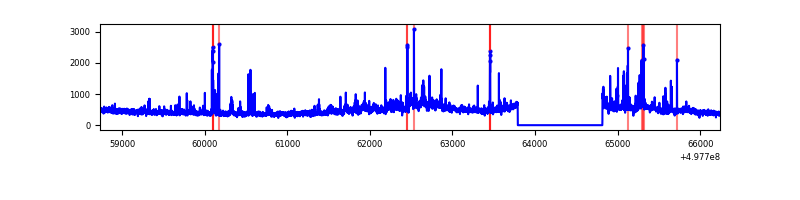 |
| C | 7508 | 6484 | 1409 | 1409 | 18.77% | 21.73% | 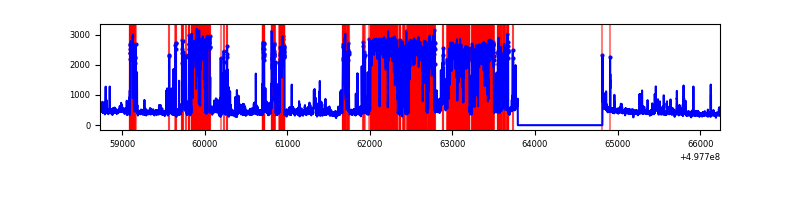 |
| D | 7508 | 6484 | 69 | 69 | 0.92% | 1.06% | 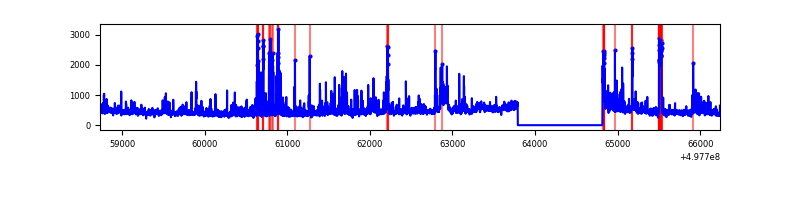 |
Top three noisy pixels from each quadrant. If the there are fewer than three noisy pixels in the level2.evt file, extra rows are filled as -1
| Pixel properties | Quadrant properties | ||||||
|---|---|---|---|---|---|---|---|
| Quadrant | DetID | PixID | Counts | Sigma | Mean | Median | Sigma |
| A | 3 | 110 | 72492 | 433.52 | 671 | 653 | 165.7 |
| A | 4 | 3 | 50036 | 298.01 | 671 | 653 | 165.7 |
| A | 11 | 3 | 28706 | 169.29 | 671 | 653 | 165.7 |
| B | 7 | 0 | 299140 | 2086.16 | 665 | 640 | 143.1 |
| B | 5 | 185 | 94688 | 657.28 | 665 | 640 | 143.1 |
| B | 8 | 234 | 46910 | 323.37 | 665 | 640 | 143.1 |
| C | 1 | 241 | 3627229 | 22209.3 | 591 | 585 | 163.3 |
| C | 4 | 5 | 357091 | 2183.22 | 591 | 585 | 163.3 |
| C | 14 | 254 | 96068 | 584.73 | 591 | 585 | 163.3 |
| D | 6 | 239 | 327538 | 1782.0 | 641 | 611 | 183.5 |
| D | 2 | 153 | 167338 | 908.79 | 641 | 611 | 183.5 |
| D | 2 | 120 | 65836 | 355.52 | 641 | 611 | 183.5 |
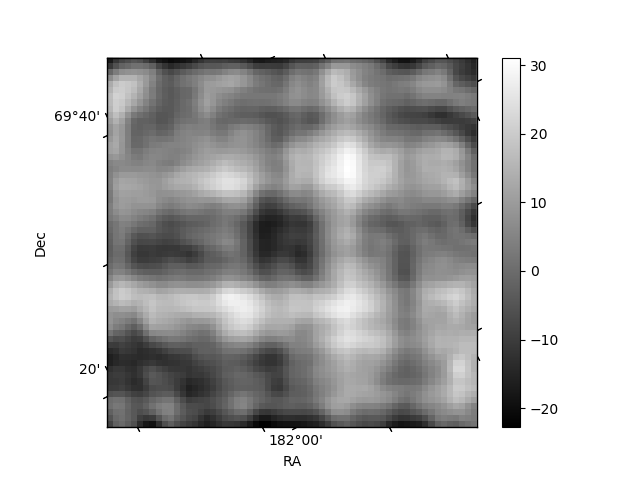
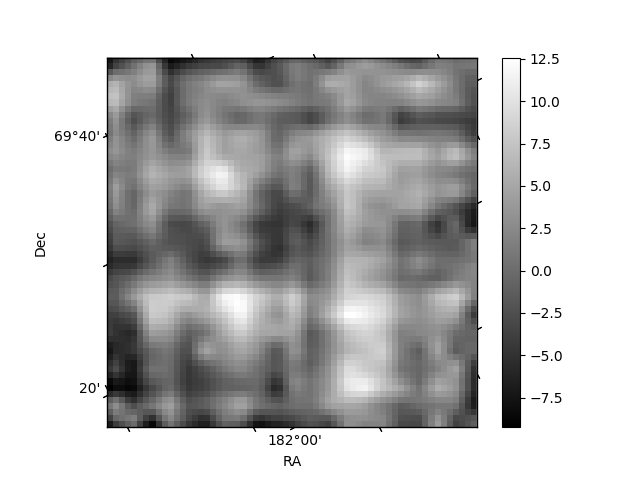
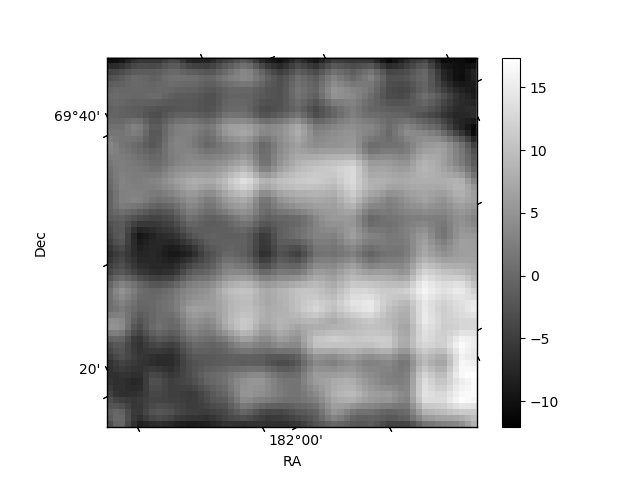
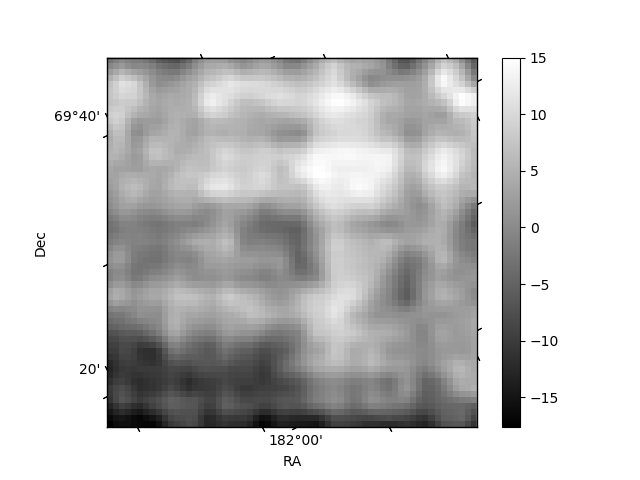
Histogram calculated using DETX and DETY for each event in the final _common_clean file
| Quadrant A | 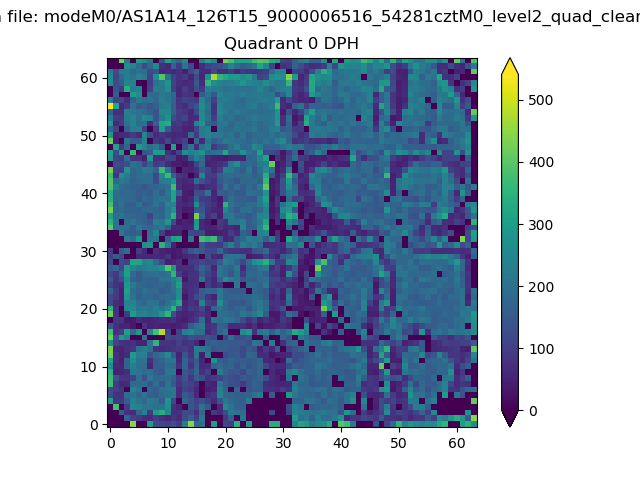 |
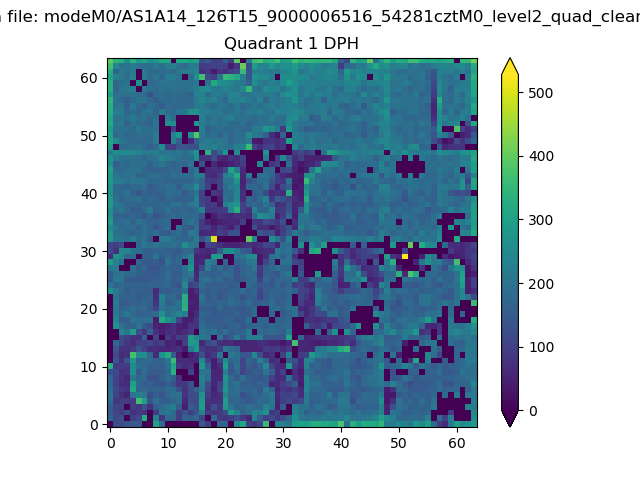 |
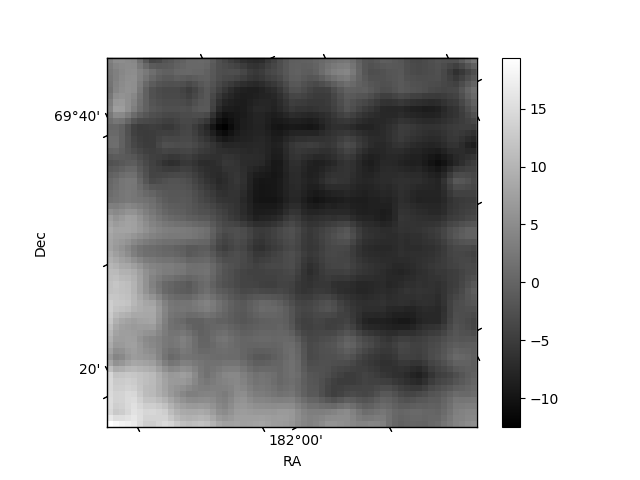
Quadrant B |
|---|---|---|---|
| Quadrant D | 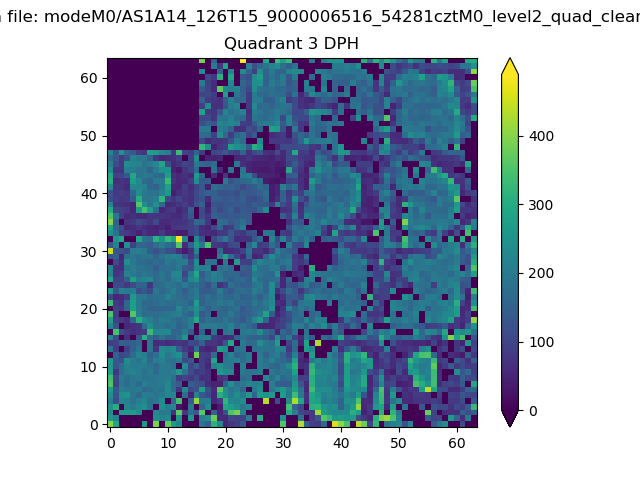 |
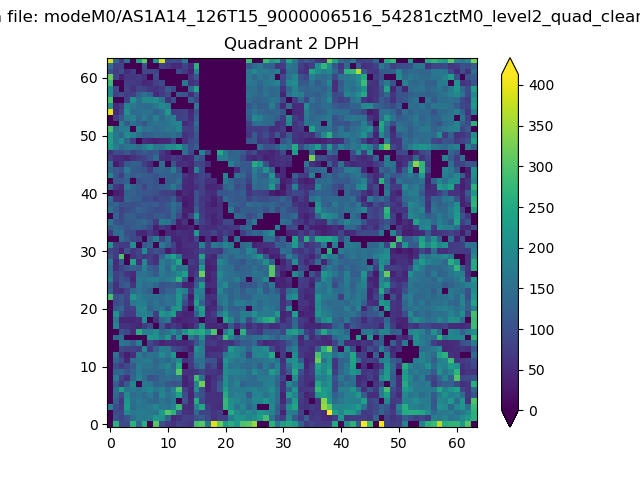 |
Quadrant C |
| Plot type | Count rate plots | Images |
|---|---|---|
| Comparison with Poisson distribution Blue bars denote a histogram of data divided into 1 sec bins. Red curve is a Poisson curve with rate = median count rate of data. |
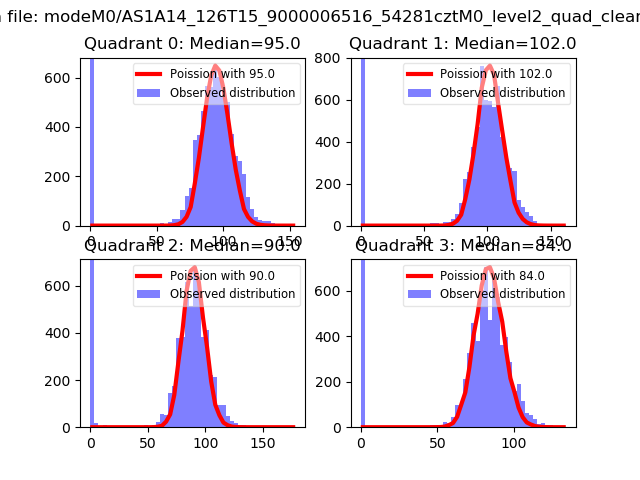 |
 |
| Quadrant-wise count rates Data is divided into 100 sec bins |
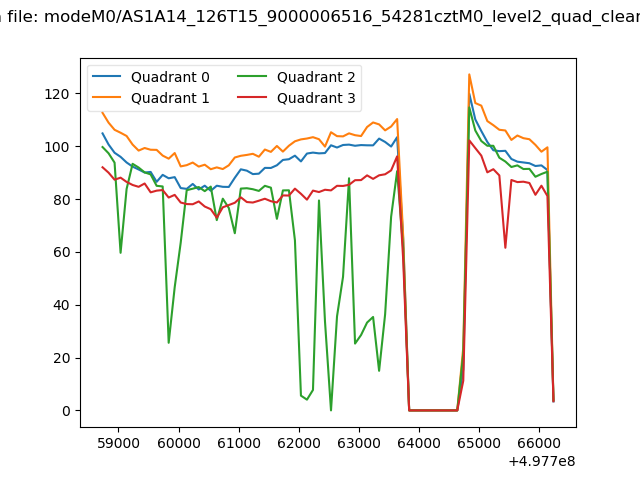 |
|
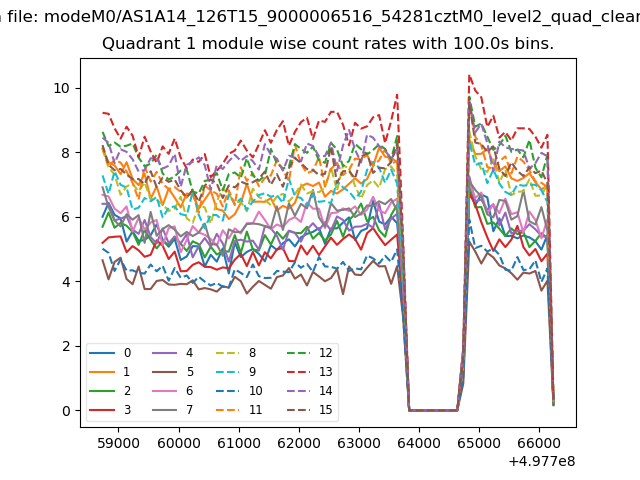
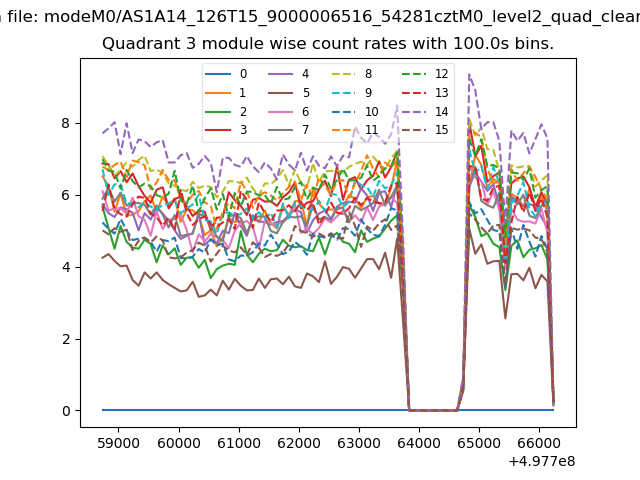
| Module-wise count rates for Quadrant A Data is divided into 100 sec bins |
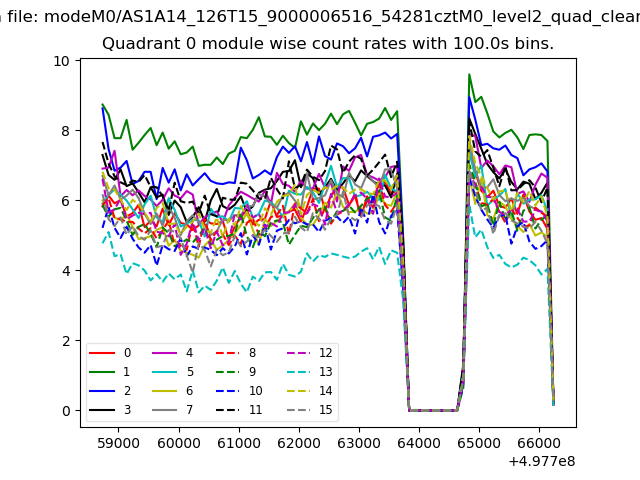 |
 |
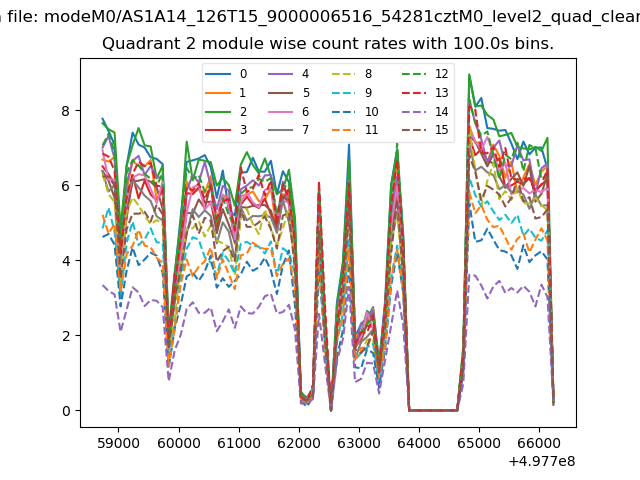
| Module-wise count rates for Quadrant B Data is divided into 100 sec bins |
 |
 |
| Module-wise count rates for Quadrant C Data is divided into 100 sec bins |
 |
 |
| Module-wise count rates for Quadrant D Data is divided into 100 sec bins |
 |
 |
| Parameter | Plot |
|---|---|
| CZT HV Monitor | 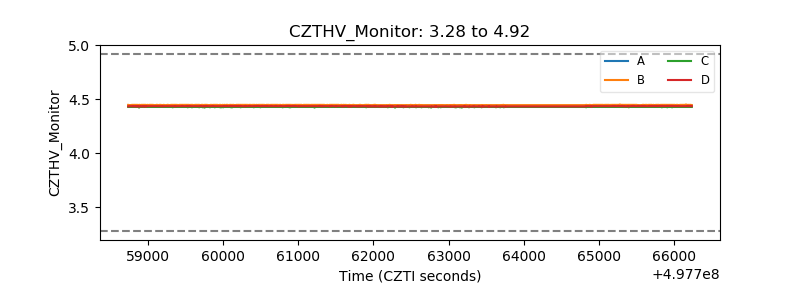 |
| D_VDD | 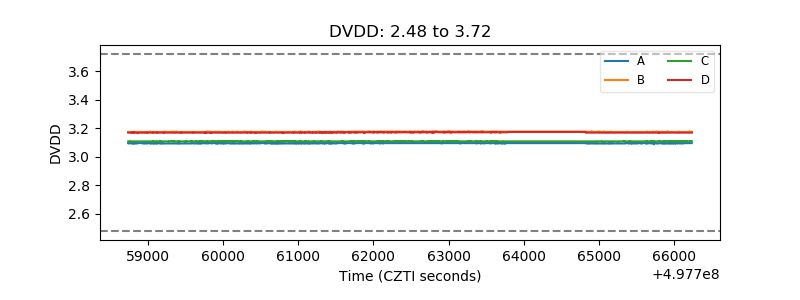 |
| Temperature 1 | 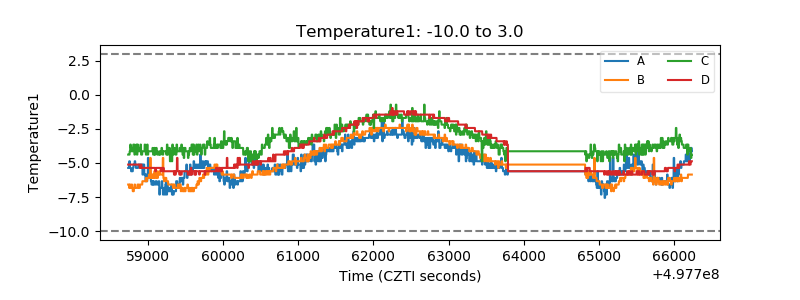 |
| Veto HV Monitor | 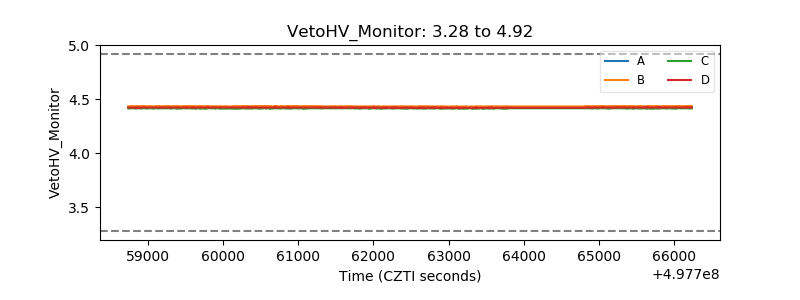 |
| Veto LLD | 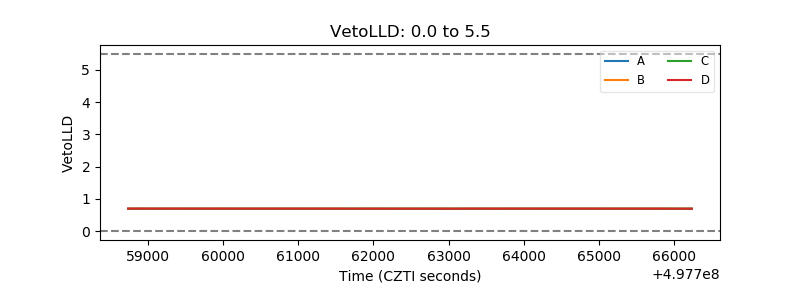 |
| Alpha Counter | 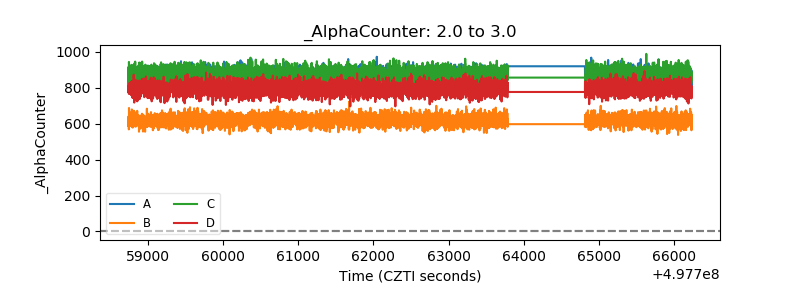 |
| _CPM_Rate | 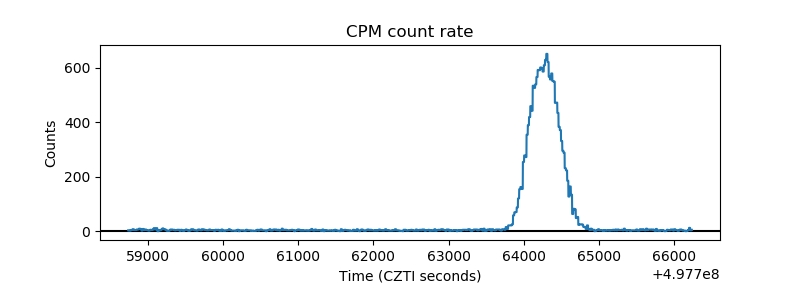 |
| CZT Counter | 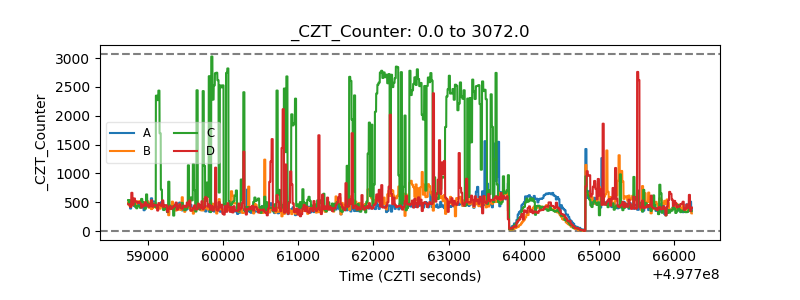 |
| +2.5 Volts monitor |  |
| +5 Volts monitor | 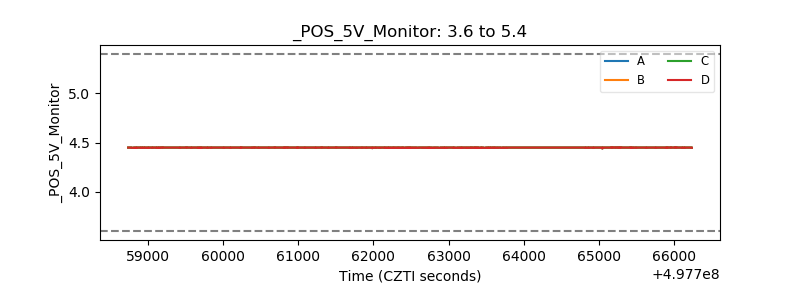 |
| _ROLL_ROT | 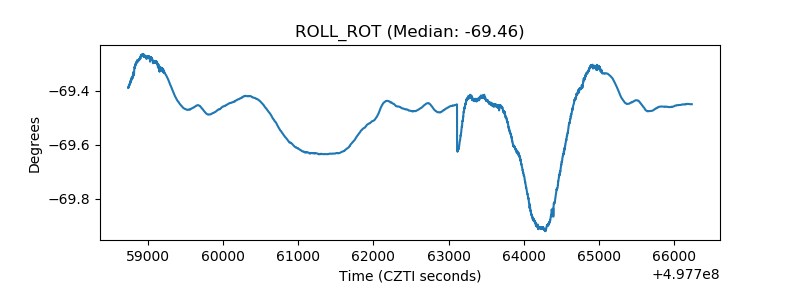 |
| _Roll_DEC | 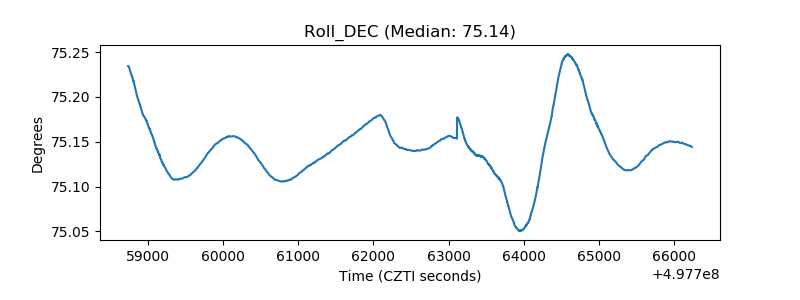 |
| _Roll_RA | 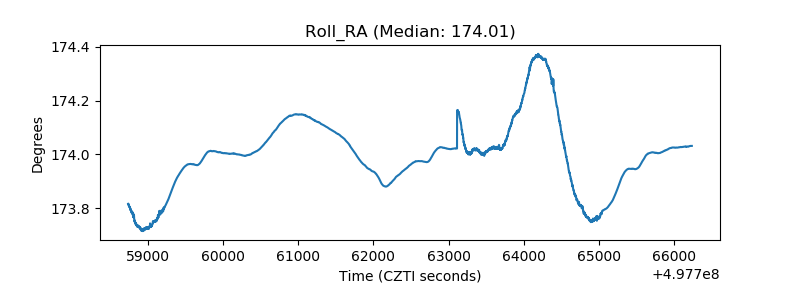 |
| Veto Counter | 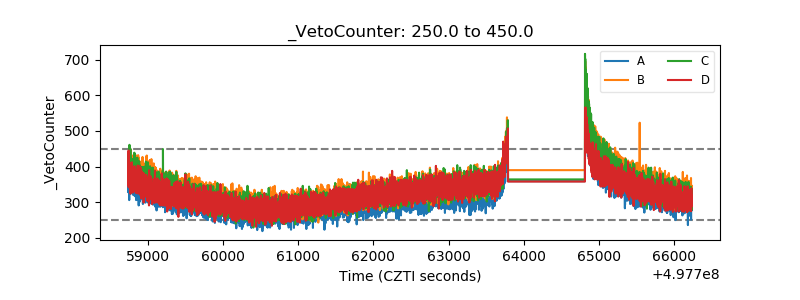 |