| Param | Original file | Final file |
|---|---|---|
| Filename | modeM0/AS1A14_126T15_9000006516_54283cztM0_level2.fits | modeM0/AS1A14_126T15_9000006516_54283cztM0_level2_quad_clean.evt |
| Size (bytes) | 483,243,840 | 90,601,920 |
| Size | 460.9 MB | 86.4 MB |
| Events in quadrant A | 3,159,305 | 622,085 |
| Events in quadrant B | 3,724,891 | 673,450 |
| Events in quadrant C | 3,276,793 | 582,553 |
| Events in quadrant D | 7,241,762 | 429,439 |
| Mode SS | |||
|---|---|---|---|
| Quadrant | BADHDUFLAG | Total packets | Discarded packets |
| A | 0 | 126 | 0 |
| B | 0 | 126 | 0 |
| C | 0 | 126 | 0 |
| D | 0 | 126 | 0 |
| Mode M0 | |||
|---|---|---|---|
| Quadrant | BADHDUFLAG | Total packets | Discarded packets |
| A | 0 | 13889 | 2 |
| B | 0 | 15320 | 1 |
| C | 0 | 14525 | 4 |
| D | 0 | 25796 | 2 |
| Mode M9 | |||
|---|---|---|---|
| Quadrant | BADHDUFLAG | Total packets | Discarded packets |
| A | 0 | 11 | 0 |
| B | 0 | 11 | 0 |
| C | 0 | 11 | 0 |
| D | 0 | 11 | 0 |
| Quadrant | Total seconds | Saturated seconds | Saturation percentage |
|---|---|---|---|
| A | 6240 | 122 | 1.955128% |
| B | 6240 | 45 | 0.721154% |
| C | 6240 | 133 | 2.131410% |
| D | 6241 | 1596 | 25.572825% |
Noise dominated data is calculated using 1-second bins in cleaned event files. If a bin has >2000 counts, and if more than 50% of those come from <1% of pixels, then it is considered to be noise-dominated and hence unusable.
| Quadrant | # 1 sec bins | Bins with >0 counts | Bins with >2000 counts | High rate bins dominated by noise | Noise dominated (total time) | Noise dominated (detector-on time) | Marked lightcurve |
|---|---|---|---|---|---|---|---|
| A | 7401 | 6242 | 96 | 96 | 1.30% | 1.54% | 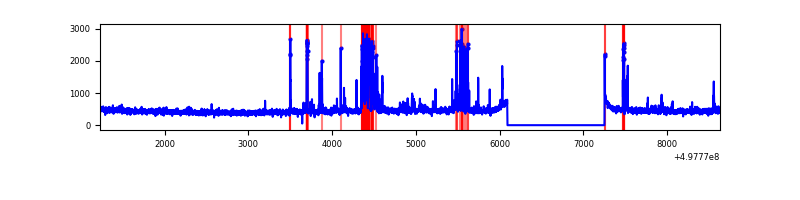 |
| B | 7401 | 6242 | 11 | 11 | 0.15% | 0.18% | 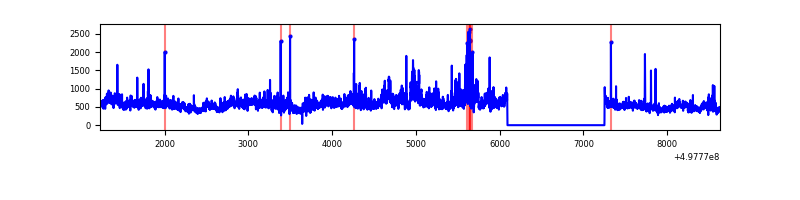 |
| C | 7401 | 6242 | 143 | 143 | 1.93% | 2.29% | 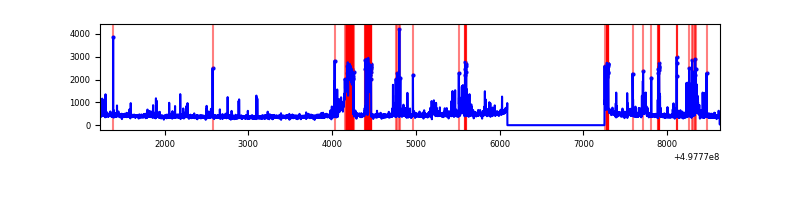 |
| D | 7401 | 6241 | 1497 | 1497 | 20.23% | 23.99% | 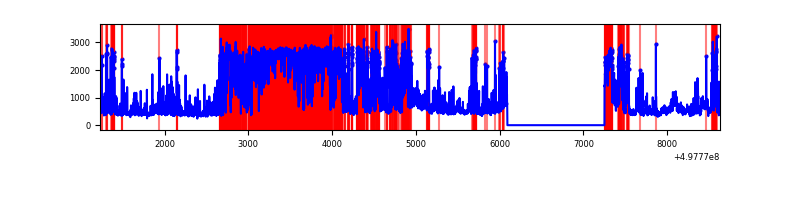 |
Top three noisy pixels from each quadrant. If the there are fewer than three noisy pixels in the level2.evt file, extra rows are filled as -1
| Pixel properties | Quadrant properties | ||||||
|---|---|---|---|---|---|---|---|
| Quadrant | DetID | PixID | Counts | Sigma | Mean | Median | Sigma |
| A | 7 | 29 | 386176 | 2325.54 | 664 | 648 | 165.8 |
| A | 11 | 3 | 47773 | 284.26 | 664 | 648 | 165.8 |
| A | 4 | 3 | 36426 | 215.82 | 664 | 648 | 165.8 |
| B | 7 | 0 | 914185 | 6481.89 | 656 | 633 | 140.9 |
| B | 5 | 185 | 66197 | 465.19 | 656 | 633 | 140.9 |
| B | 0 | 213 | 43142 | 301.61 | 656 | 633 | 140.9 |
| C | 12 | 2 | 266029 | 1511.77 | 632 | 626 | 175.6 |
| C | 12 | 249 | 156225 | 886.31 | 632 | 626 | 175.6 |
| C | 12 | 252 | 134971 | 765.25 | 632 | 626 | 175.6 |
| D | 8 | 176 | 3220121 | 20162.24 | 555 | 529 | 159.7 |
| D | 6 | 239 | 765347 | 4789.56 | 555 | 529 | 159.7 |
| D | 11 | 176 | 335019 | 2094.7 | 555 | 529 | 159.7 |
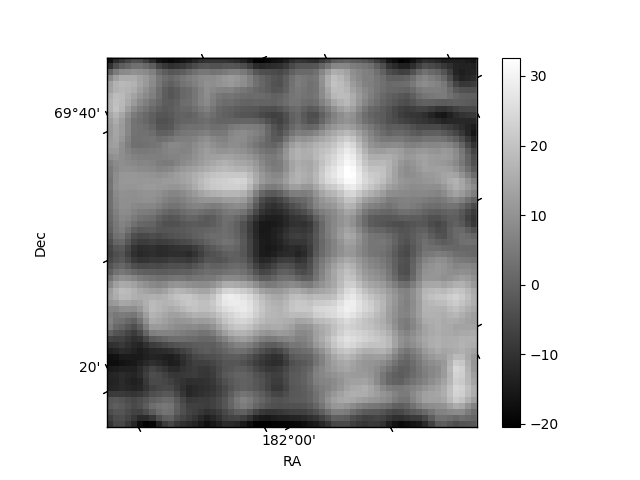
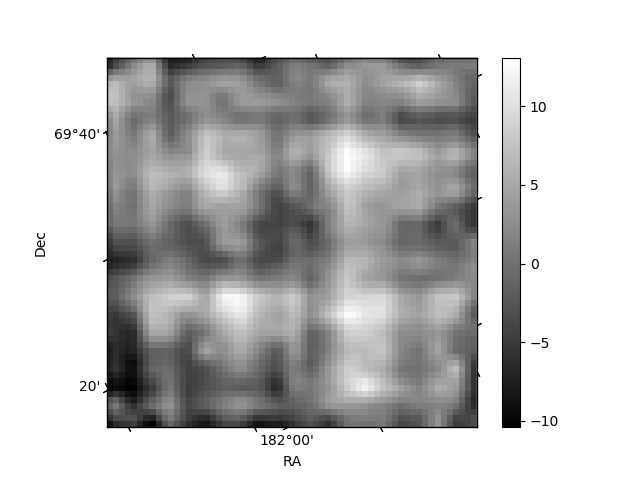
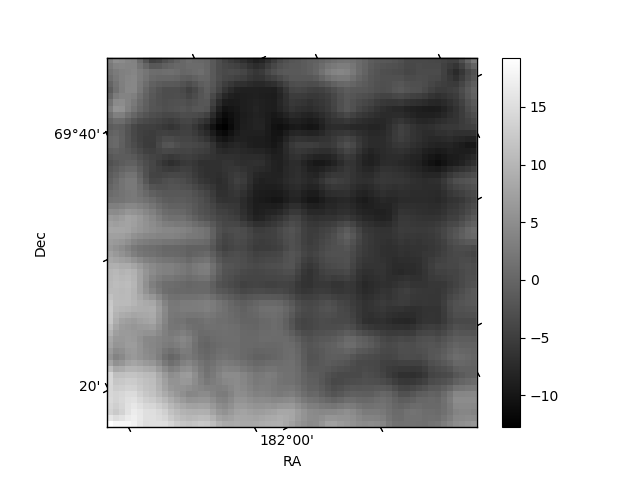
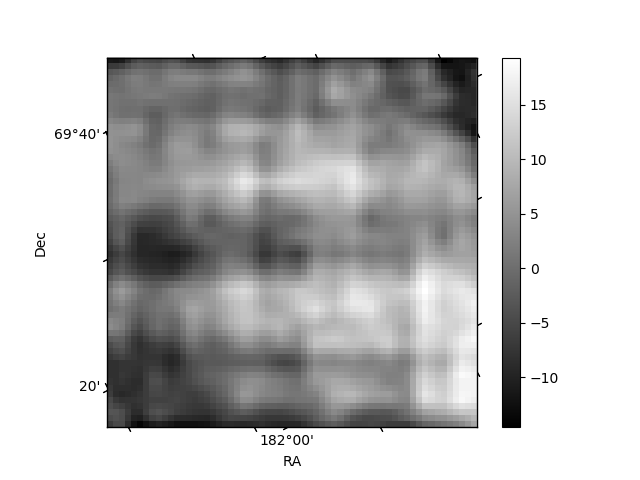
Histogram calculated using DETX and DETY for each event in the final _common_clean file
| Quadrant A | 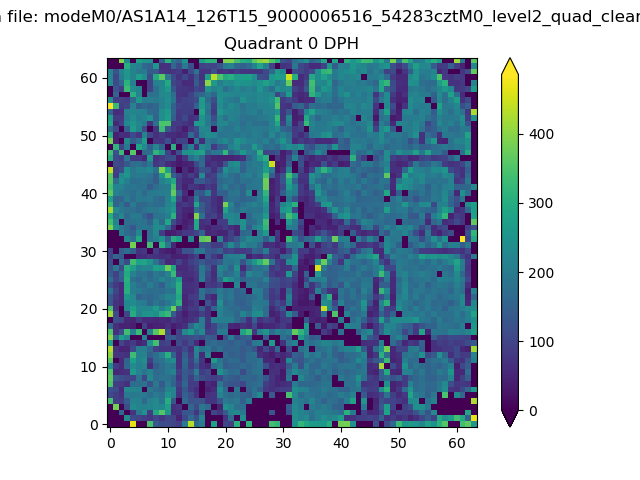 |
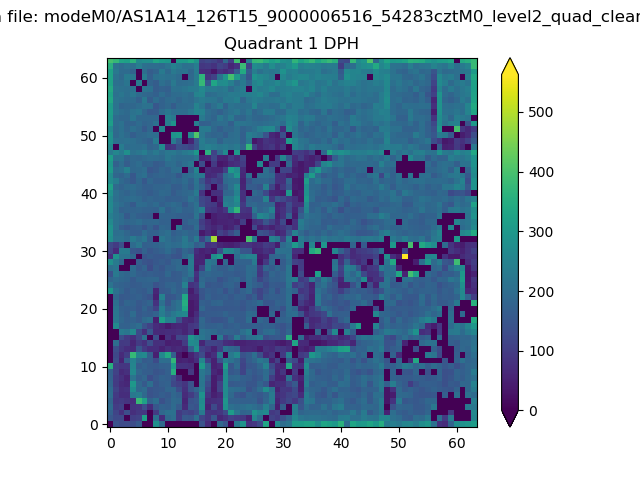 |
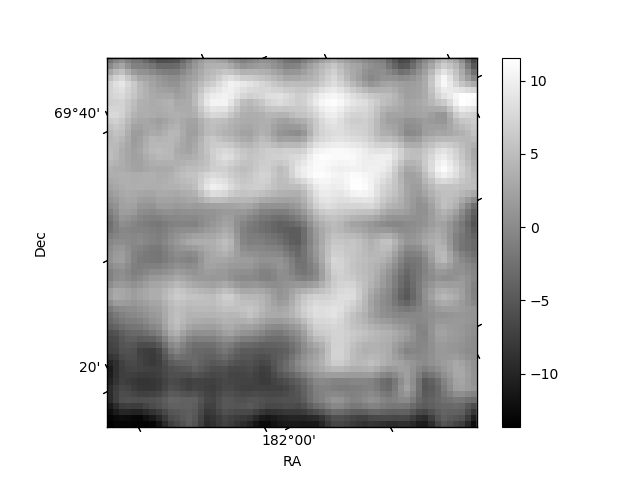
Quadrant B |
|---|---|---|---|
| Quadrant D | 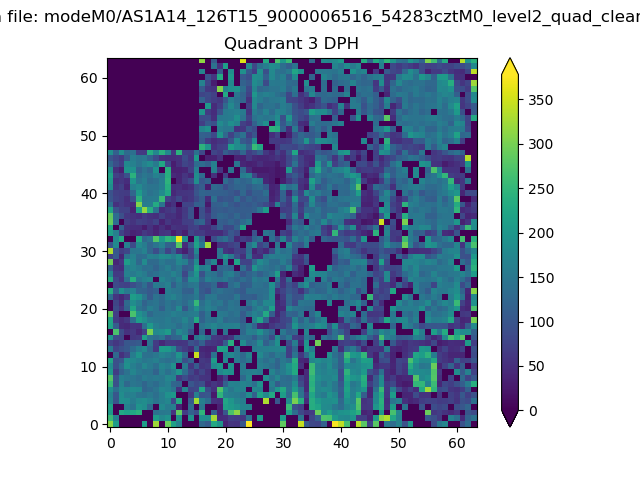 |
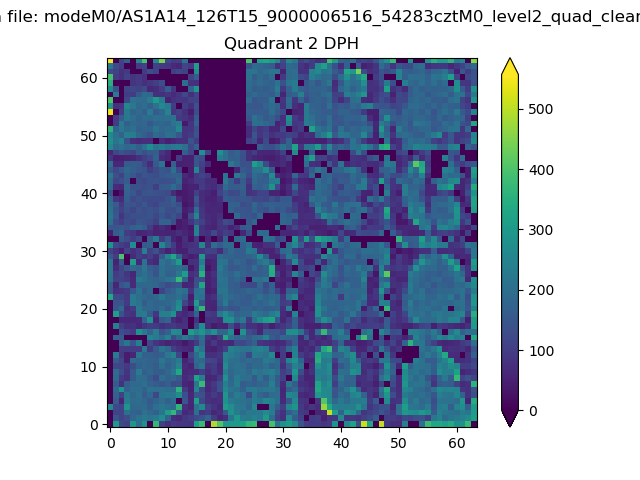 |
Quadrant C |
| Plot type | Count rate plots | Images |
|---|---|---|
| Comparison with Poisson distribution Blue bars denote a histogram of data divided into 1 sec bins. Red curve is a Poisson curve with rate = median count rate of data. |
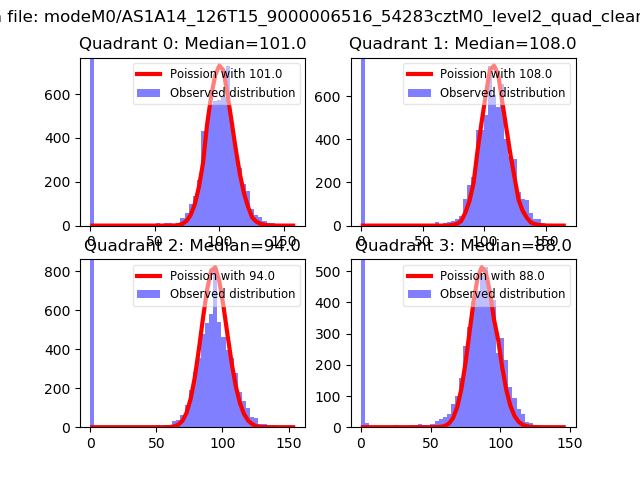 |
 |
| Quadrant-wise count rates Data is divided into 100 sec bins |
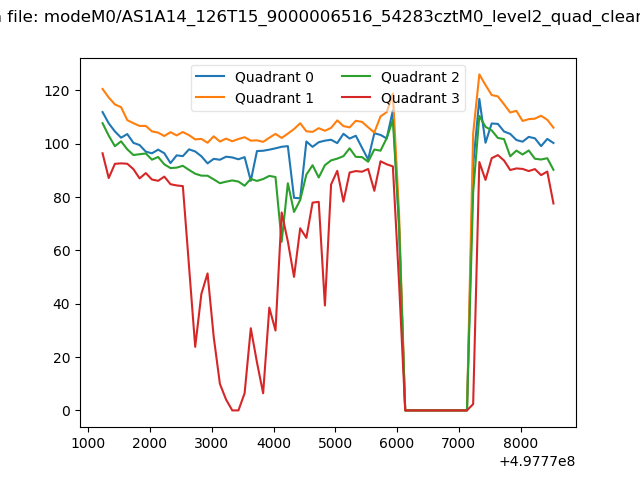 |
|
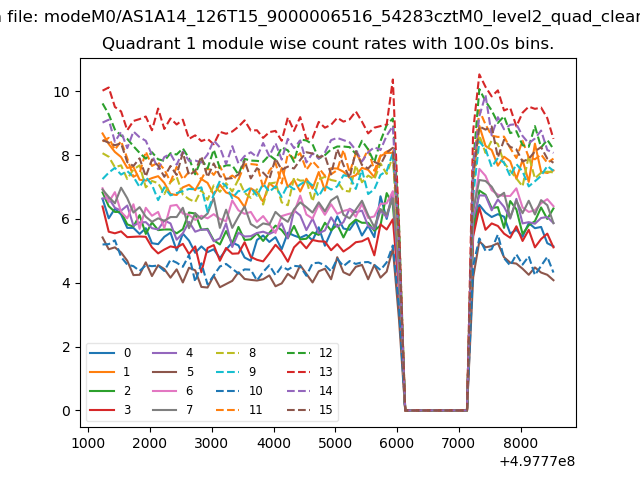
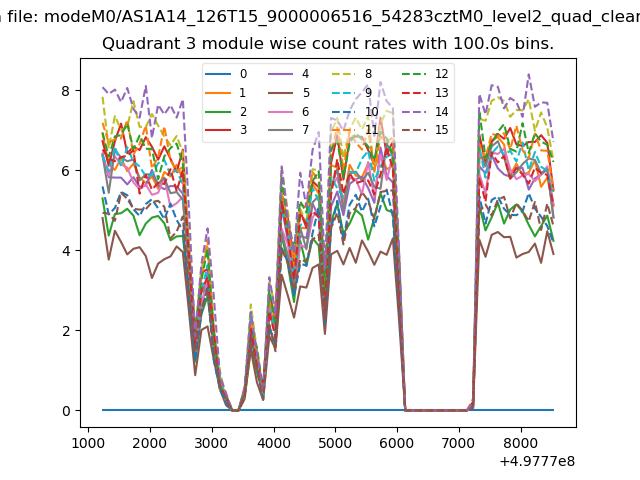
| Module-wise count rates for Quadrant A Data is divided into 100 sec bins |
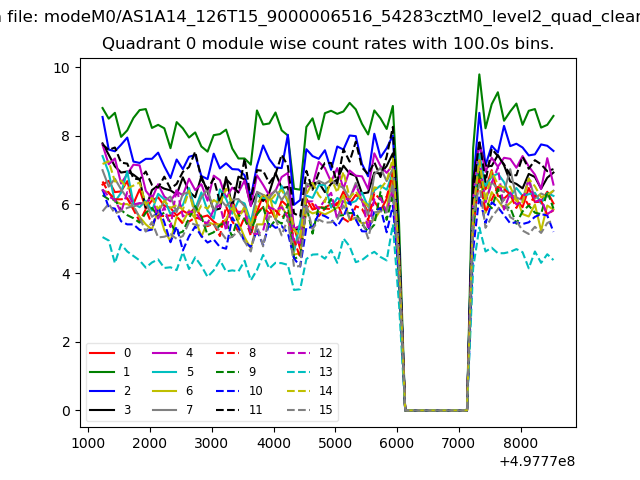 |
 |
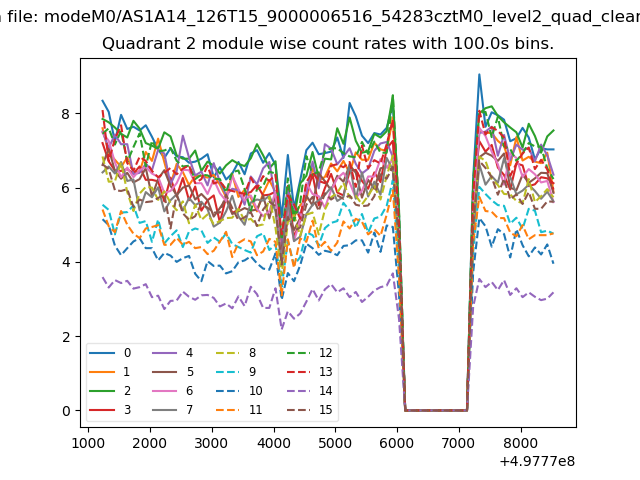
| Module-wise count rates for Quadrant B Data is divided into 100 sec bins |
 |
 |
| Module-wise count rates for Quadrant C Data is divided into 100 sec bins |
 |
 |
| Module-wise count rates for Quadrant D Data is divided into 100 sec bins |
 |
 |
| Parameter | Plot |
|---|---|
| CZT HV Monitor | 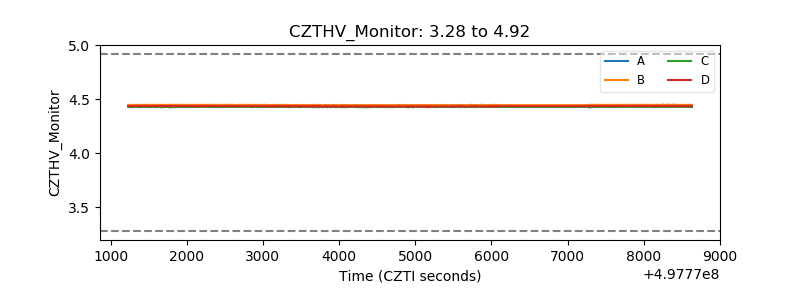 |
| D_VDD | 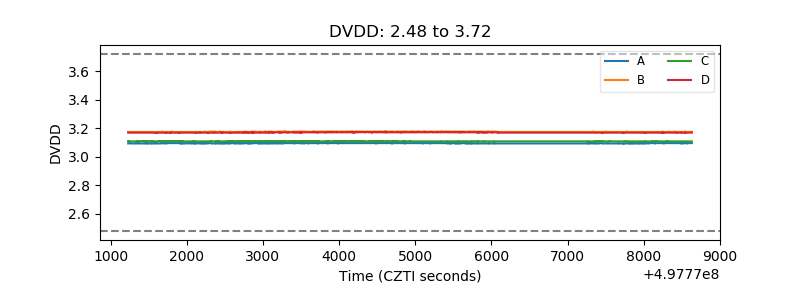 |
| Temperature 1 | 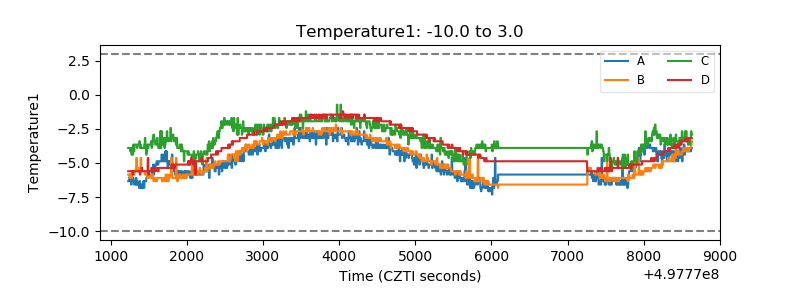 |
| Veto HV Monitor | 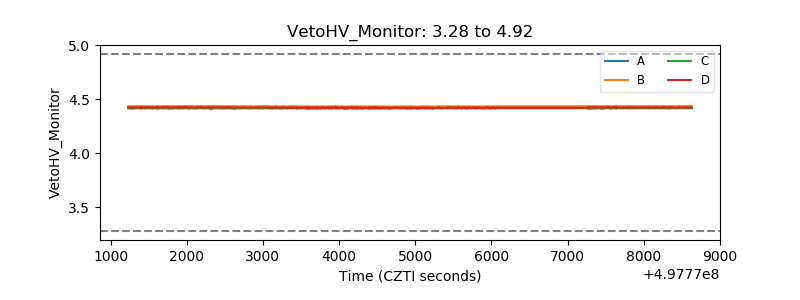 |
| Veto LLD | 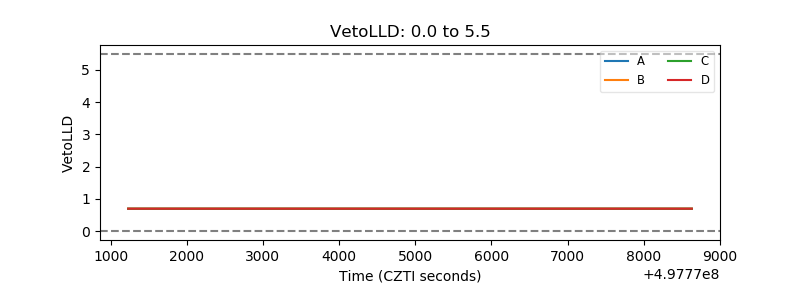 |
| Alpha Counter | 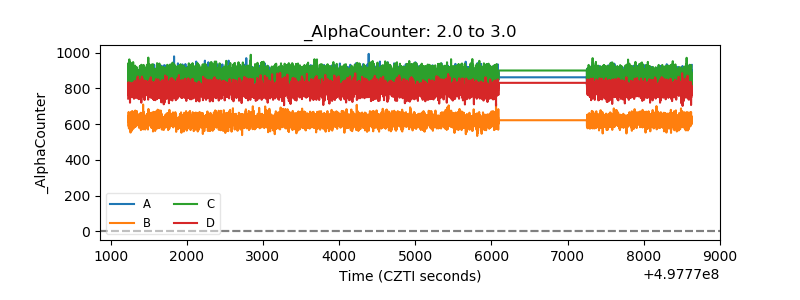 |
| _CPM_Rate | 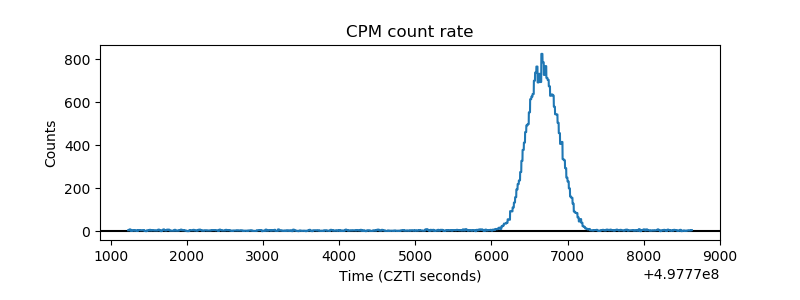 |
| CZT Counter | 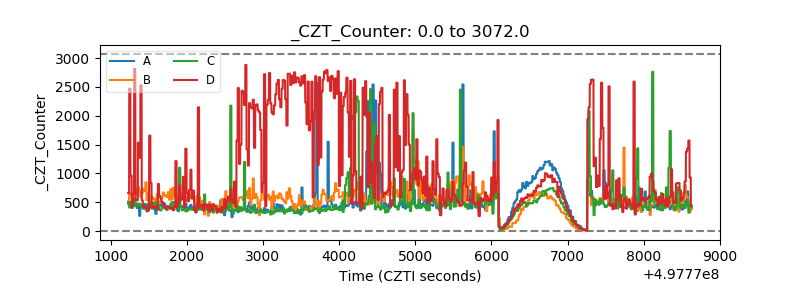 |
| +2.5 Volts monitor |  |
| +5 Volts monitor | 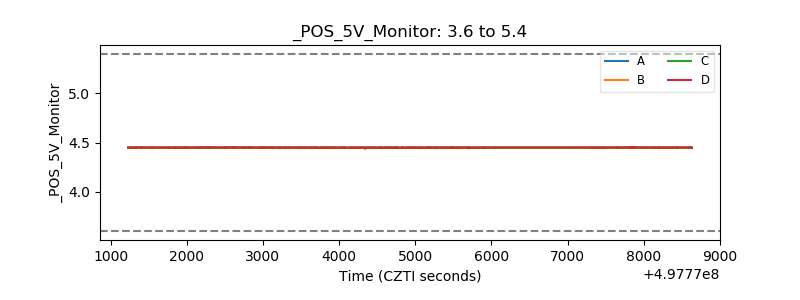 |
| _ROLL_ROT | 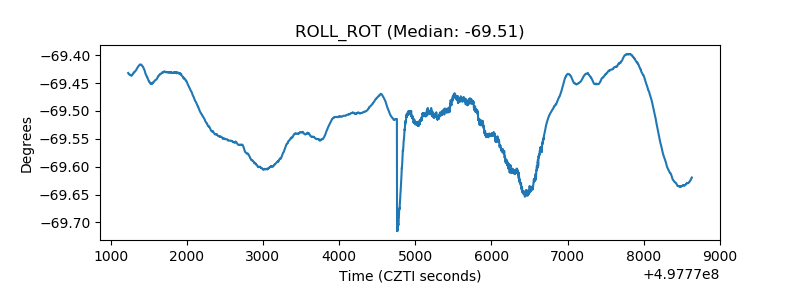 |
| _Roll_DEC | 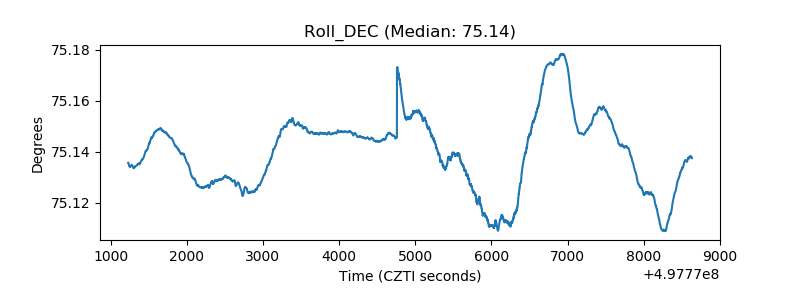 |
| _Roll_RA | 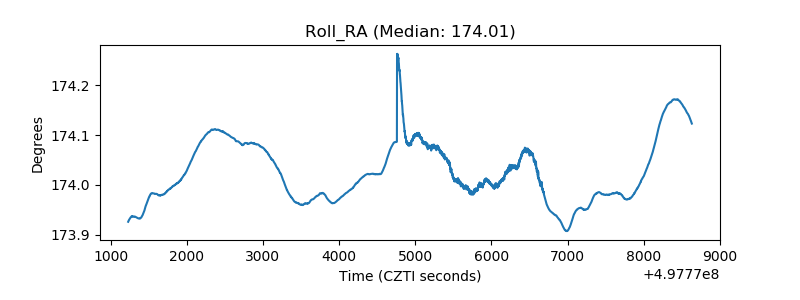 |
| Veto Counter | 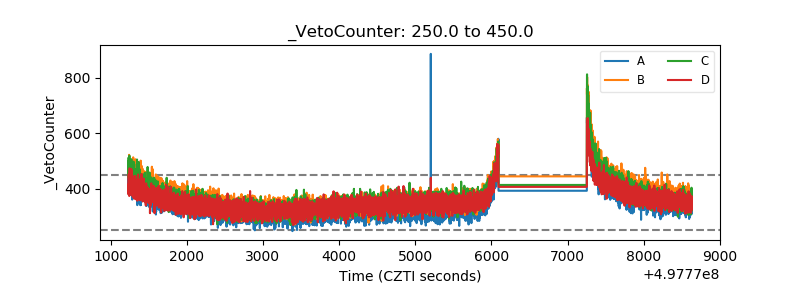 |