| Param | Original file | Final file |
|---|---|---|
| Filename | modeM0/AS1A14_126T15_9000006516_54284cztM0_level2.fits | modeM0/AS1A14_126T15_9000006516_54284cztM0_level2_quad_clean.evt |
| Size (bytes) | 444,191,040 | 97,534,080 |
| Size | 423.6 MB | 93.0 MB |
| Events in quadrant A | 3,186,179 | 657,456 |
| Events in quadrant B | 3,924,454 | 699,875 |
| Events in quadrant C | 4,160,461 | 581,243 |
| Events in quadrant D | 4,667,683 | 562,693 |
| Mode SS | |||
|---|---|---|---|
| Quadrant | BADHDUFLAG | Total packets | Discarded packets |
| A | 0 | 132 | 0 |
| B | 0 | 132 | 0 |
| C | 0 | 132 | 0 |
| D | 0 | 132 | 0 |
| Mode M0 | |||
|---|---|---|---|
| Quadrant | BADHDUFLAG | Total packets | Discarded packets |
| A | 0 | 13998 | 2 |
| B | 0 | 16035 | 2 |
| C | 0 | 17227 | 2 |
| D | 0 | 18280 | 2 |
| Mode M9 | |||
|---|---|---|---|
| Quadrant | BADHDUFLAG | Total packets | Discarded packets |
| A | 0 | 13 | 0 |
| B | 0 | 13 | 0 |
| C | 0 | 14 | 0 |
| D | 0 | 14 | 0 |
| Quadrant | Total seconds | Saturated seconds | Saturation percentage |
|---|---|---|---|
| A | 6480 | 79 | 1.219136% |
| B | 6480 | 117 | 1.805556% |
| C | 6480 | 403 | 6.219136% |
| D | 6480 | 300 | 4.629630% |
Noise dominated data is calculated using 1-second bins in cleaned event files. If a bin has >2000 counts, and if more than 50% of those come from <1% of pixels, then it is considered to be noise-dominated and hence unusable.
| Quadrant | # 1 sec bins | Bins with >0 counts | Bins with >2000 counts | High rate bins dominated by noise | Noise dominated (total time) | Noise dominated (detector-on time) | Marked lightcurve |
|---|---|---|---|---|---|---|---|
| A | 7645 | 6481 | 47 | 47 | 0.61% | 0.73% | 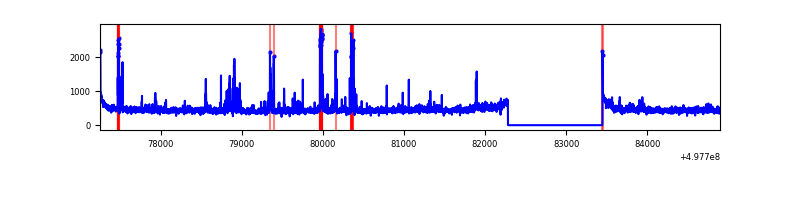 |
| B | 7645 | 6481 | 54 | 54 | 0.71% | 0.83% | 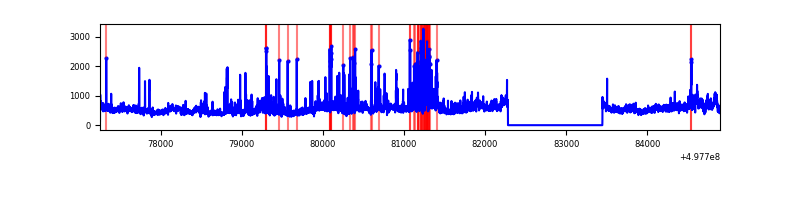 |
| C | 7645 | 6481 | 395 | 395 | 5.17% | 6.09% | 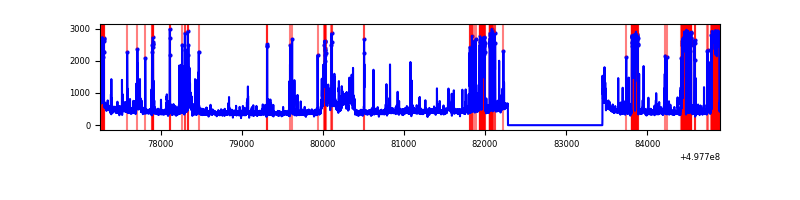 |
| D | 7645 | 6481 | 290 | 290 | 3.79% | 4.47% | 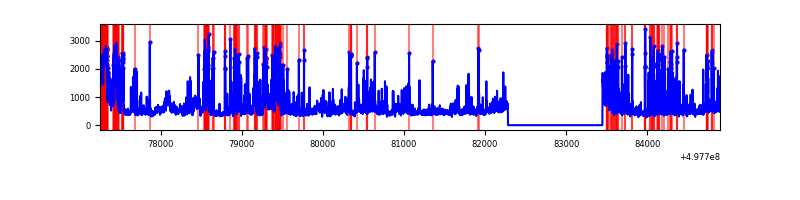 |
Top three noisy pixels from each quadrant. If the there are fewer than three noisy pixels in the level2.evt file, extra rows are filled as -1
| Pixel properties | Quadrant properties | ||||||
|---|---|---|---|---|---|---|---|
| Quadrant | DetID | PixID | Counts | Sigma | Mean | Median | Sigma |
| A | 7 | 29 | 254374 | 1452.7 | 702 | 684 | 174.6 |
| A | 11 | 3 | 69163 | 392.13 | 702 | 684 | 174.6 |
| A | 4 | 3 | 43794 | 246.86 | 702 | 684 | 174.6 |
| B | 7 | 0 | 588166 | 3990.63 | 685 | 658 | 147.2 |
| B | 0 | 213 | 311109 | 2108.73 | 685 | 658 | 147.2 |
| B | 14 | 167 | 103150 | 696.17 | 685 | 658 | 147.2 |
| C | 1 | 241 | 1046456 | 5895.12 | 646 | 639 | 177.4 |
| C | 12 | 249 | 277462 | 1560.41 | 646 | 639 | 177.4 |
| C | 14 | 254 | 113639 | 636.96 | 646 | 639 | 177.4 |
| D | 6 | 239 | 930245 | 4938.01 | 659 | 628 | 188.3 |
| D | 11 | 176 | 354813 | 1881.39 | 659 | 628 | 188.3 |
| D | 2 | 153 | 231485 | 1226.28 | 659 | 628 | 188.3 |
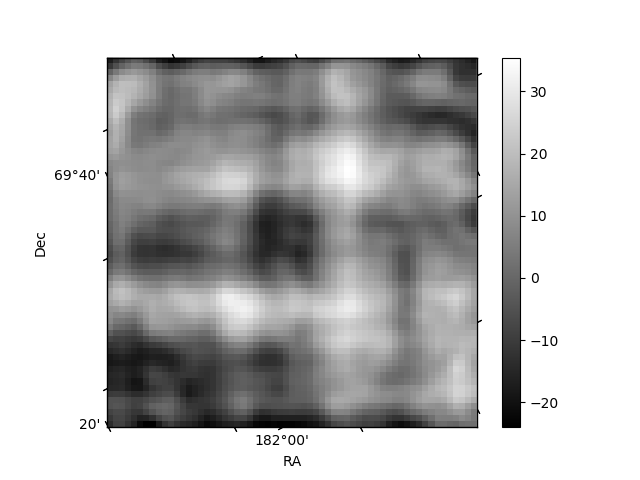
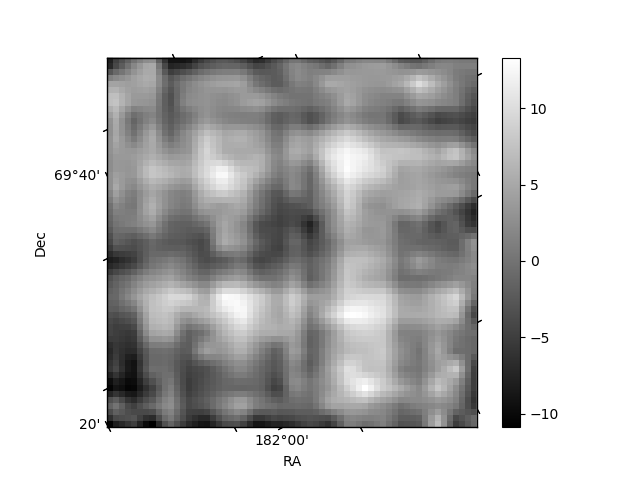
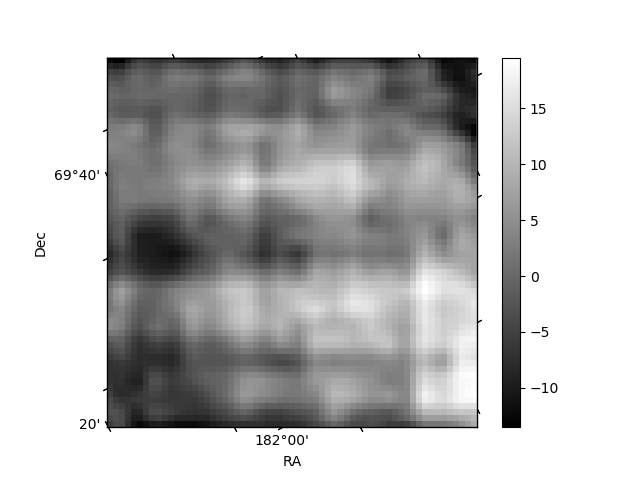
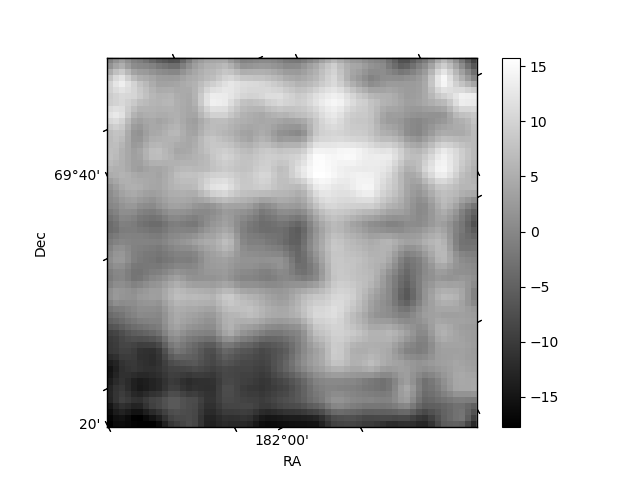
Histogram calculated using DETX and DETY for each event in the final _common_clean file
| Quadrant A | 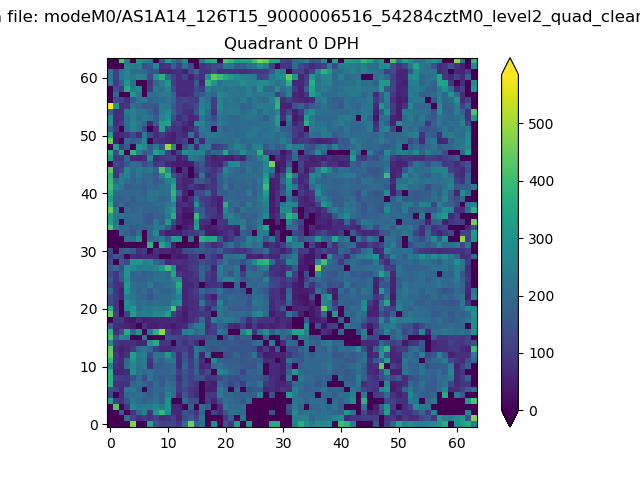 |
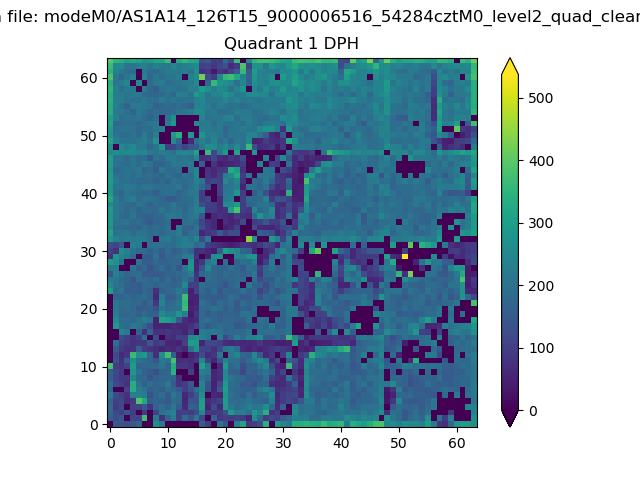 |
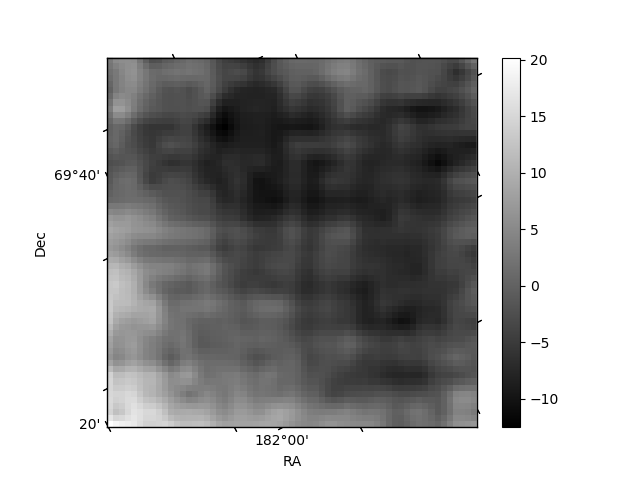
Quadrant B |
|---|---|---|---|
| Quadrant D | 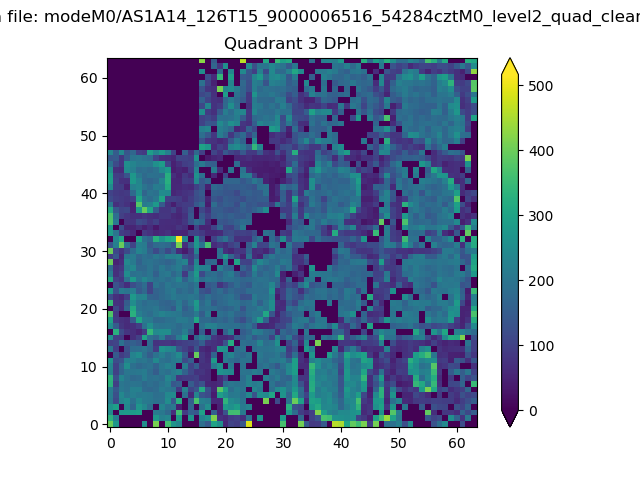 |
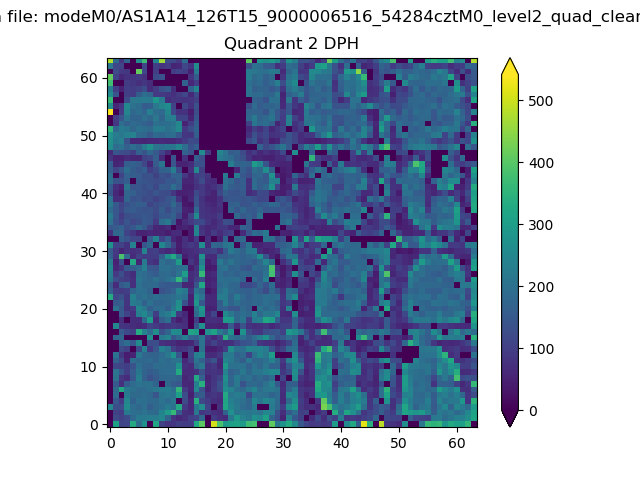 |
Quadrant C |
| Plot type | Count rate plots | Images |
|---|---|---|
| Comparison with Poisson distribution Blue bars denote a histogram of data divided into 1 sec bins. Red curve is a Poisson curve with rate = median count rate of data. |
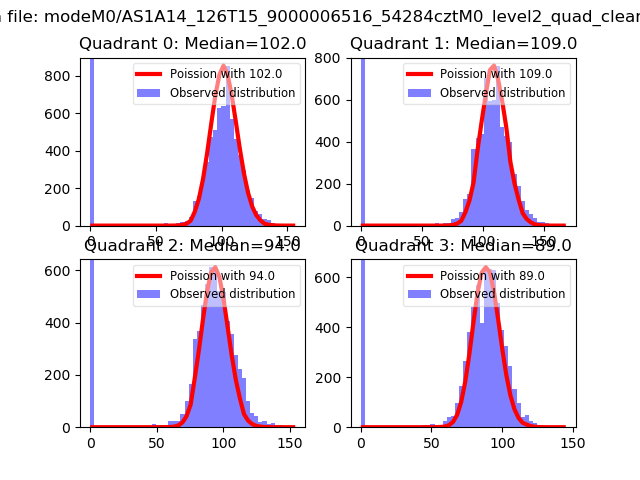 |
 |
| Quadrant-wise count rates Data is divided into 100 sec bins |
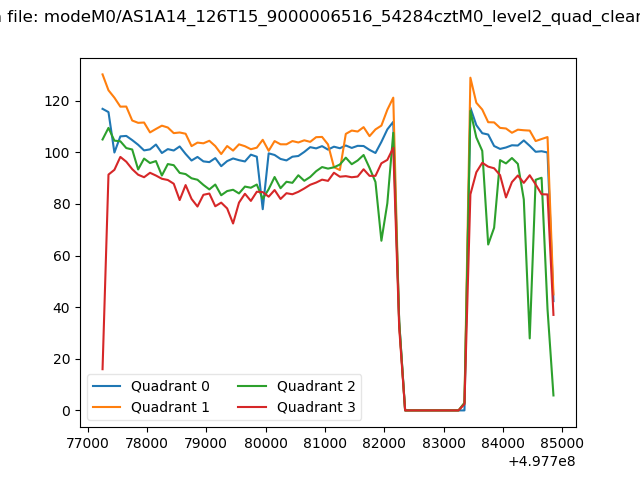 |
|
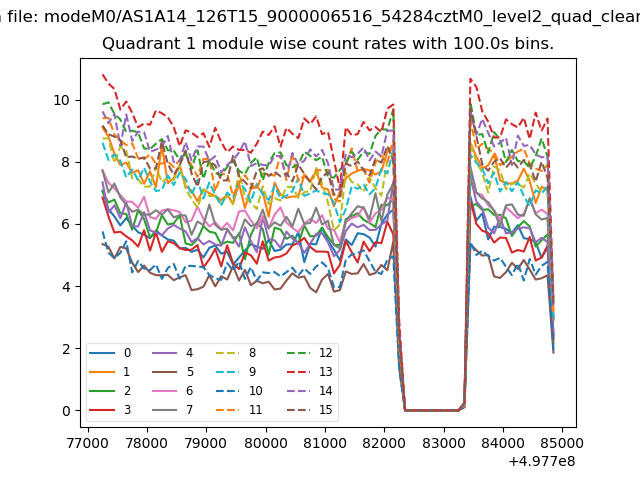
| Module-wise count rates for Quadrant A Data is divided into 100 sec bins |
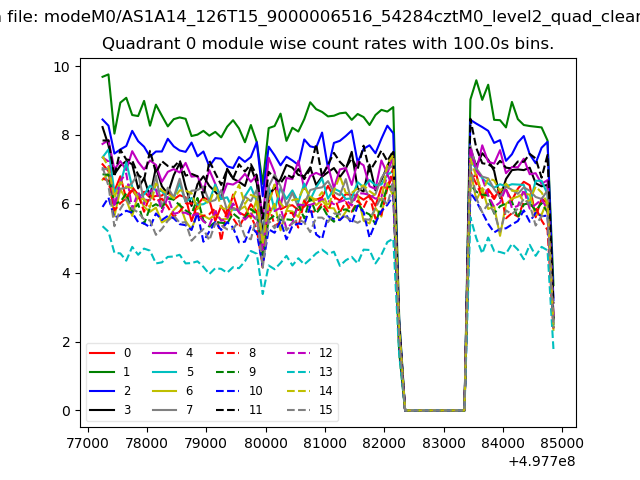 |
 |
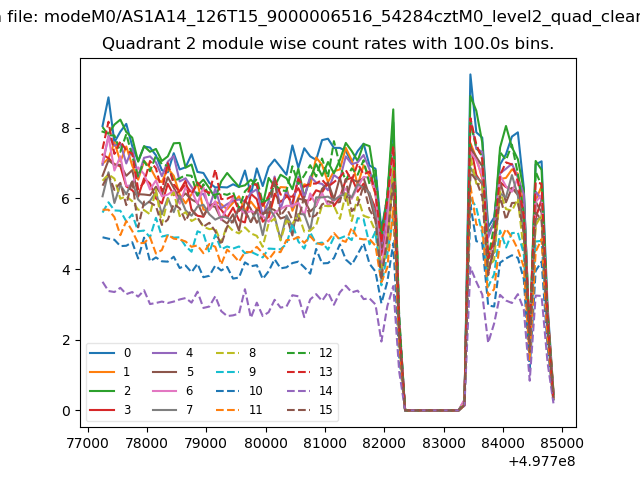
| Module-wise count rates for Quadrant B Data is divided into 100 sec bins |
 |
 |
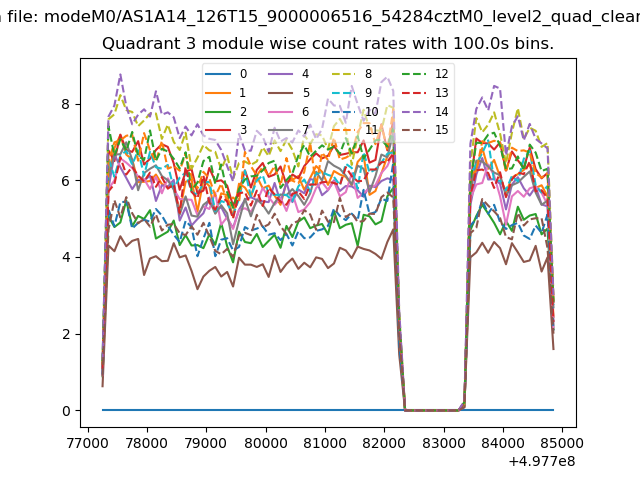
| Module-wise count rates for Quadrant C Data is divided into 100 sec bins |
 |
 |
| Module-wise count rates for Quadrant D Data is divided into 100 sec bins |
 |
 |
| Parameter | Plot |
|---|---|
| CZT HV Monitor |  |
| D_VDD | 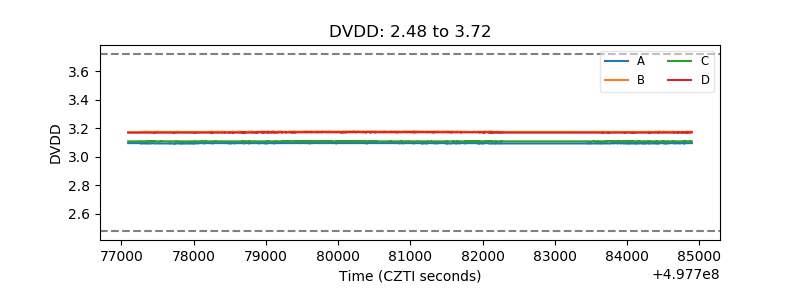 |
| Temperature 1 | 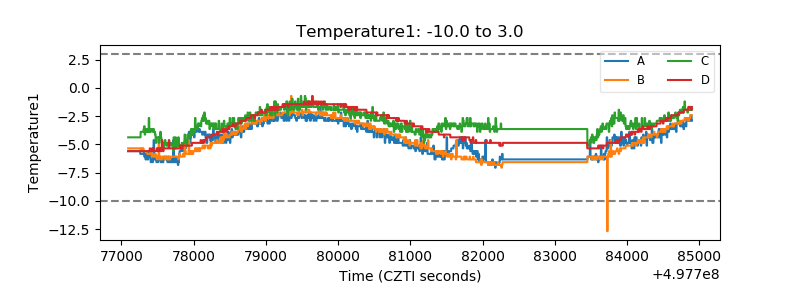 |
| Veto HV Monitor | 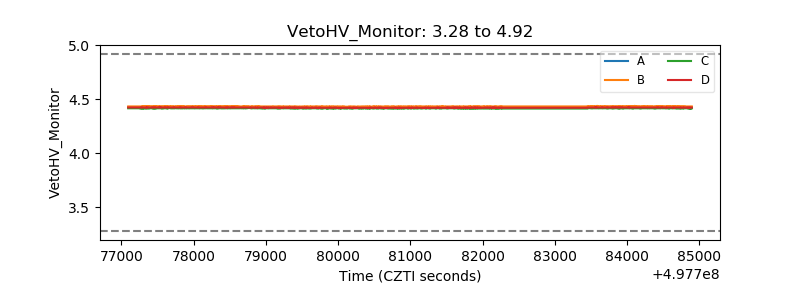 |
| Veto LLD | 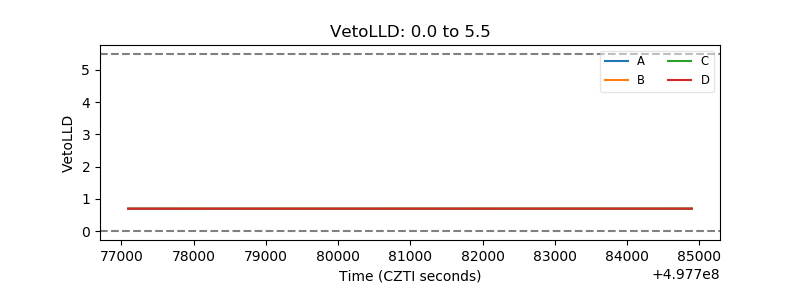 |
| Alpha Counter | 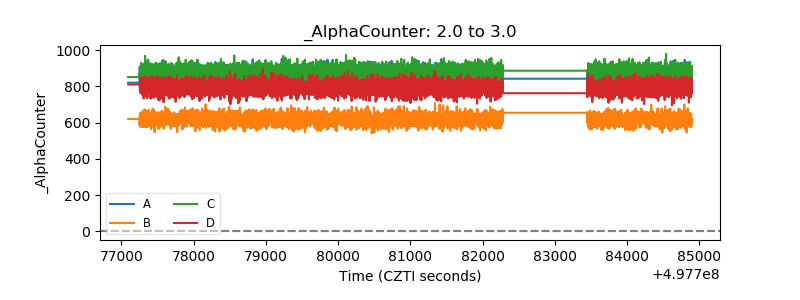 |
| _CPM_Rate | 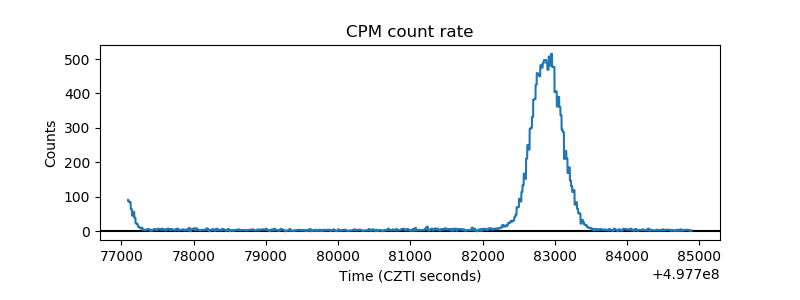 |
| CZT Counter | 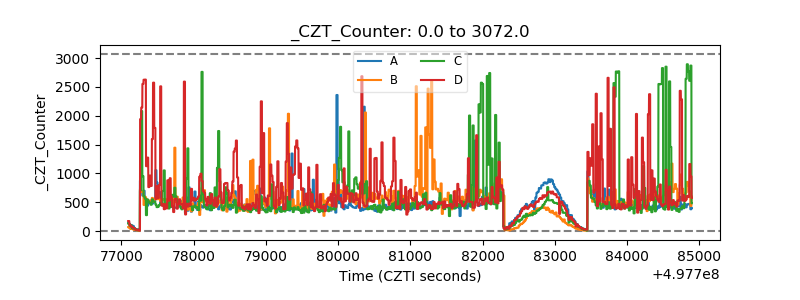 |
| +2.5 Volts monitor |  |
| +5 Volts monitor |  |
| _ROLL_ROT | 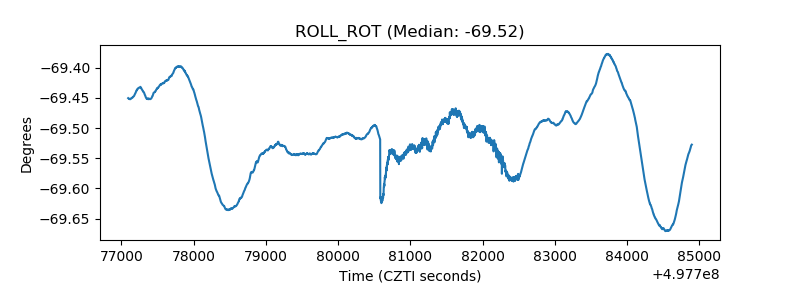 |
| _Roll_DEC | 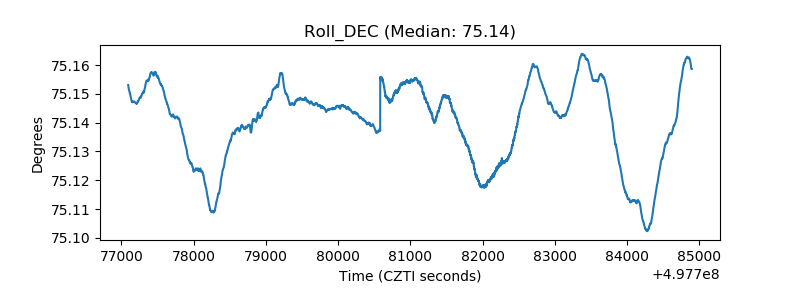 |
| _Roll_RA | 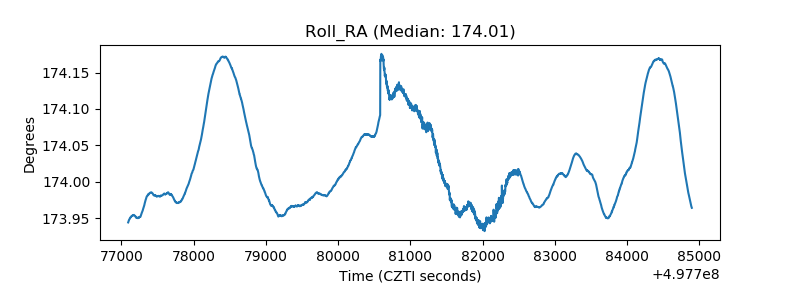 |
| Veto Counter | 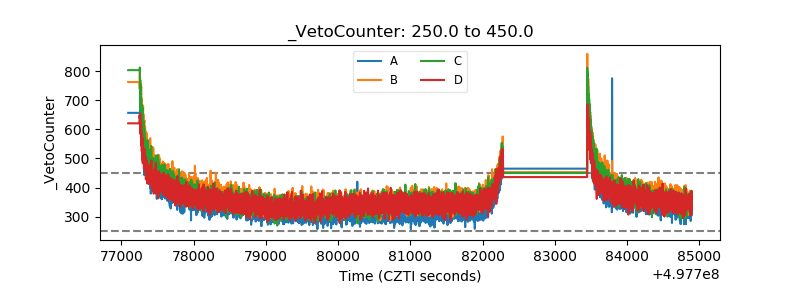 |