| Param | Original file | Final file |
|---|---|---|
| Filename | modeM0/AS1A14_126T15_9000006516_54285cztM0_level2.fits | modeM0/AS1A14_126T15_9000006516_54285cztM0_level2_quad_clean.evt |
| Size (bytes) | 506,505,600 | 96,275,520 |
| Size | 483.0 MB | 91.8 MB |
| Events in quadrant A | 3,031,040 | 663,266 |
| Events in quadrant B | 4,210,103 | 698,936 |
| Events in quadrant C | 5,729,199 | 525,789 |
| Events in quadrant D | 5,259,797 | 561,415 |
| Mode SS | |||
|---|---|---|---|
| Quadrant | BADHDUFLAG | Total packets | Discarded packets |
| A | 0 | 136 | 0 |
| B | 0 | 136 | 0 |
| C | 0 | 136 | 0 |
| D | 0 | 136 | 0 |
| Mode M0 | |||
|---|---|---|---|
| Quadrant | BADHDUFLAG | Total packets | Discarded packets |
| A | 0 | 13826 | 2 |
| B | 0 | 17131 | 2 |
| C | 0 | 22033 | 2 |
| D | 0 | 20279 | 2 |
| Mode M9 | |||
|---|---|---|---|
| Quadrant | BADHDUFLAG | Total packets | Discarded packets |
| A | 0 | 10 | 0 |
| B | 0 | 10 | 0 |
| C | 0 | 10 | 0 |
| D | 0 | 10 | 0 |
| Quadrant | Total seconds | Saturated seconds | Saturation percentage |
|---|---|---|---|
| A | 6680 | 95 | 1.422156% |
| B | 6681 | 157 | 2.349948% |
| C | 6681 | 1110 | 16.614279% |
| D | 6681 | 409 | 6.121838% |
Noise dominated data is calculated using 1-second bins in cleaned event files. If a bin has >2000 counts, and if more than 50% of those come from <1% of pixels, then it is considered to be noise-dominated and hence unusable.
| Quadrant | # 1 sec bins | Bins with >0 counts | Bins with >2000 counts | High rate bins dominated by noise | Noise dominated (total time) | Noise dominated (detector-on time) | Marked lightcurve |
|---|---|---|---|---|---|---|---|
| A | 7720 | 6680 | 5 | 5 | 0.06% | 0.07% | 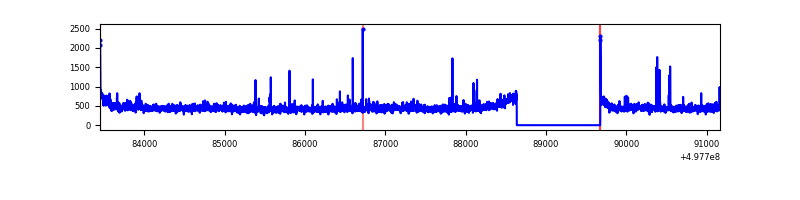 |
| B | 7721 | 6681 | 54 | 54 | 0.70% | 0.81% | 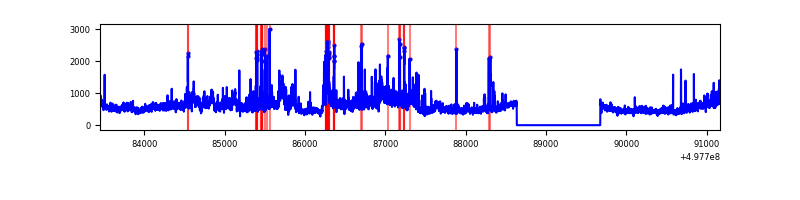 |
| C | 7720 | 6680 | 1079 | 1079 | 13.98% | 16.15% | 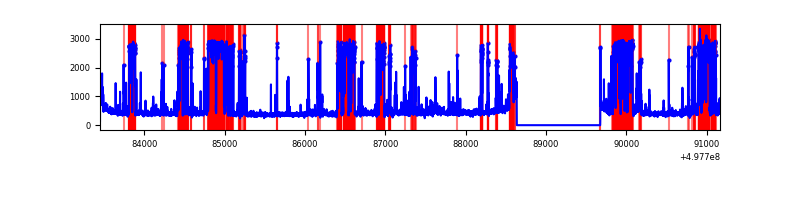 |
| D | 7721 | 6681 | 286 | 286 | 3.70% | 4.28% | 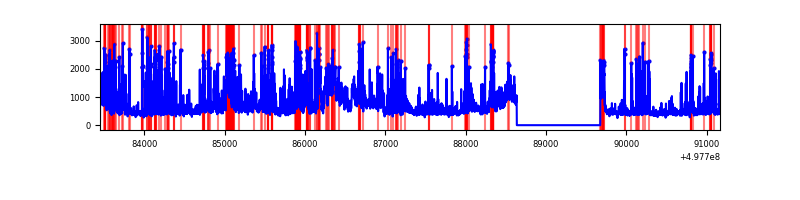 |
Top three noisy pixels from each quadrant. If the there are fewer than three noisy pixels in the level2.evt file, extra rows are filled as -1
| Pixel properties | Quadrant properties | ||||||
|---|---|---|---|---|---|---|---|
| Quadrant | DetID | PixID | Counts | Sigma | Mean | Median | Sigma |
| A | 11 | 3 | 74214 | 410.13 | 723 | 704 | 179.2 |
| A | 4 | 3 | 36266 | 198.41 | 723 | 704 | 179.2 |
| A | 4 | 78 | 28606 | 155.67 | 723 | 704 | 179.2 |
| B | 7 | 0 | 967337 | 6425.6 | 703 | 677 | 150.4 |
| B | 0 | 213 | 178046 | 1179.01 | 703 | 677 | 150.4 |
| B | 5 | 185 | 52195 | 342.45 | 703 | 677 | 150.4 |
| C | 1 | 241 | 3045372 | 17760.96 | 628 | 619 | 171.4 |
| C | 12 | 252 | 73967 | 427.86 | 628 | 619 | 171.4 |
| C | 14 | 254 | 71070 | 410.96 | 628 | 619 | 171.4 |
| D | 6 | 239 | 896928 | 4709.81 | 678 | 645 | 190.3 |
| D | 11 | 176 | 469643 | 2464.5 | 678 | 645 | 190.3 |
| D | 2 | 153 | 327636 | 1718.28 | 678 | 645 | 190.3 |
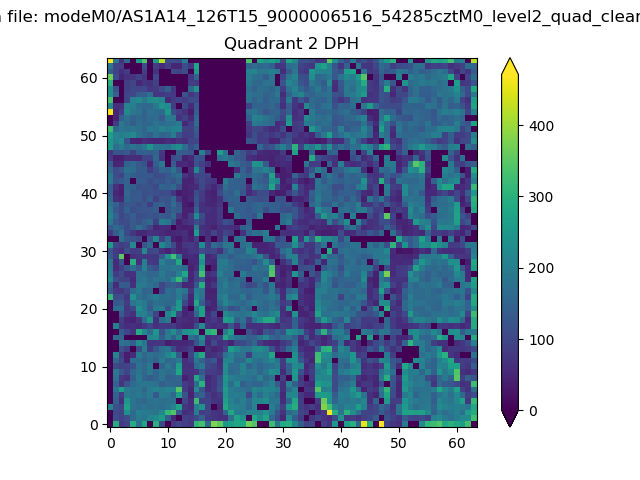
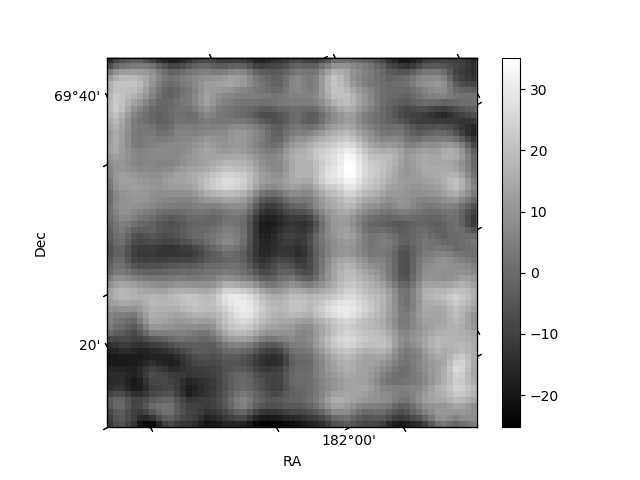
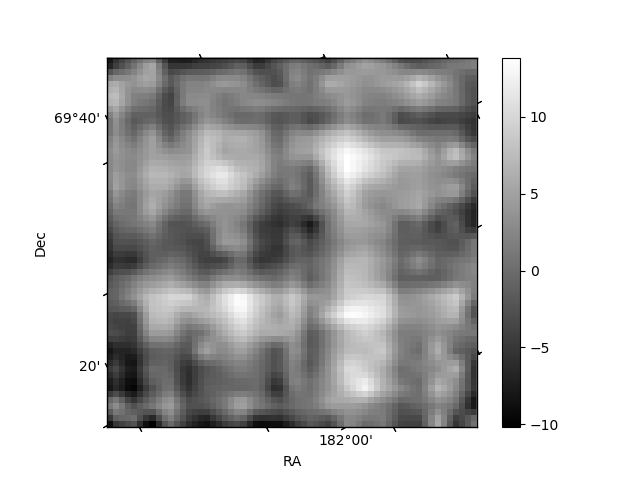
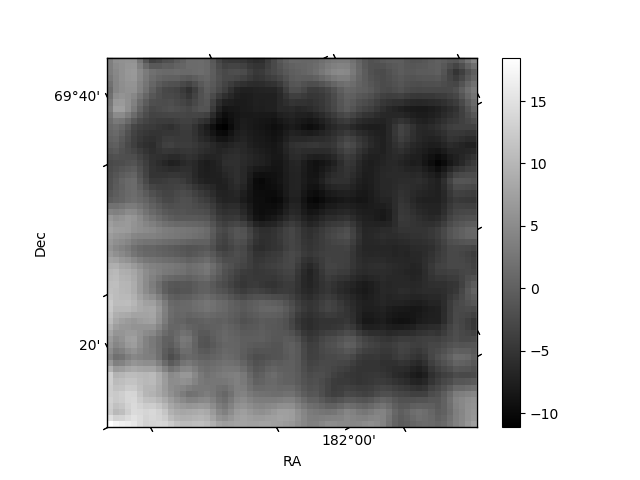
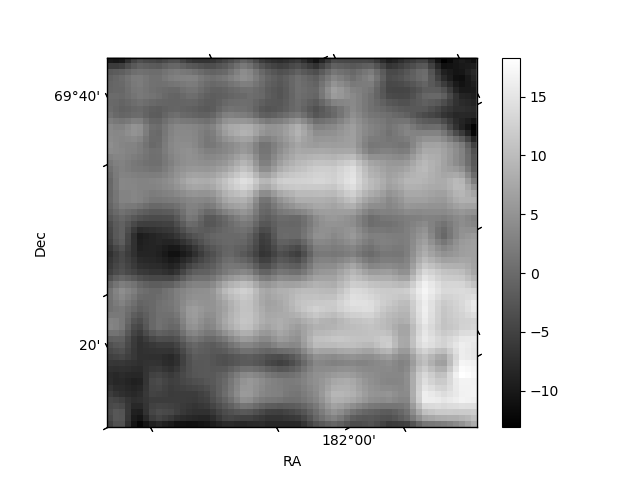
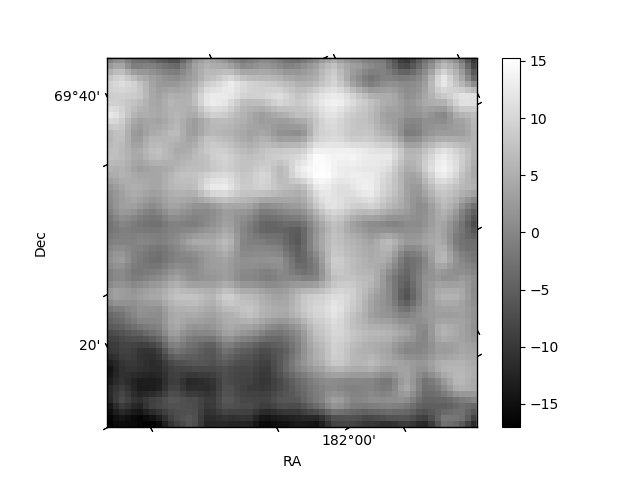
Histogram calculated using DETX and DETY for each event in the final _common_clean file
| Quadrant A | 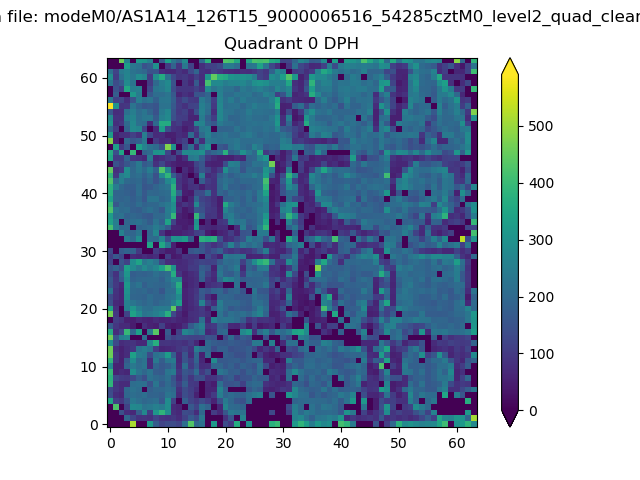 |
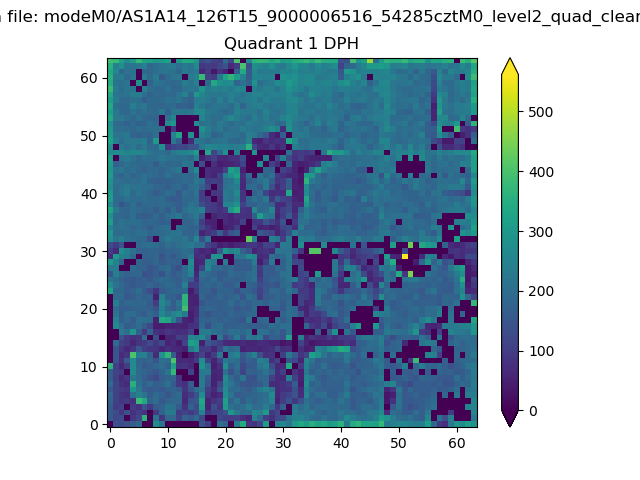 |
Quadrant B |
|---|---|---|---|
| Quadrant D | 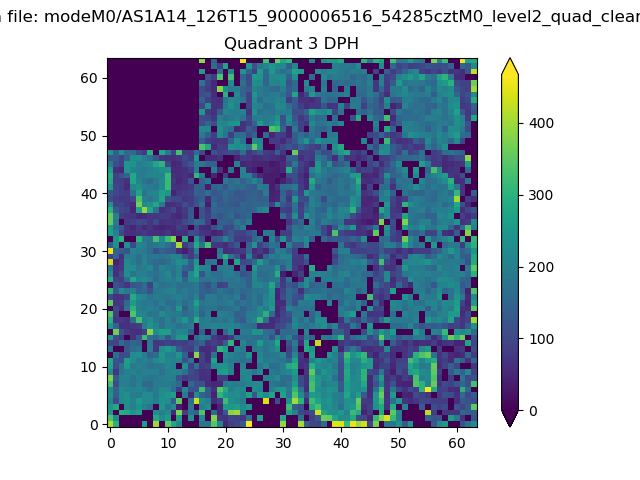 |
 |
Quadrant C |
| Plot type | Count rate plots | Images |
|---|---|---|
| Comparison with Poisson distribution Blue bars denote a histogram of data divided into 1 sec bins. Red curve is a Poisson curve with rate = median count rate of data. |
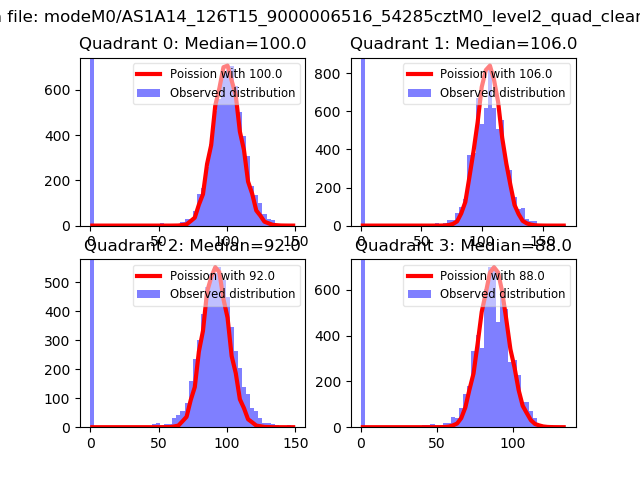 |
 |
| Quadrant-wise count rates Data is divided into 100 sec bins |
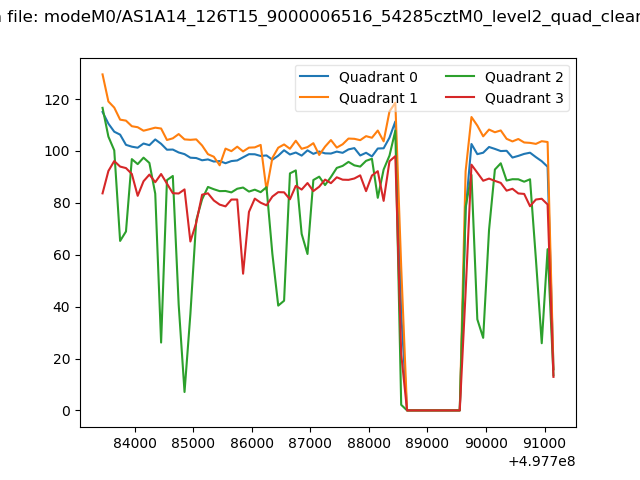 |
|
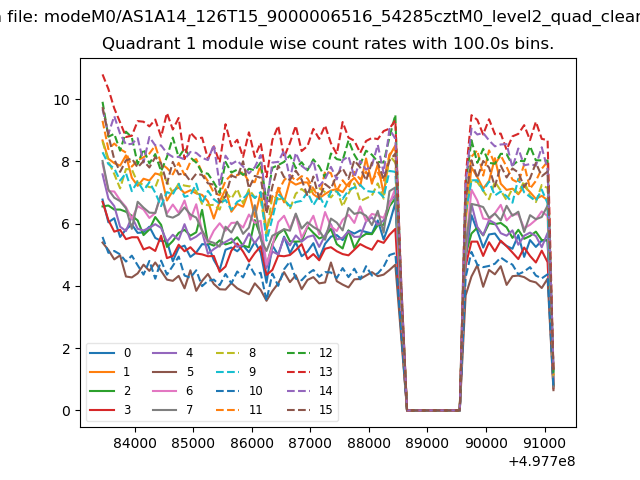
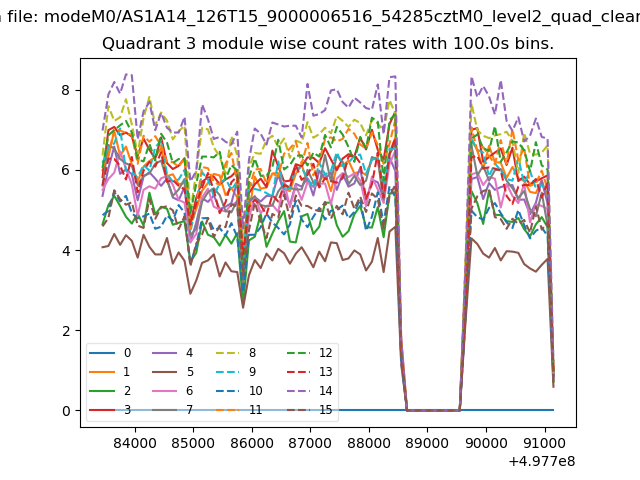
| Module-wise count rates for Quadrant A Data is divided into 100 sec bins |
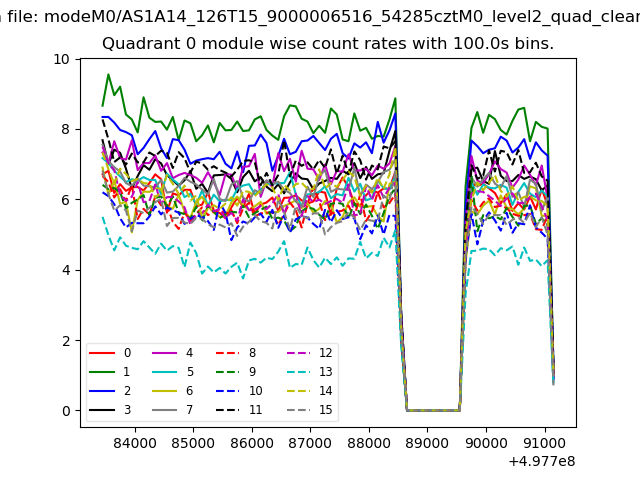 |
 |
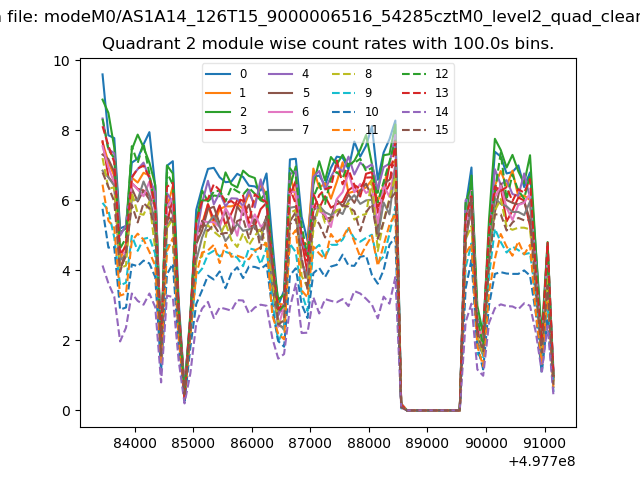
| Module-wise count rates for Quadrant B Data is divided into 100 sec bins |
 |
 |
| Module-wise count rates for Quadrant C Data is divided into 100 sec bins |
 |
 |
| Module-wise count rates for Quadrant D Data is divided into 100 sec bins |
 |
 |
| Parameter | Plot |
|---|---|
| CZT HV Monitor | 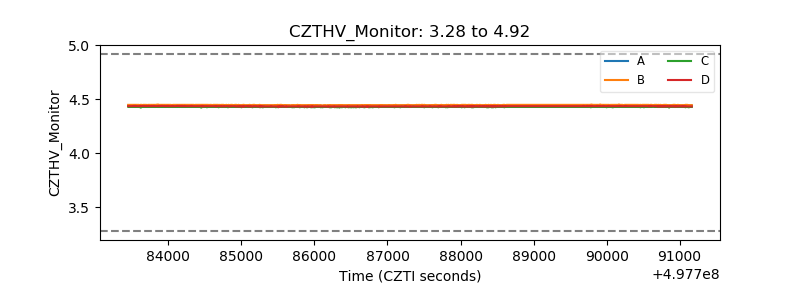 |
| D_VDD | 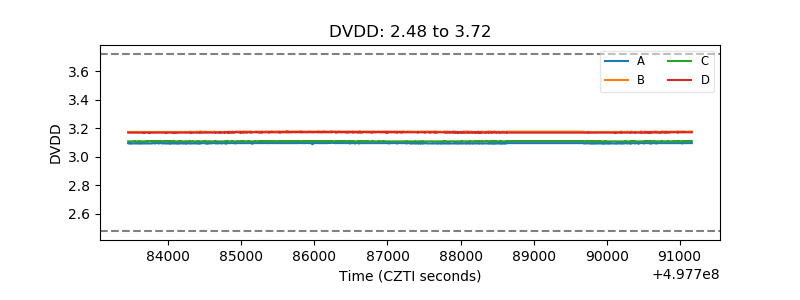 |
| Temperature 1 | 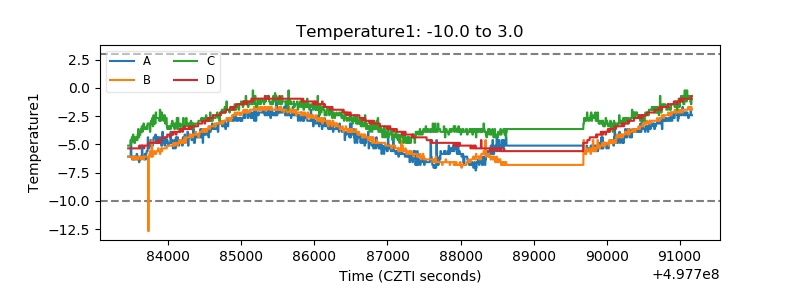 |
| Veto HV Monitor | 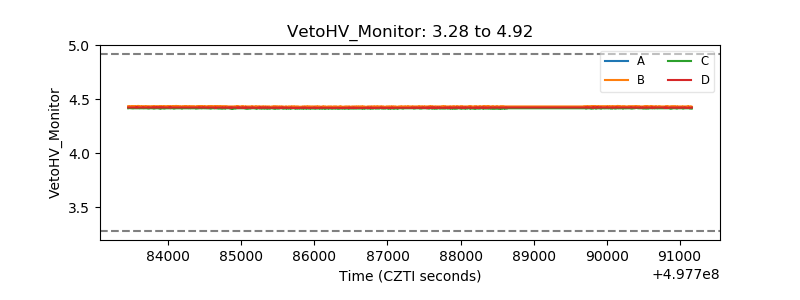 |
| Veto LLD | 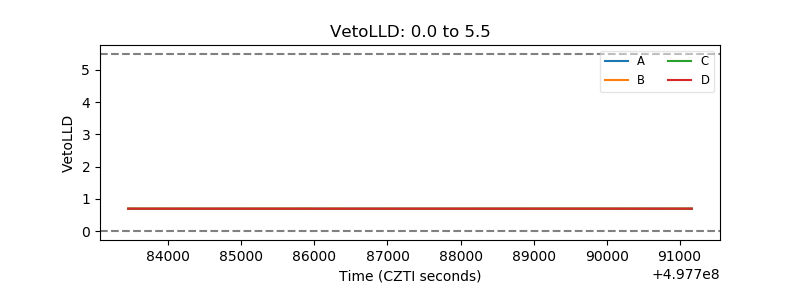 |
| Alpha Counter | 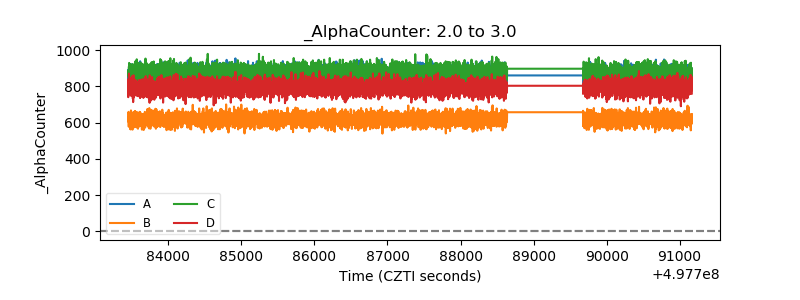 |
| _CPM_Rate | 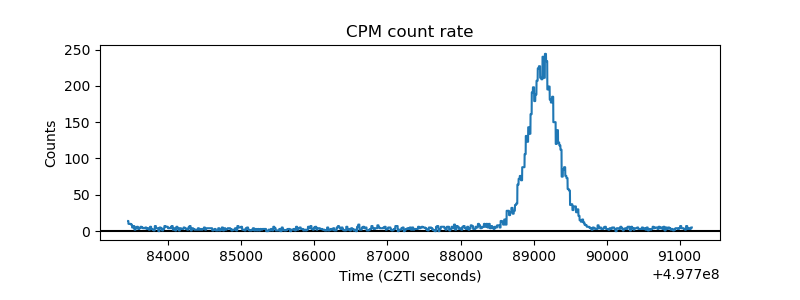 |
| CZT Counter | 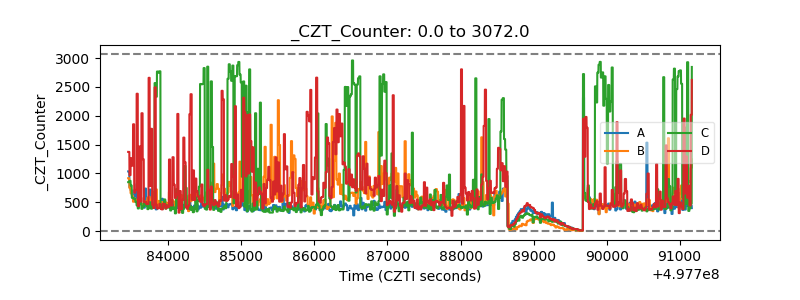 |
| +2.5 Volts monitor | 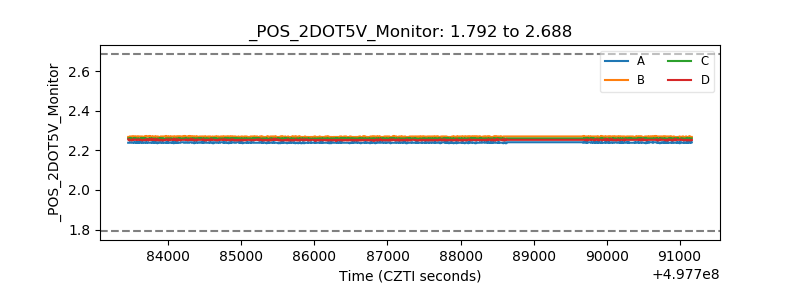 |
| +5 Volts monitor |  |
| _ROLL_ROT | 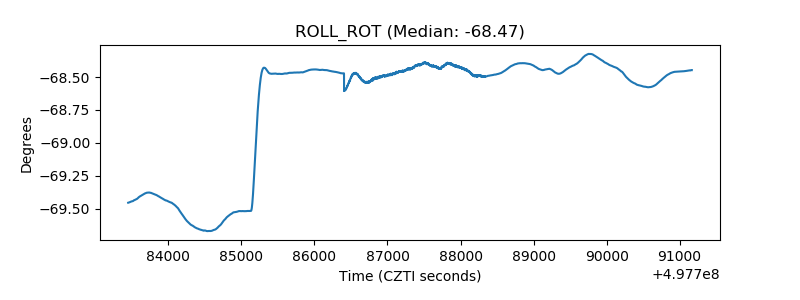 |
| _Roll_DEC | 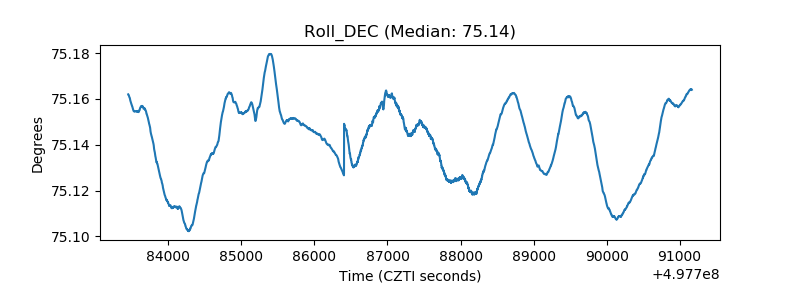 |
| _Roll_RA | 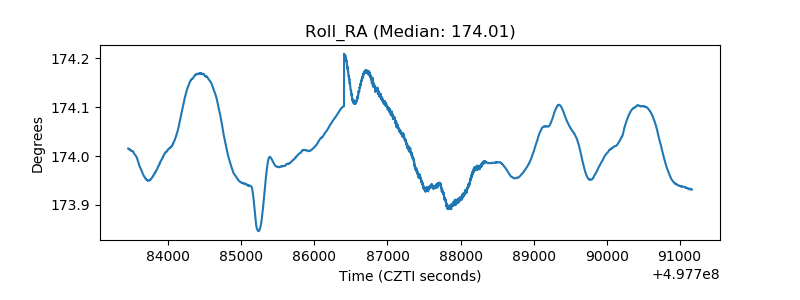 |
| Veto Counter | 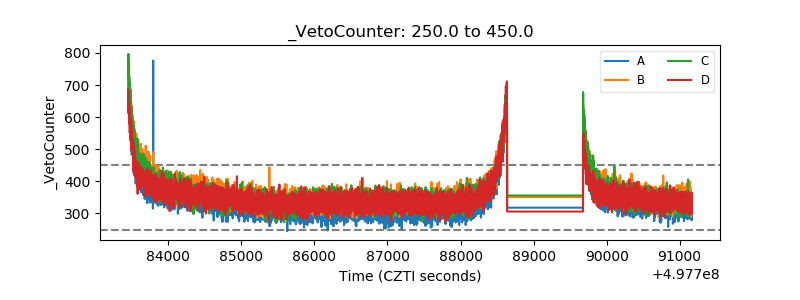 |