| Param | Original file | Final file |
|---|---|---|
| Filename | modeM0/AS1A14_126T15_9000006516_54286cztM0_level2.fits | modeM0/AS1A14_126T15_9000006516_54286cztM0_level2_quad_clean.evt |
| Size (bytes) | 433,679,040 | 82,010,880 |
| Size | 413.6 MB | 78.2 MB |
| Events in quadrant A | 2,813,312 | 566,337 |
| Events in quadrant B | 3,628,144 | 584,166 |
| Events in quadrant C | 4,198,981 | 473,389 |
| Events in quadrant D | 4,957,737 | 450,245 |
| Mode SS | |||
|---|---|---|---|
| Quadrant | BADHDUFLAG | Total packets | Discarded packets |
| A | 0 | 124 | 0 |
| B | 0 | 125 | 1 |
| C | 0 | 123 | 4 |
| D | 0 | 124 | 4 |
| Mode M0 | |||
|---|---|---|---|
| Quadrant | BADHDUFLAG | Total packets | Discarded packets |
| A | 0 | 13057 | 410 |
| B | 0 | 15755 | 905 |
| C | 0 | 18268 | 1302 |
| D | 0 | 19994 | 1215 |
| Mode M9 | |||
|---|---|---|---|
| Quadrant | BADHDUFLAG | Total packets | Discarded packets |
| A | 0 | 8 | 0 |
| B | 0 | 8 | 0 |
| C | 0 | 8 | 0 |
| D | 0 | 8 | 0 |
| Quadrant | Total seconds | Saturated seconds | Saturation percentage |
|---|---|---|---|
| A | 5945 | 114 | 1.917578% |
| B | 5800 | 131 | 2.258621% |
| C | 5812 | 651 | 11.200964% |
| D | 5811 | 560 | 9.636896% |
Noise dominated data is calculated using 1-second bins in cleaned event files. If a bin has >2000 counts, and if more than 50% of those come from <1% of pixels, then it is considered to be noise-dominated and hence unusable.
| Quadrant | # 1 sec bins | Bins with >0 counts | Bins with >2000 counts | High rate bins dominated by noise | Noise dominated (total time) | Noise dominated (detector-on time) | Marked lightcurve |
|---|---|---|---|---|---|---|---|
| A | 6983 | 6135 | 12 | 12 | 0.17% | 0.20% | 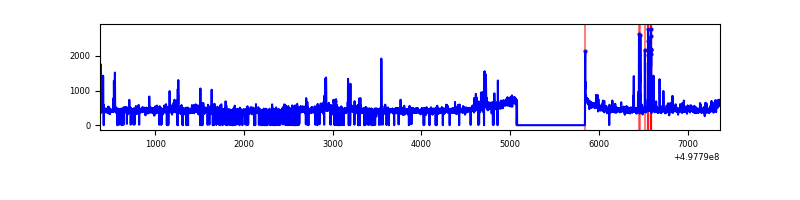 |
| B | 6984 | 6079 | 12 | 12 | 0.17% | 0.20% | 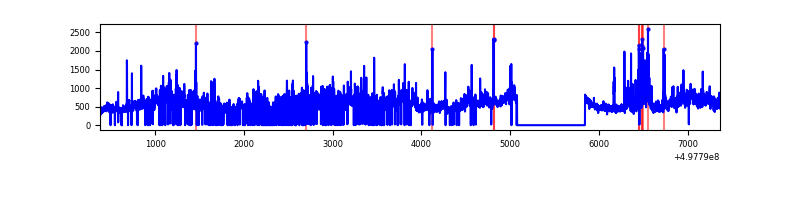 |
| C | 6984 | 6024 | 620 | 620 | 8.88% | 10.29% | 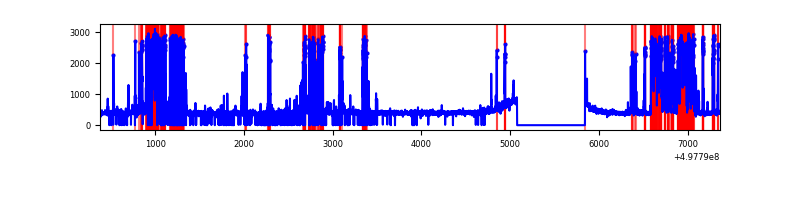 |
| D | 6984 | 6082 | 482 | 482 | 6.90% | 7.93% | 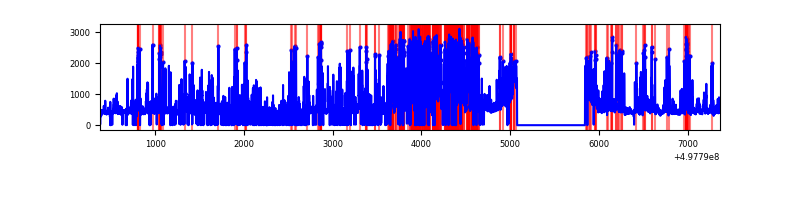 |
Top three noisy pixels from each quadrant. If the there are fewer than three noisy pixels in the level2.evt file, extra rows are filled as -1
| Pixel properties | Quadrant properties | ||||||
|---|---|---|---|---|---|---|---|
| Quadrant | DetID | PixID | Counts | Sigma | Mean | Median | Sigma |
| A | 4 | 78 | 78978 | 501.83 | 632 | 614 | 156.2 |
| A | 7 | 29 | 75298 | 478.26 | 632 | 614 | 156.2 |
| A | 11 | 3 | 73168 | 464.62 | 632 | 614 | 156.2 |
| B | 7 | 0 | 822191 | 6390.5 | 602 | 579 | 128.6 |
| B | 5 | 185 | 147349 | 1141.58 | 602 | 579 | 128.6 |
| B | 0 | 213 | 50359 | 387.19 | 602 | 579 | 128.6 |
| C | 1 | 241 | 1030221 | 6662.22 | 569 | 564 | 154.6 |
| C | 14 | 254 | 797621 | 5157.22 | 569 | 564 | 154.6 |
| C | 12 | 252 | 73098 | 469.32 | 569 | 564 | 154.6 |
| D | 3 | 12 | 1502622 | 9127.62 | 574 | 547 | 164.6 |
| D | 2 | 153 | 379742 | 2304.24 | 574 | 547 | 164.6 |
| D | 6 | 239 | 376781 | 2286.25 | 574 | 547 | 164.6 |
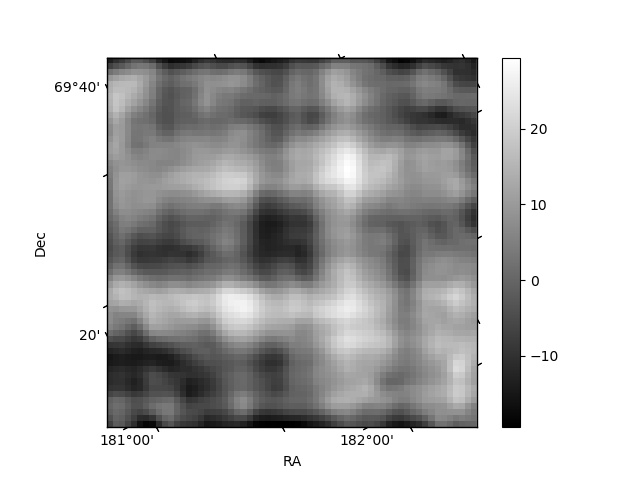
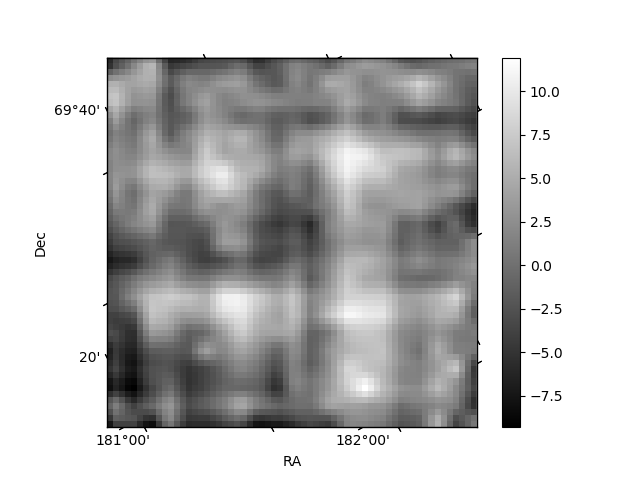
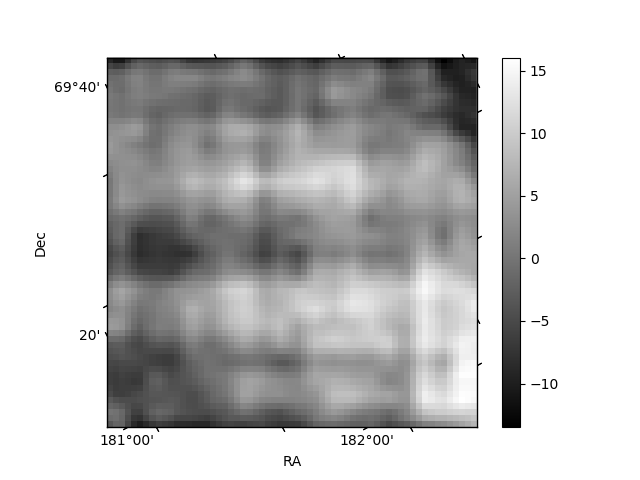
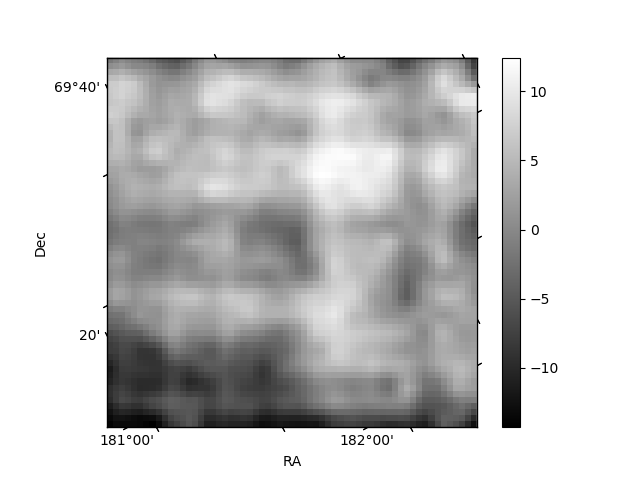
Histogram calculated using DETX and DETY for each event in the final _common_clean file
| Quadrant A | 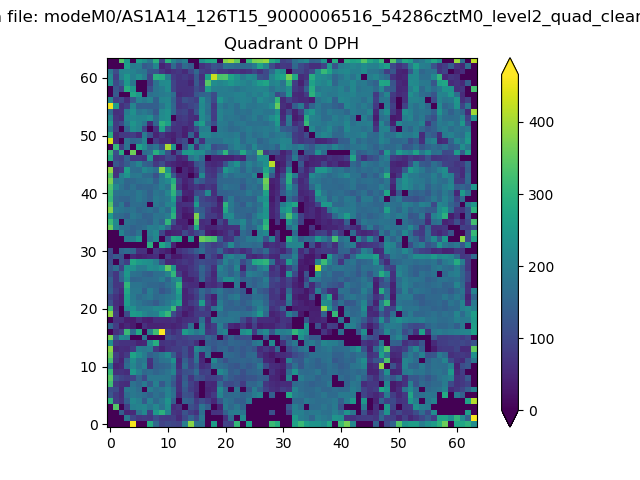 |
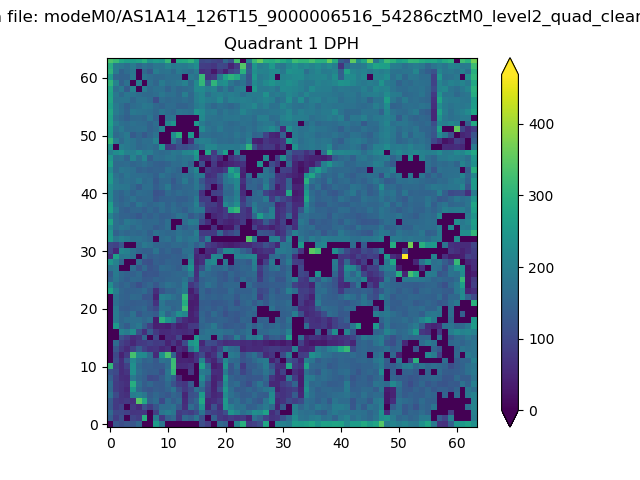 |
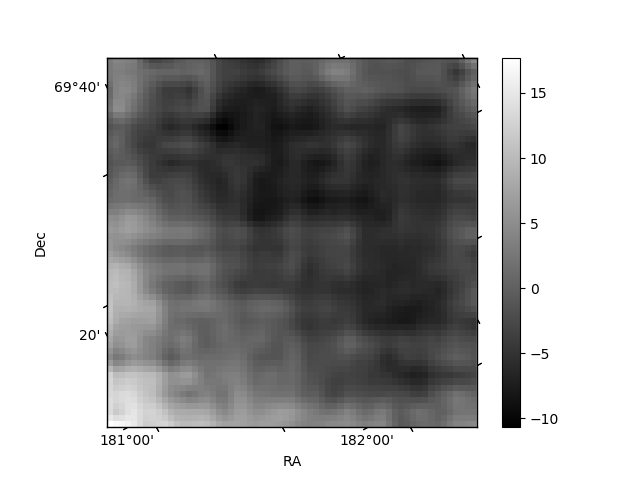
Quadrant B |
|---|---|---|---|
| Quadrant D | 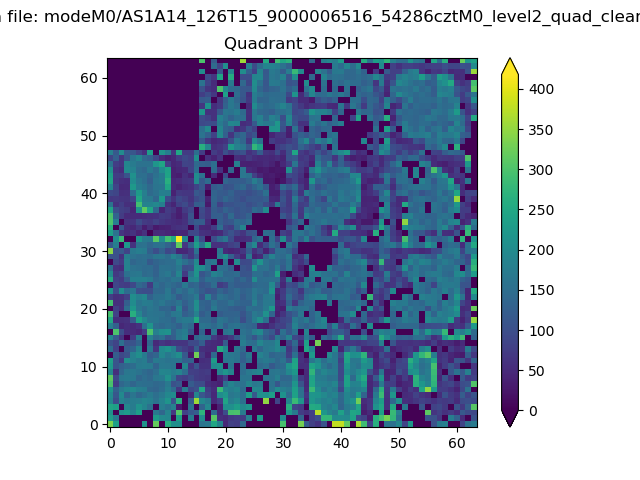 |
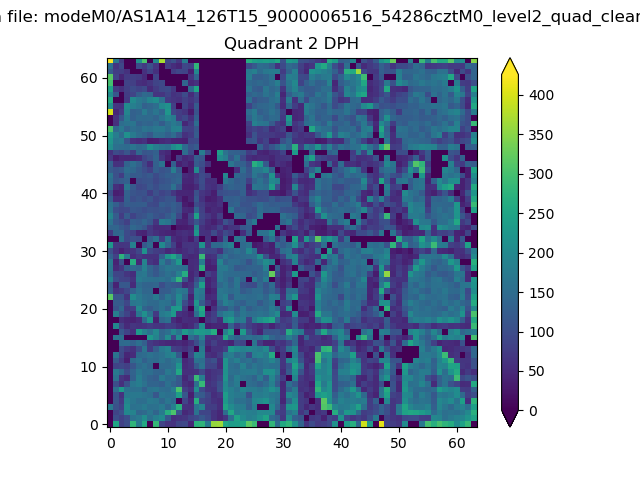 |
Quadrant C |
| Plot type | Count rate plots | Images |
|---|---|---|
| Comparison with Poisson distribution Blue bars denote a histogram of data divided into 1 sec bins. Red curve is a Poisson curve with rate = median count rate of data. |
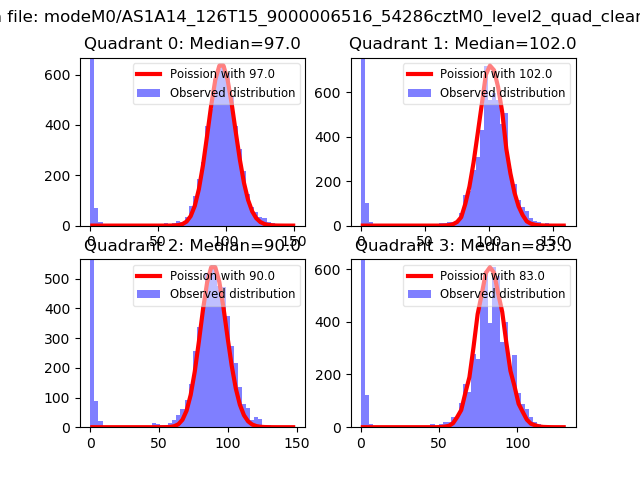 |
 |
| Quadrant-wise count rates Data is divided into 100 sec bins |
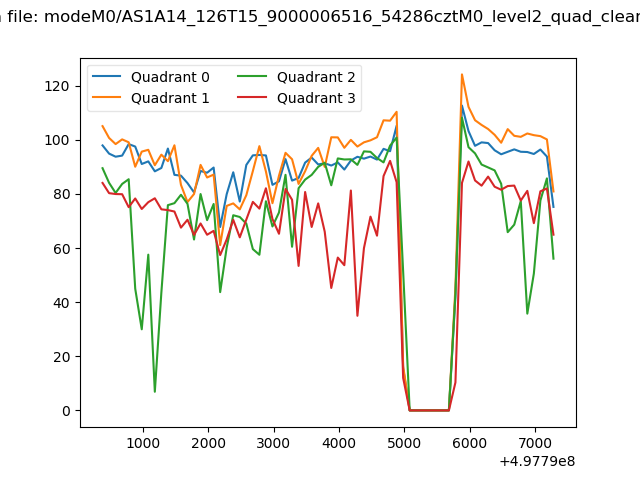 |
|
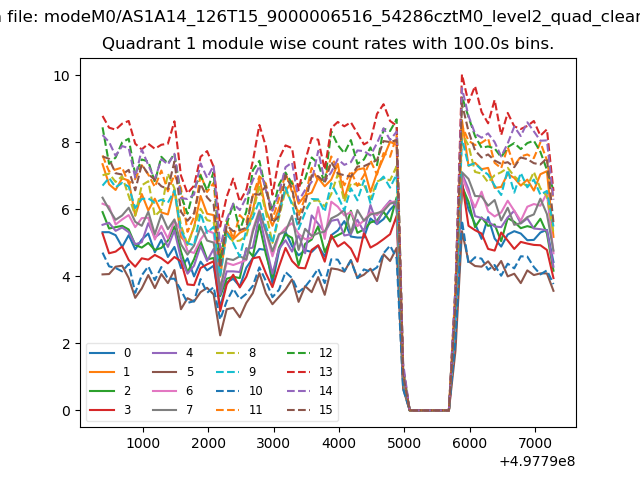
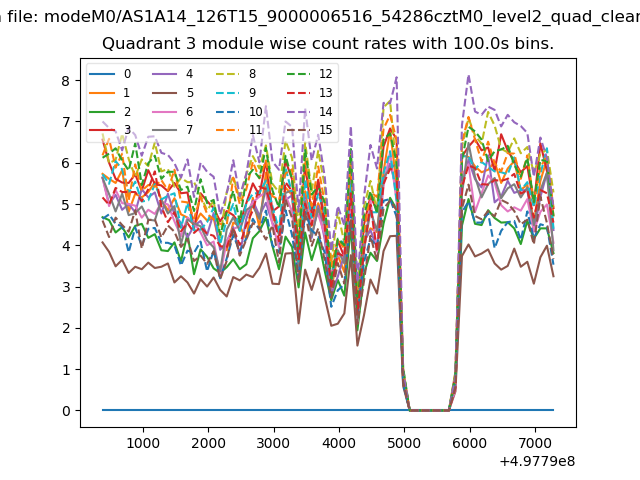
| Module-wise count rates for Quadrant A Data is divided into 100 sec bins |
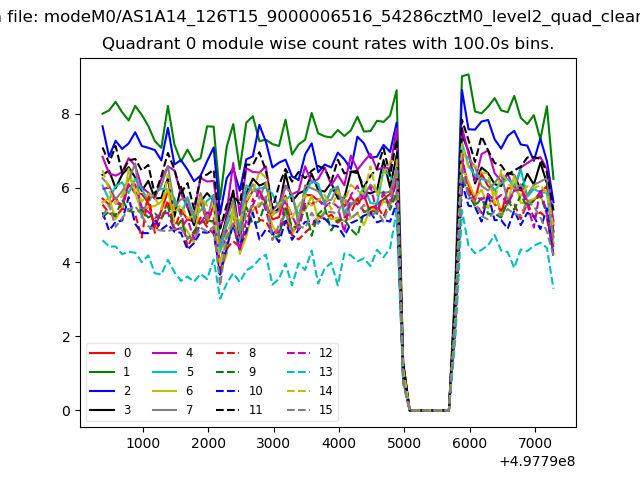 |
 |
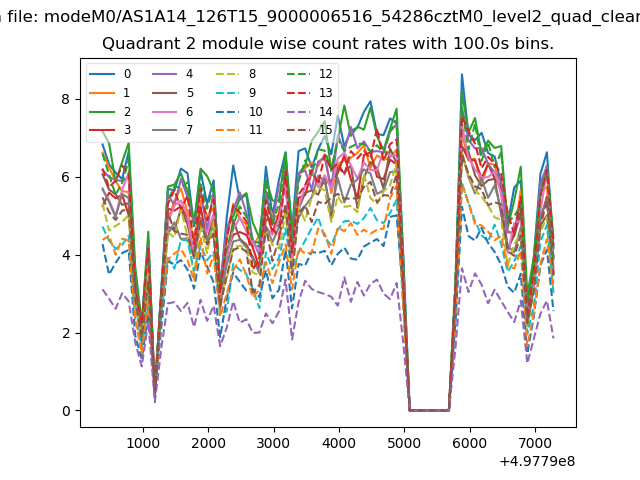
| Module-wise count rates for Quadrant B Data is divided into 100 sec bins |
 |
 |
| Module-wise count rates for Quadrant C Data is divided into 100 sec bins |
 |
 |
| Module-wise count rates for Quadrant D Data is divided into 100 sec bins |
 |
 |
| Parameter | Plot |
|---|---|
| CZT HV Monitor |  |
| D_VDD | 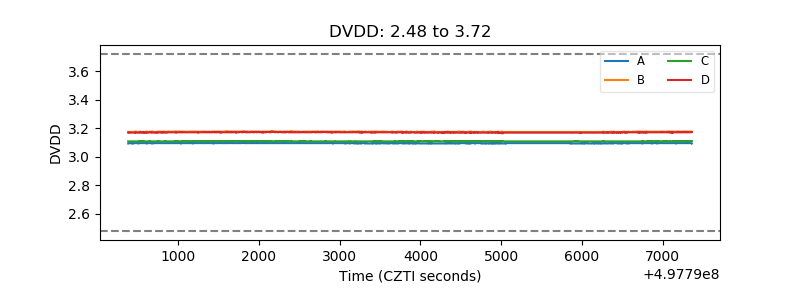 |
| Temperature 1 | 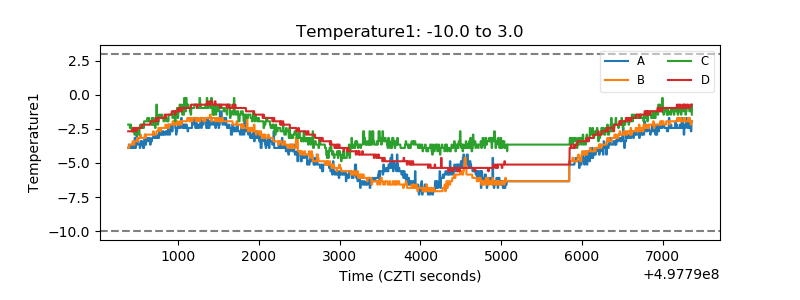 |
| Veto HV Monitor | 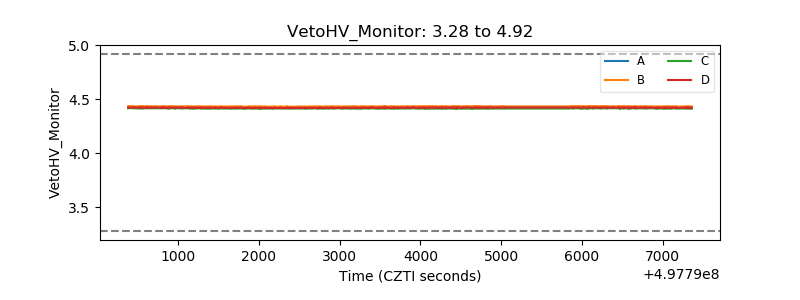 |
| Veto LLD | 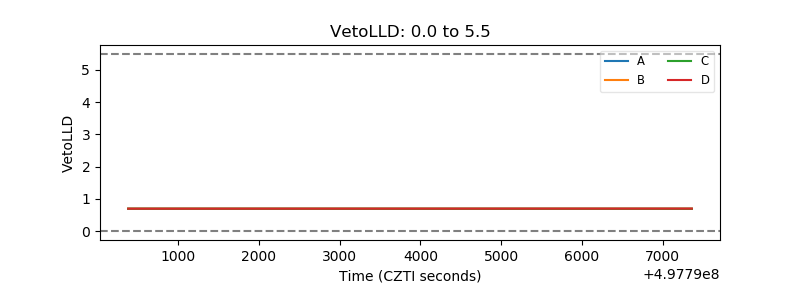 |
| Alpha Counter | 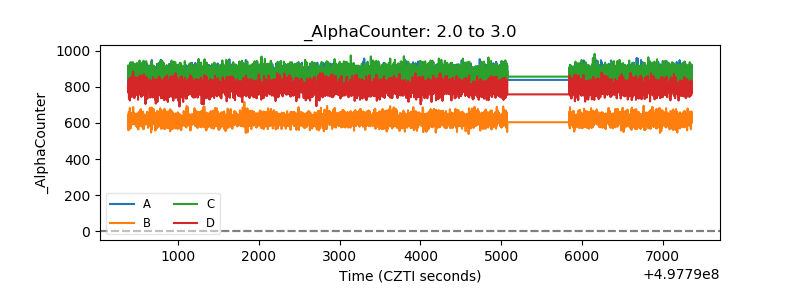 |
| _CPM_Rate | 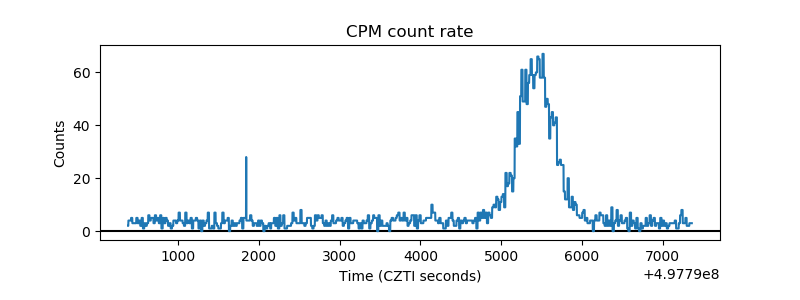 |
| CZT Counter | 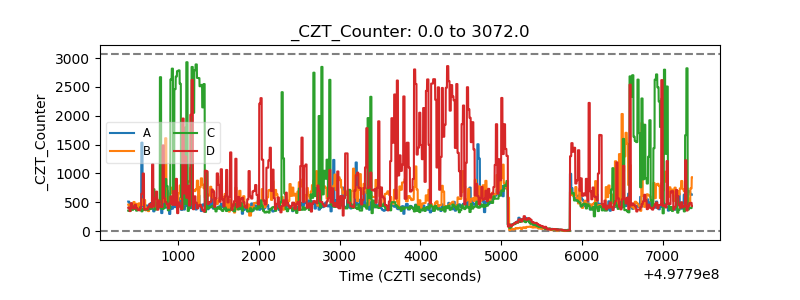 |
| +2.5 Volts monitor |  |
| +5 Volts monitor | 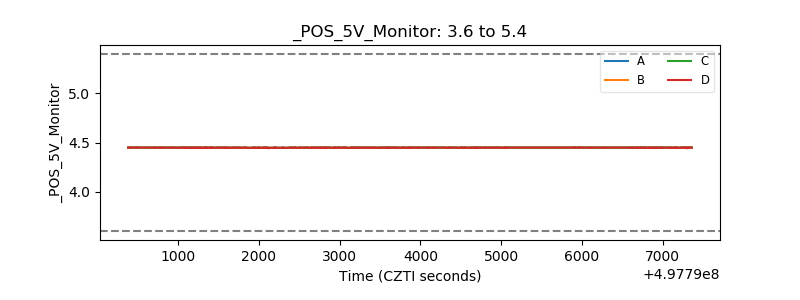 |
| _ROLL_ROT | 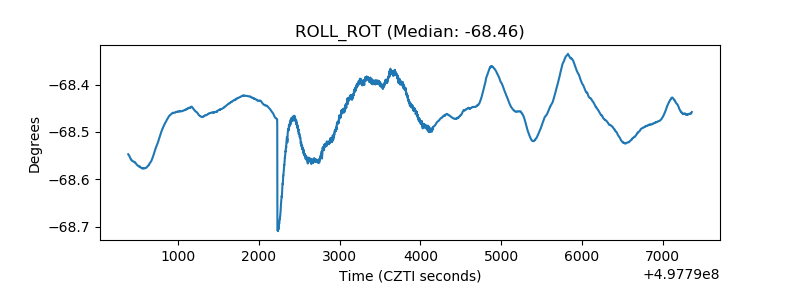 |
| _Roll_DEC | 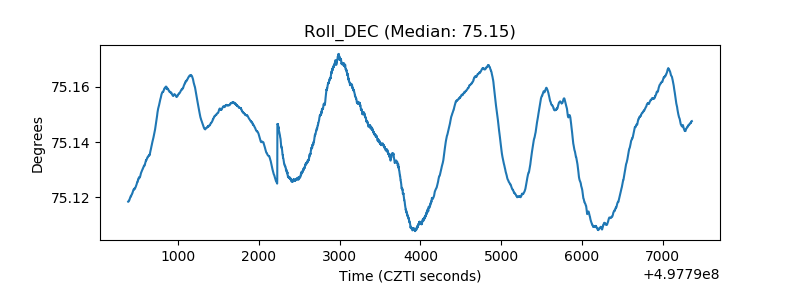 |
| _Roll_RA | 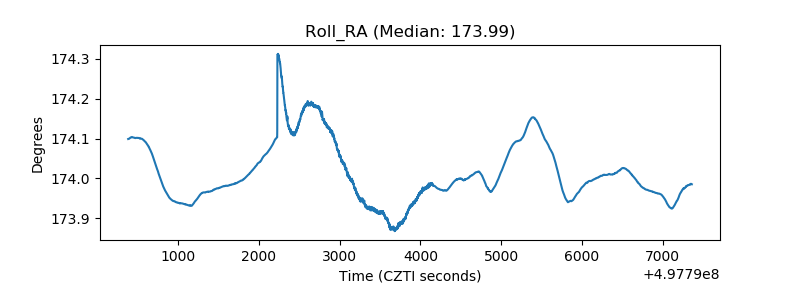 |
| Veto Counter | 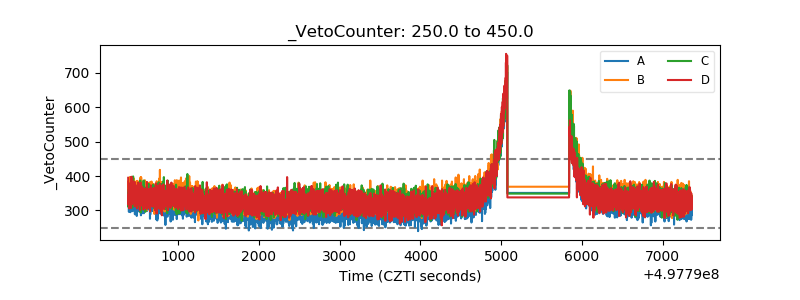 |