| Param | Original file | Final file |
|---|---|---|
| Filename | modeM0/AS1A14_126T15_9000006516_54287cztM0_level2.fits | modeM0/AS1A14_126T15_9000006516_54287cztM0_level2_quad_clean.evt |
| Size (bytes) | 519,690,240 | 94,242,240 |
| Size | 495.6 MB | 89.9 MB |
| Events in quadrant A | 3,473,390 | 644,020 |
| Events in quadrant B | 3,938,045 | 685,753 |
| Events in quadrant C | 6,683,780 | 503,545 |
| Events in quadrant D | 4,614,076 | 546,520 |
| Mode SS | |||
|---|---|---|---|
| Quadrant | BADHDUFLAG | Total packets | Discarded packets |
| A | 0 | 138 | 0 |
| B | 0 | 138 | 0 |
| C | 0 | 138 | 0 |
| D | 0 | 138 | 0 |
| Mode M0 | |||
|---|---|---|---|
| Quadrant | BADHDUFLAG | Total packets | Discarded packets |
| A | 0 | 15189 | 1 |
| B | 0 | 16431 | 1 |
| C | 0 | 24917 | 1 |
| D | 0 | 18474 | 3 |
| Mode M9 | |||
|---|---|---|---|
| Quadrant | BADHDUFLAG | Total packets | Discarded packets |
| A | 0 | 3 | 0 |
| B | 0 | 3 | 0 |
| C | 0 | 3 | 0 |
| D | 0 | 3 | 0 |
| Quadrant | Total seconds | Saturated seconds | Saturation percentage |
|---|---|---|---|
| A | 6794 | 92 | 1.354136% |
| B | 6795 | 85 | 1.250920% |
| C | 6795 | 1320 | 19.426049% |
| D | 6794 | 396 | 5.828672% |
Noise dominated data is calculated using 1-second bins in cleaned event files. If a bin has >2000 counts, and if more than 50% of those come from <1% of pixels, then it is considered to be noise-dominated and hence unusable.
| Quadrant | # 1 sec bins | Bins with >0 counts | Bins with >2000 counts | High rate bins dominated by noise | Noise dominated (total time) | Noise dominated (detector-on time) | Marked lightcurve |
|---|---|---|---|---|---|---|---|
| A | 7109 | 6795 | 35 | 35 | 0.49% | 0.52% | 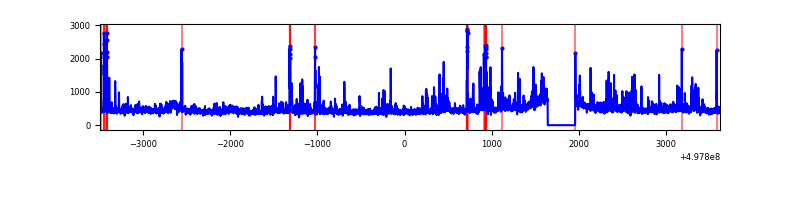 |
| B | 7110 | 6796 | 25 | 25 | 0.35% | 0.37% | 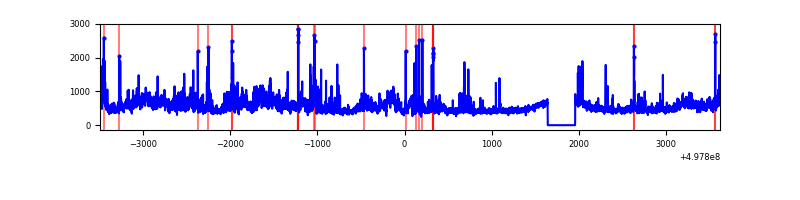 |
| C | 7109 | 6795 | 1340 | 1340 | 18.85% | 19.72% | 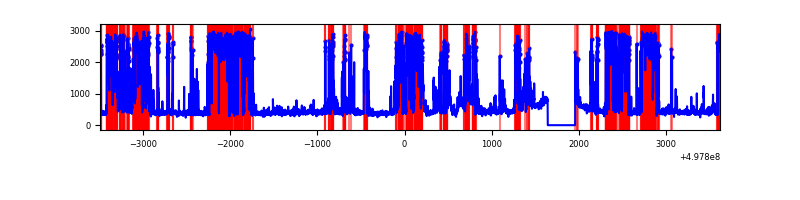 |
| D | 7109 | 6795 | 350 | 350 | 4.92% | 5.15% | 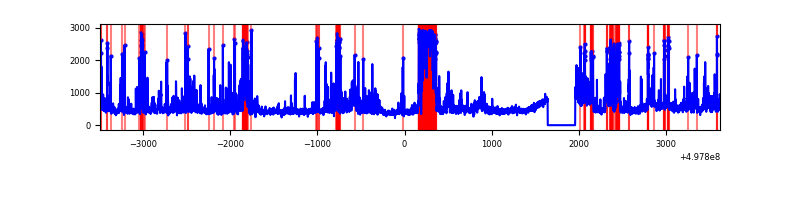 |
Top three noisy pixels from each quadrant. If the there are fewer than three noisy pixels in the level2.evt file, extra rows are filled as -1
| Pixel properties | Quadrant properties | ||||||
|---|---|---|---|---|---|---|---|
| Quadrant | DetID | PixID | Counts | Sigma | Mean | Median | Sigma |
| A | 7 | 206 | 122787 | 690.63 | 714 | 697 | 176.8 |
| A | 4 | 78 | 115054 | 646.88 | 714 | 697 | 176.8 |
| A | 7 | 29 | 101511 | 570.28 | 714 | 697 | 176.8 |
| B | 7 | 0 | 757705 | 5059.55 | 702 | 677 | 149.6 |
| B | 5 | 185 | 234073 | 1559.89 | 702 | 677 | 149.6 |
| B | 10 | 247 | 45490 | 299.51 | 702 | 677 | 149.6 |
| C | 1 | 241 | 3298932 | 19153.49 | 631 | 624 | 172.2 |
| C | 14 | 254 | 770053 | 4468.12 | 631 | 624 | 172.2 |
| C | 12 | 252 | 41005 | 234.5 | 631 | 624 | 172.2 |
| D | 3 | 12 | 737199 | 3807.49 | 679 | 646 | 193.4 |
| D | 2 | 153 | 344831 | 1779.21 | 679 | 646 | 193.4 |
| D | 8 | 176 | 283354 | 1461.41 | 679 | 646 | 193.4 |
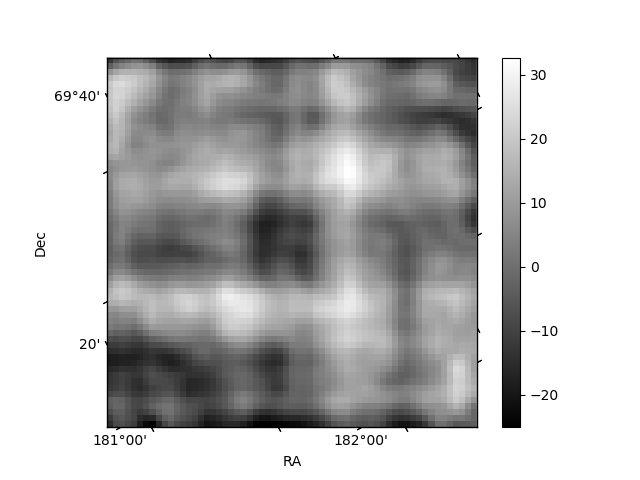
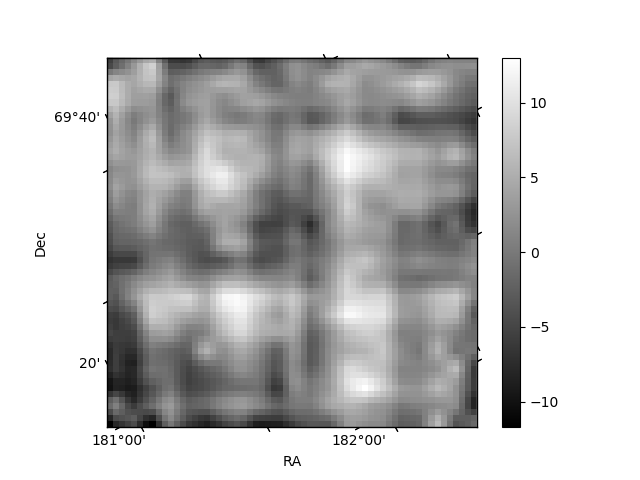
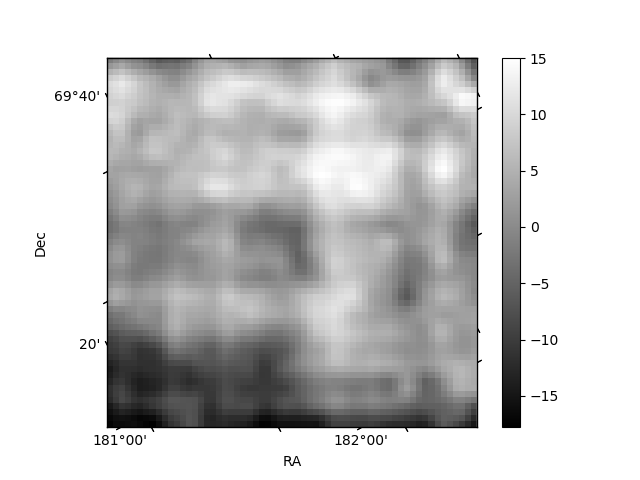
Histogram calculated using DETX and DETY for each event in the final _common_clean file
| Quadrant A | 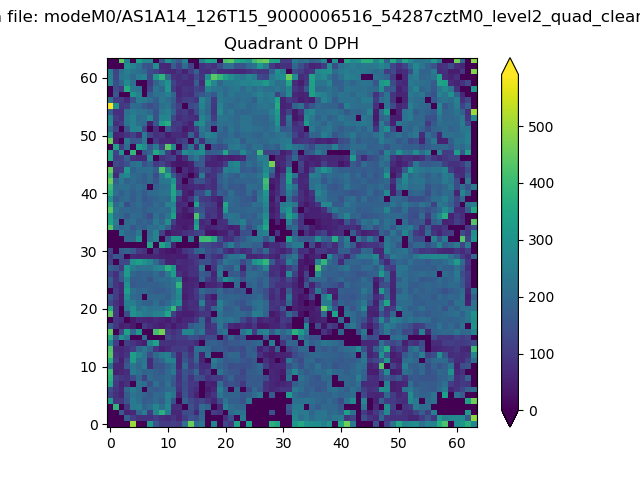 |
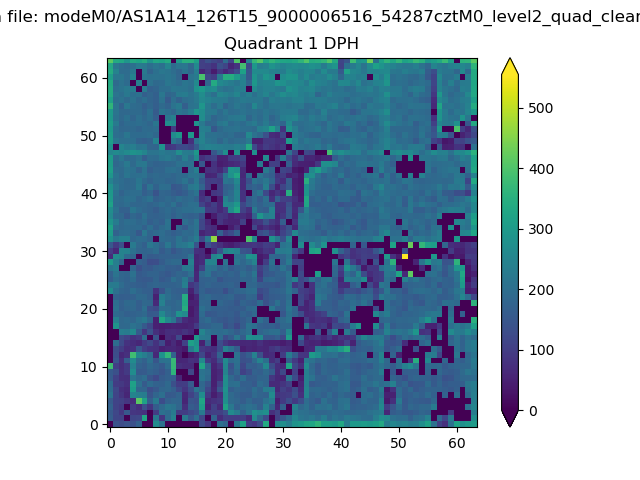 |
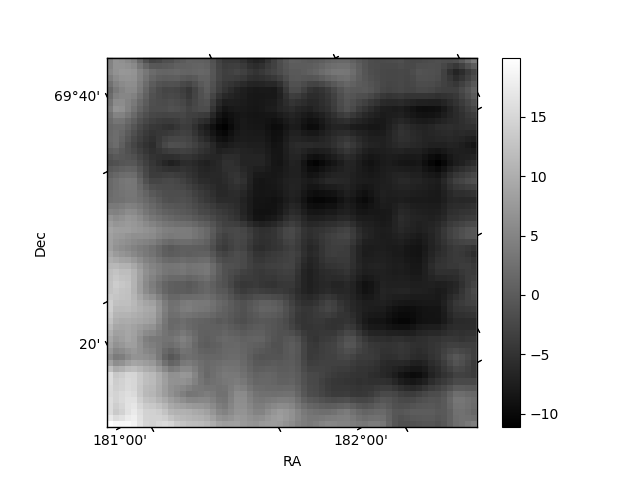
Quadrant B |
|---|---|---|---|
| Quadrant D | 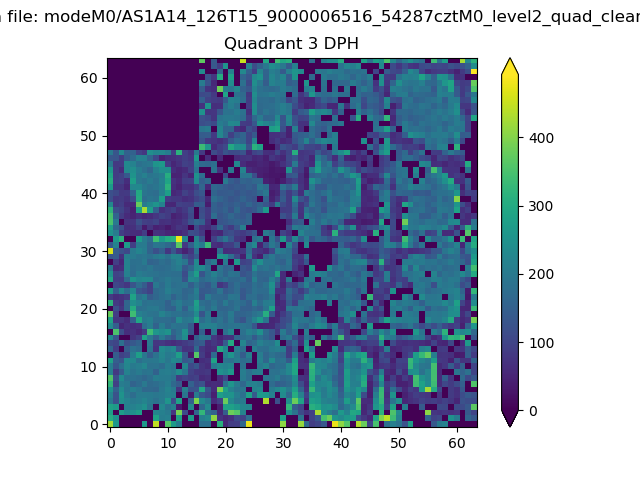 |
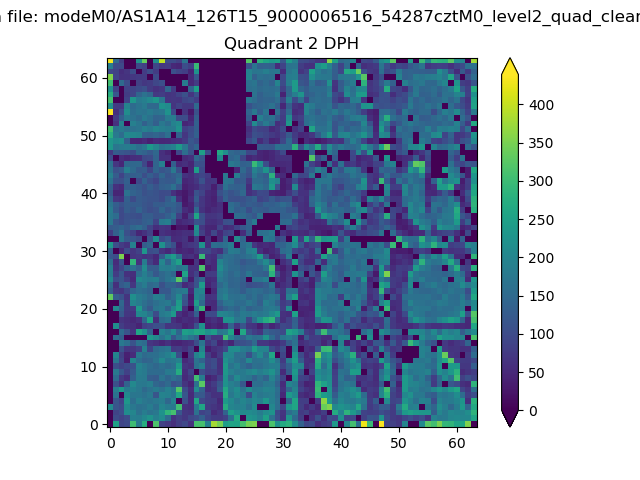 |
Quadrant C |
| Plot type | Count rate plots | Images |
|---|---|---|
| Comparison with Poisson distribution Blue bars denote a histogram of data divided into 1 sec bins. Red curve is a Poisson curve with rate = median count rate of data. |
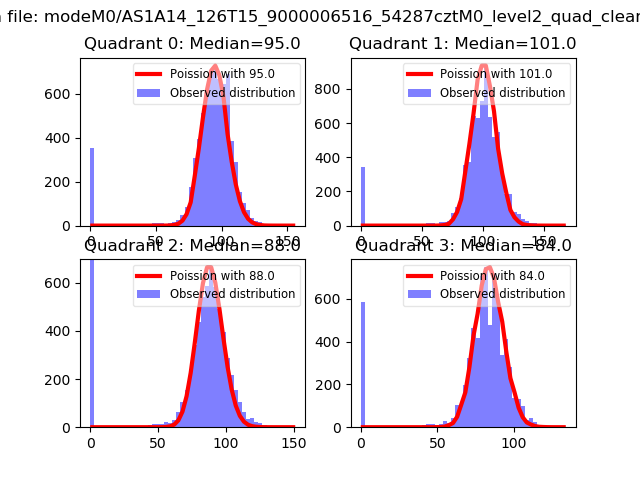 |
 |
| Quadrant-wise count rates Data is divided into 100 sec bins |
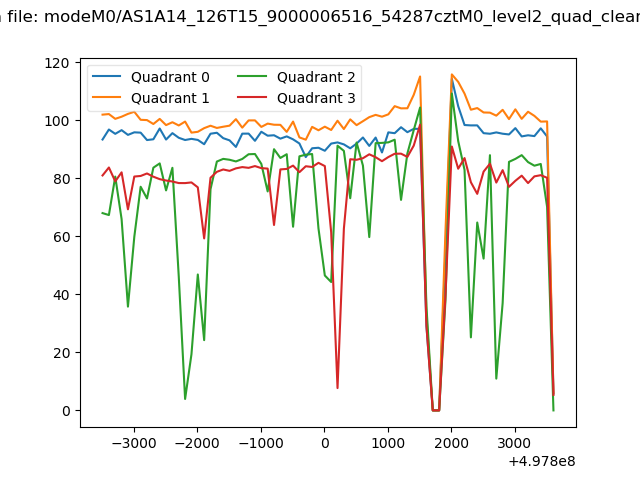 |
|
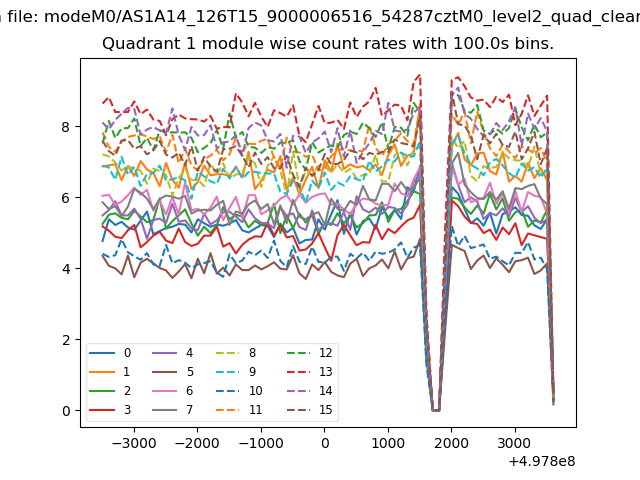
| Module-wise count rates for Quadrant A Data is divided into 100 sec bins |
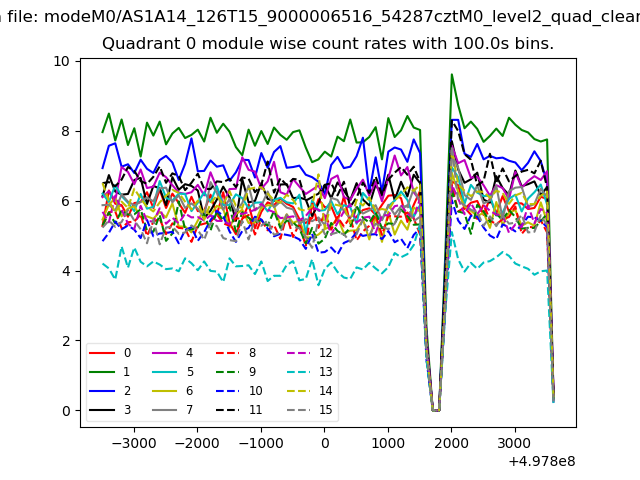 |
 |
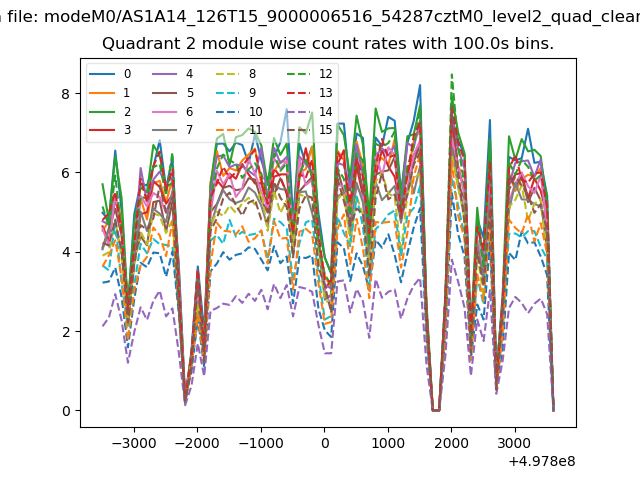
| Module-wise count rates for Quadrant B Data is divided into 100 sec bins |
 |
 |
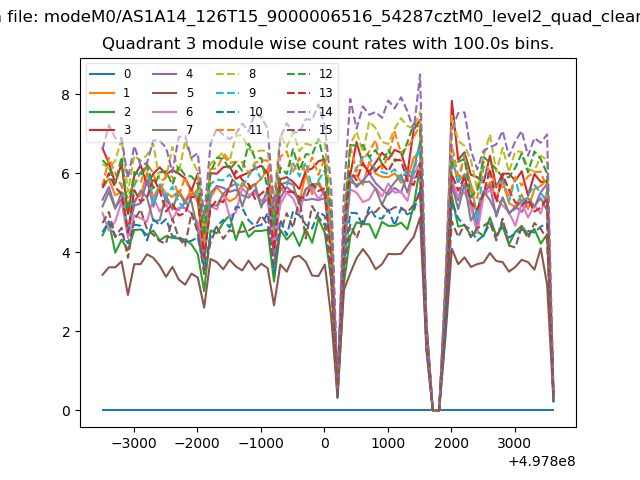
| Module-wise count rates for Quadrant C Data is divided into 100 sec bins |
 |
 |
| Module-wise count rates for Quadrant D Data is divided into 100 sec bins |
 |
 |
| Parameter | Plot |
|---|---|
| CZT HV Monitor | 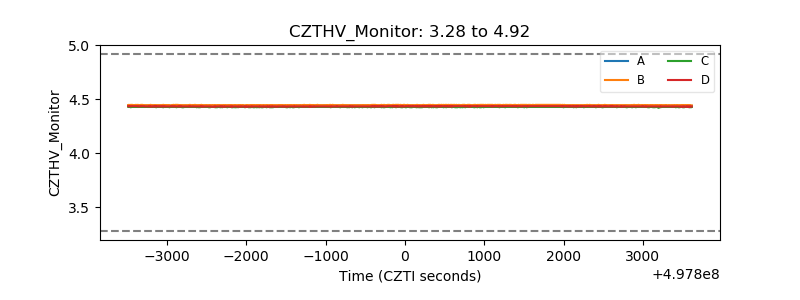 |
| D_VDD | 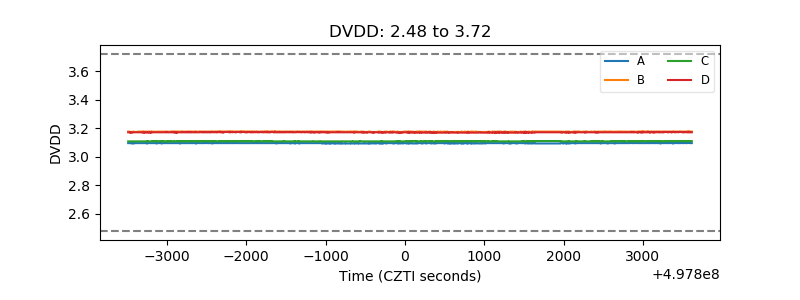 |
| Temperature 1 | 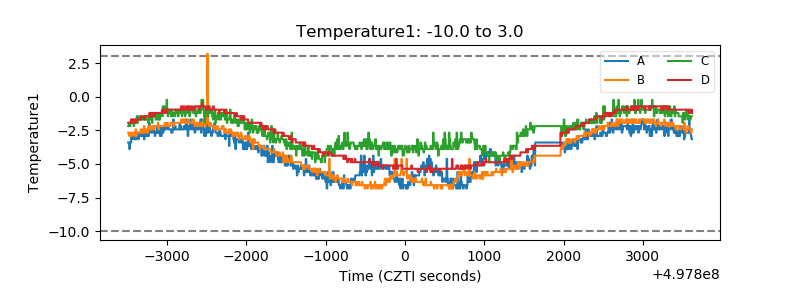 |
| Veto HV Monitor | 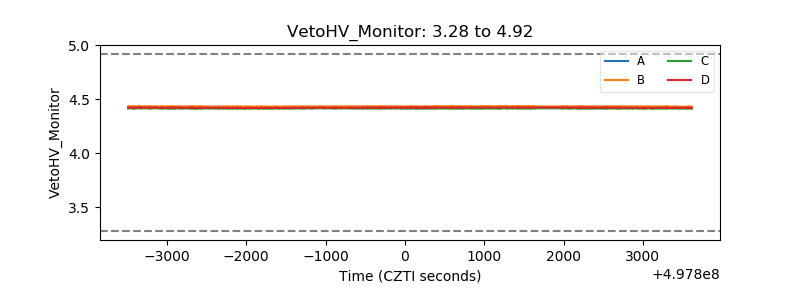 |
| Veto LLD | 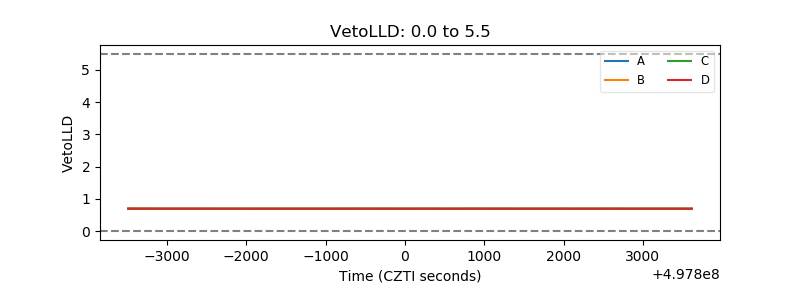 |
| Alpha Counter | 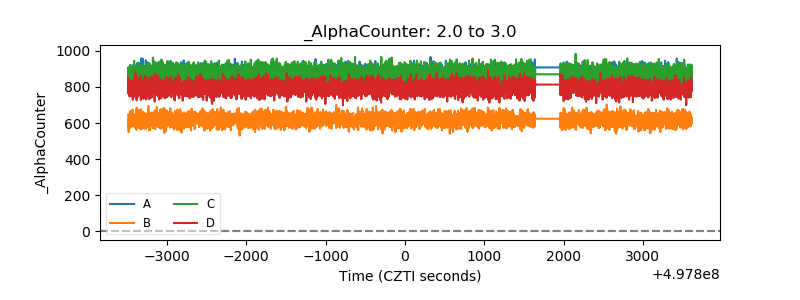 |
| _CPM_Rate | 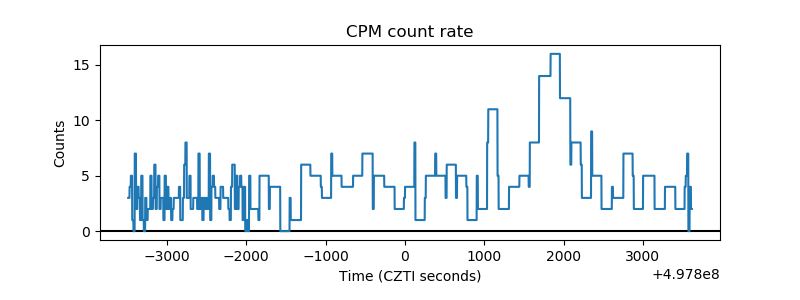 |
| CZT Counter | 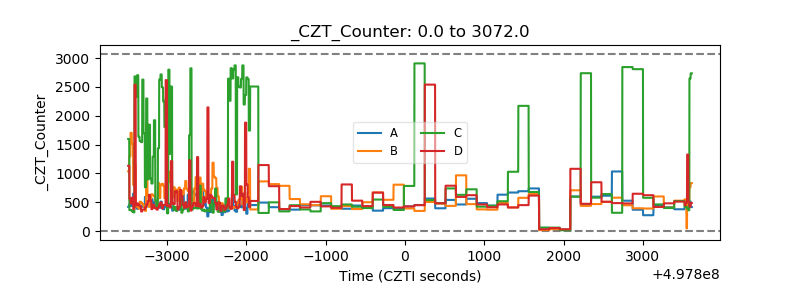 |
| +2.5 Volts monitor |  |
| +5 Volts monitor | 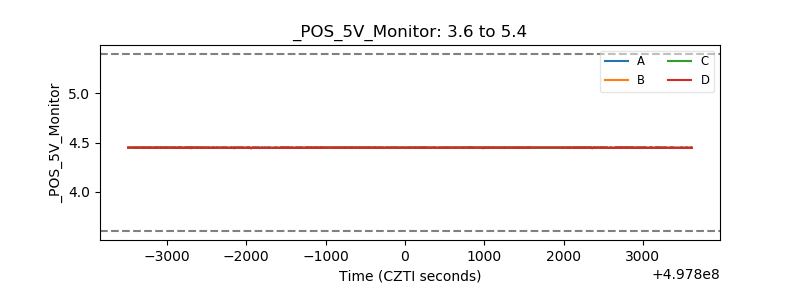 |
| _ROLL_ROT | 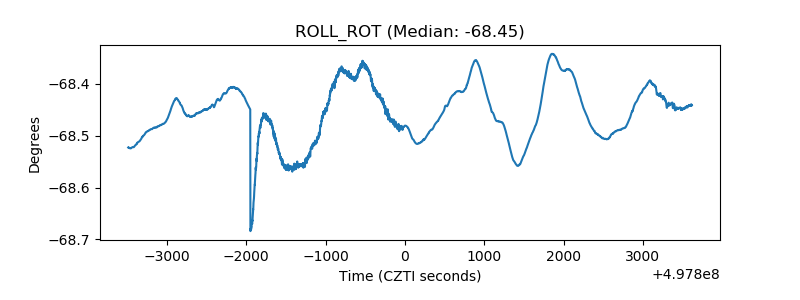 |
| _Roll_DEC | 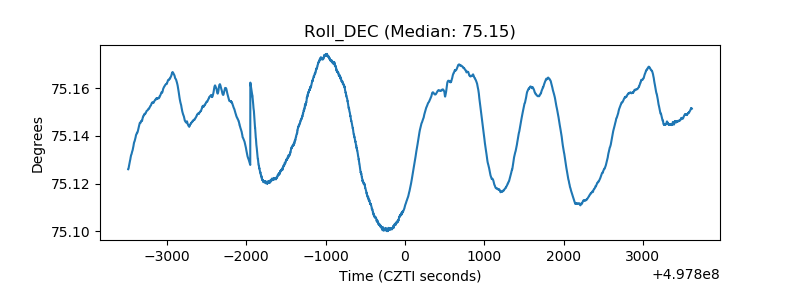 |
| _Roll_RA | 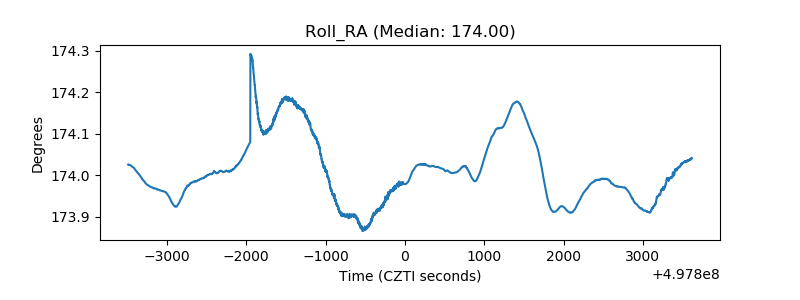 |
| Veto Counter | 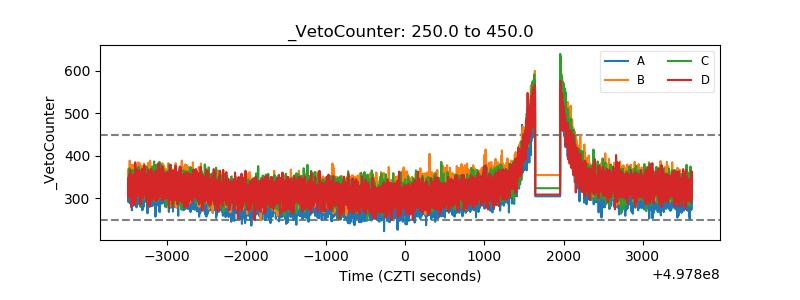 |