| Param | Original file | Final file |
|---|---|---|
| Filename | modeM0/AS1A14_126T15_9000006516_54288cztM0_level2.fits | modeM0/AS1A14_126T15_9000006516_54288cztM0_level2_quad_clean.evt |
| Size (bytes) | 680,647,680 | 98,870,400 |
| Size | 649.1 MB | 94.3 MB |
| Events in quadrant A | 5,546,166 | 633,727 |
| Events in quadrant B | 4,198,334 | 755,593 |
| Events in quadrant C | 7,542,333 | 527,136 |
| Events in quadrant D | 7,324,498 | 553,279 |
| Mode SS | |||
|---|---|---|---|
| Quadrant | BADHDUFLAG | Total packets | Discarded packets |
| A | 0 | 151 | 0 |
| B | 0 | 152 | 0 |
| C | 0 | 151 | 1 |
| D | 0 | 152 | 0 |
| Mode M0 | |||
|---|---|---|---|
| Quadrant | BADHDUFLAG | Total packets | Discarded packets |
| A | 0 | 22039 | 63 |
| B | 0 | 17673 | 47 |
| C | 0 | 27977 | 111 |
| D | 0 | 27152 | 126 |
| Quadrant | Total seconds | Saturated seconds | Saturation percentage |
|---|---|---|---|
| A | 7526 | 890 | 11.825671% |
| B | 7526 | 47 | 0.624502% |
| C | 7527 | 1648 | 21.894513% |
| D | 7532 | 976 | 12.958046% |
Noise dominated data is calculated using 1-second bins in cleaned event files. If a bin has >2000 counts, and if more than 50% of those come from <1% of pixels, then it is considered to be noise-dominated and hence unusable.
| Quadrant | # 1 sec bins | Bins with >0 counts | Bins with >2000 counts | High rate bins dominated by noise | Noise dominated (total time) | Noise dominated (detector-on time) | Marked lightcurve |
|---|---|---|---|---|---|---|---|
| A | 7558 | 7536 | 857 | 857 | 11.34% | 11.37% | 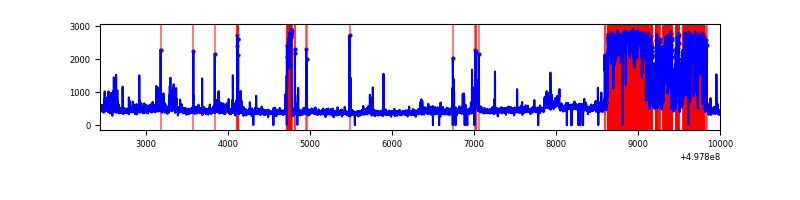 |
| B | 7559 | 7536 | 33 | 33 | 0.44% | 0.44% | 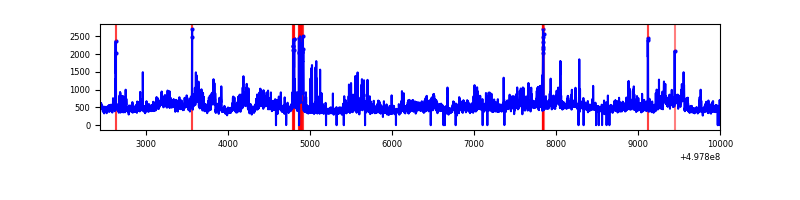 |
| C | 7559 | 7535 | 1667 | 1667 | 22.05% | 22.12% | 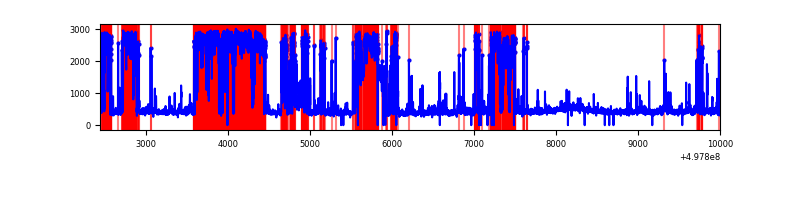 |
| D | 7559 | 7540 | 999 | 999 | 13.22% | 13.25% | 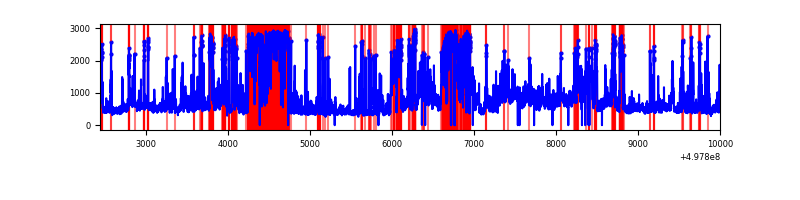 |
Top three noisy pixels from each quadrant. If the there are fewer than three noisy pixels in the level2.evt file, extra rows are filled as -1
| Pixel properties | Quadrant properties | ||||||
|---|---|---|---|---|---|---|---|
| Quadrant | DetID | PixID | Counts | Sigma | Mean | Median | Sigma |
| A | 7 | 29 | 2213471 | 12310.56 | 729 | 711 | 179.7 |
| A | 15 | 174 | 204979 | 1136.43 | 729 | 711 | 179.7 |
| A | 3 | 110 | 71759 | 395.27 | 729 | 711 | 179.7 |
| B | 7 | 0 | 472847 | 2843.0 | 774 | 745 | 166.1 |
| B | 10 | 28 | 393864 | 2367.36 | 774 | 745 | 166.1 |
| B | 0 | 213 | 79325 | 473.21 | 774 | 745 | 166.1 |
| C | 1 | 241 | 4589865 | 24810.64 | 674 | 666 | 185.0 |
| C | 1 | 29 | 145669 | 783.93 | 674 | 666 | 185.0 |
| C | 15 | 189 | 58375 | 311.99 | 674 | 666 | 185.0 |
| D | 3 | 12 | 1687799 | 8277.06 | 716 | 684 | 203.8 |
| D | 8 | 176 | 1628033 | 7983.84 | 716 | 684 | 203.8 |
| D | 2 | 153 | 410379 | 2009.98 | 716 | 684 | 203.8 |
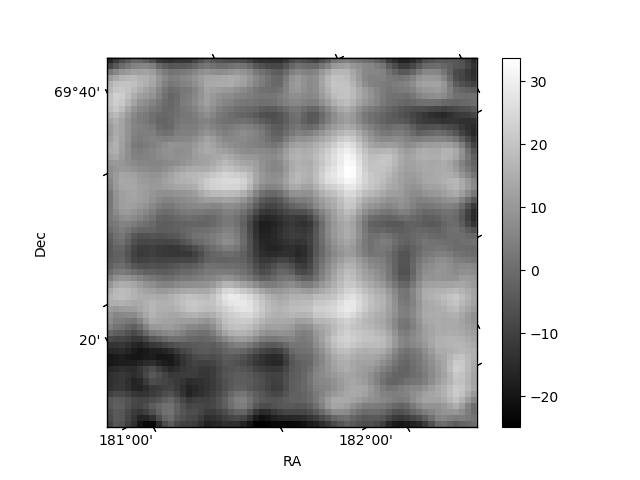
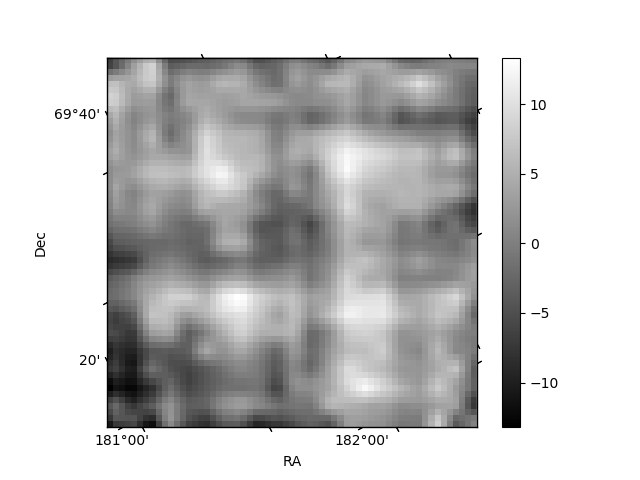
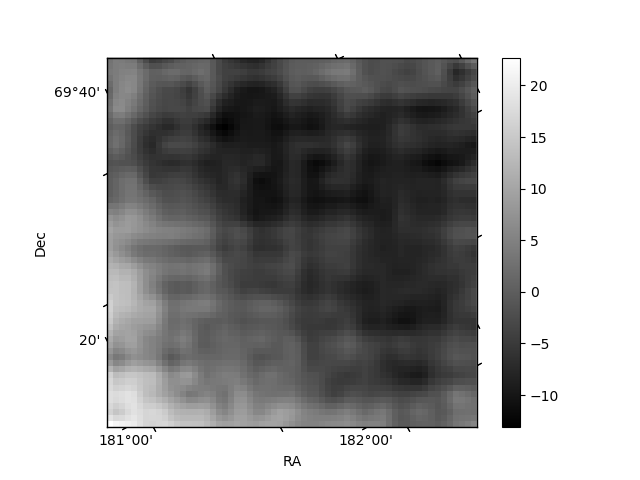
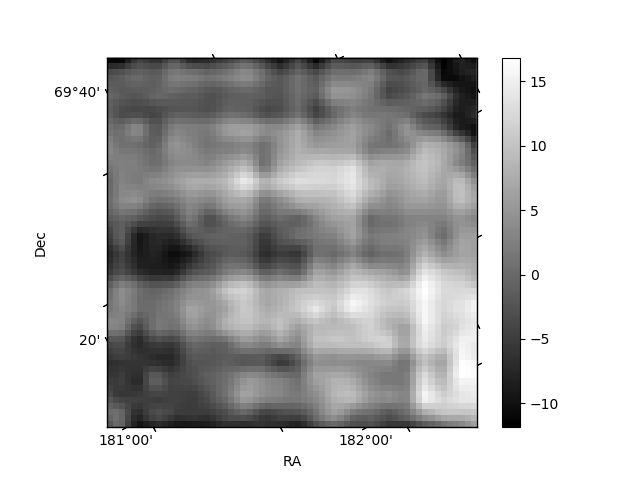
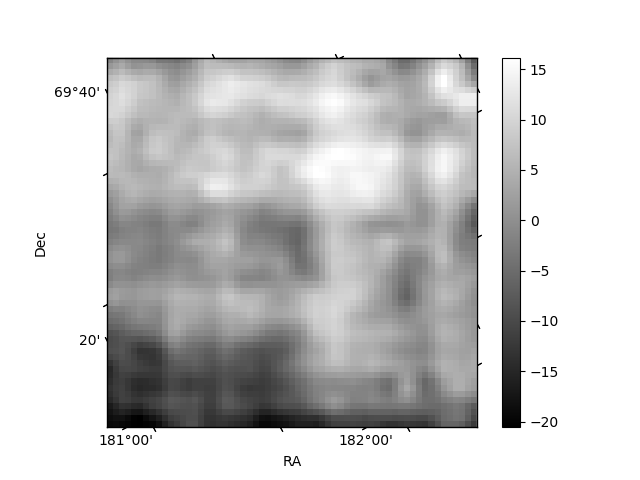
Histogram calculated using DETX and DETY for each event in the final _common_clean file
| Quadrant A | 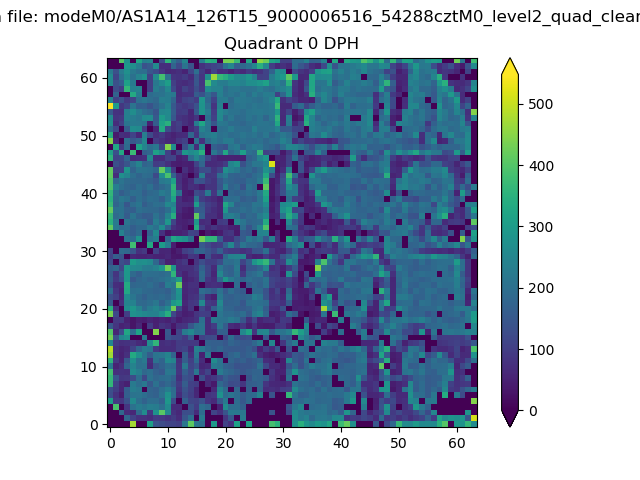 |
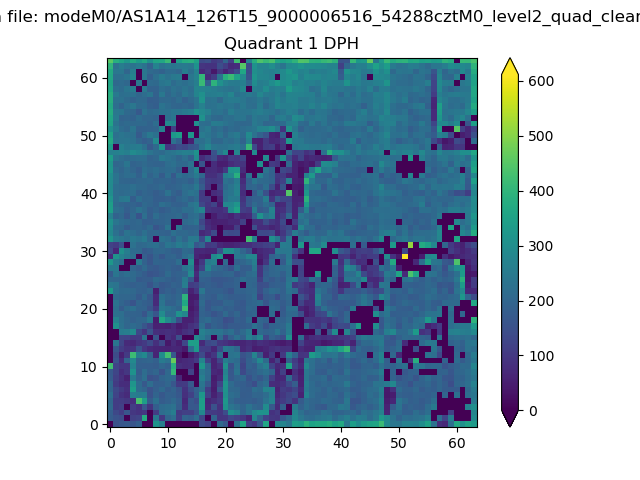 |
Quadrant B |
|---|---|---|---|
| Quadrant D |  |
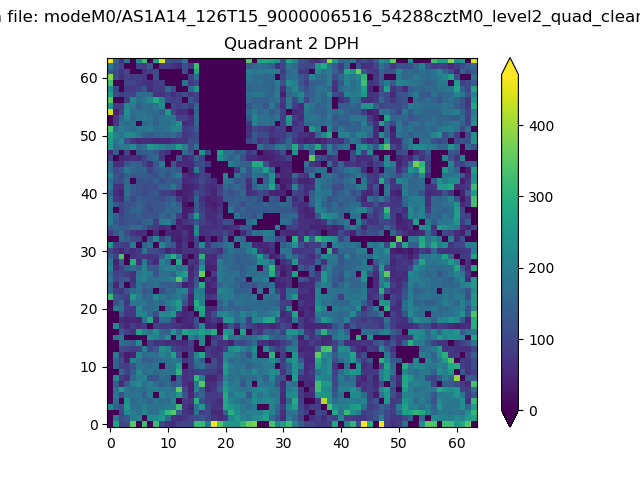 |
Quadrant C |
| Plot type | Count rate plots | Images |
|---|---|---|
| Comparison with Poisson distribution Blue bars denote a histogram of data divided into 1 sec bins. Red curve is a Poisson curve with rate = median count rate of data. |
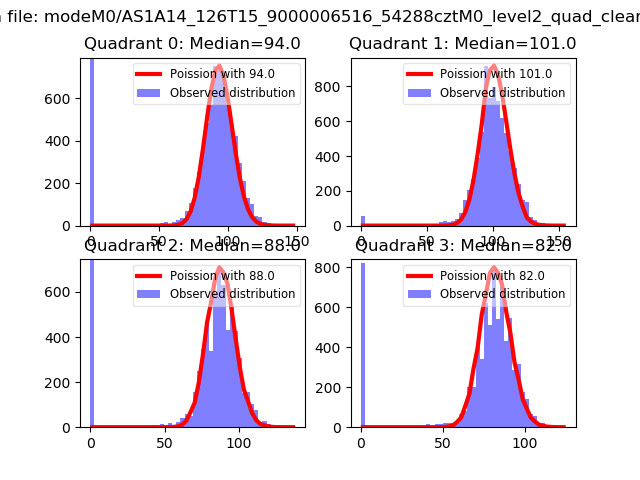 |
 |
| Quadrant-wise count rates Data is divided into 100 sec bins |
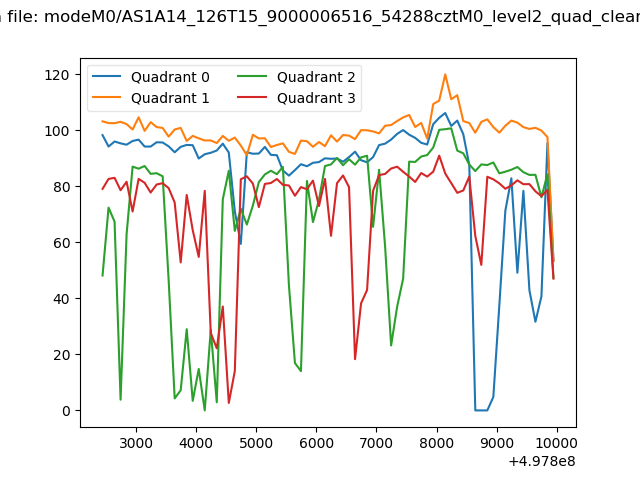 |
|
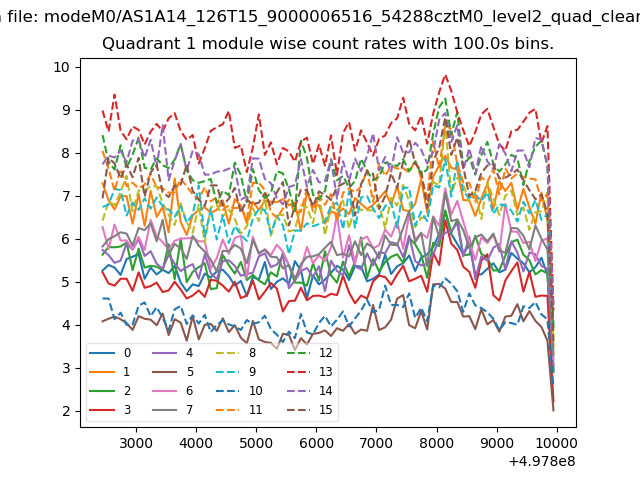
| Module-wise count rates for Quadrant A Data is divided into 100 sec bins |
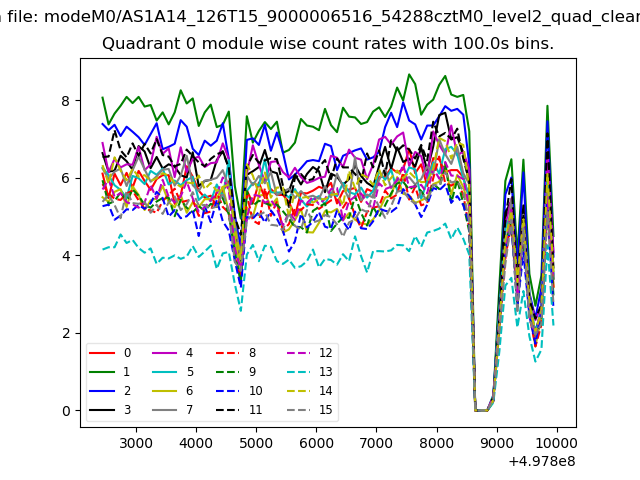 |
 |
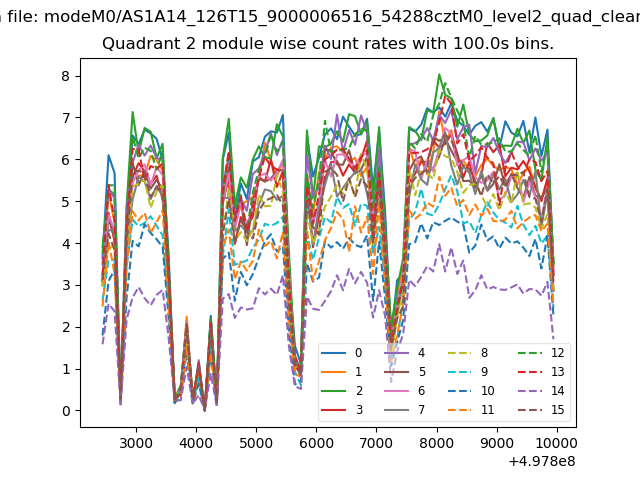
| Module-wise count rates for Quadrant B Data is divided into 100 sec bins |
 |
 |
| Module-wise count rates for Quadrant C Data is divided into 100 sec bins |
 |
 |
| Module-wise count rates for Quadrant D Data is divided into 100 sec bins |
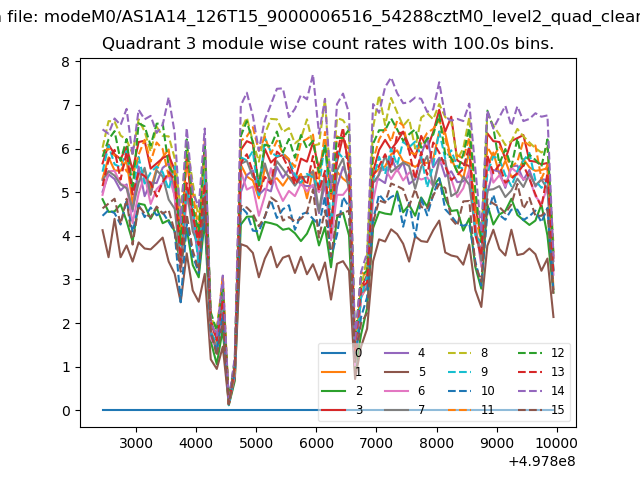 |
 |
| Parameter | Plot |
|---|---|
| CZT HV Monitor | 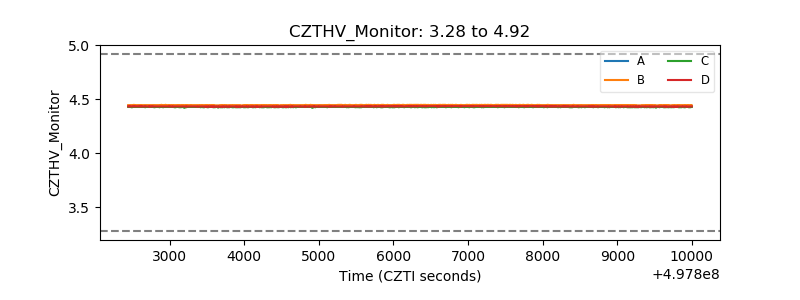 |
| D_VDD | 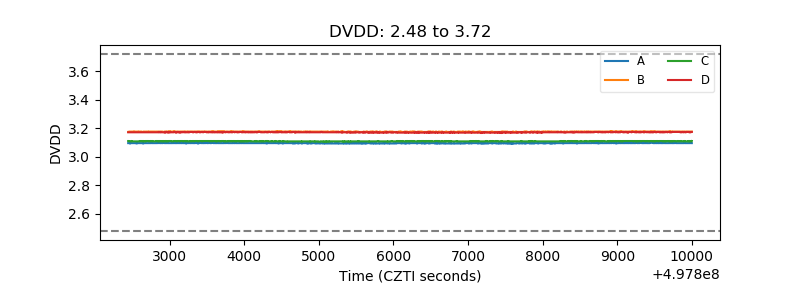 |
| Temperature 1 | 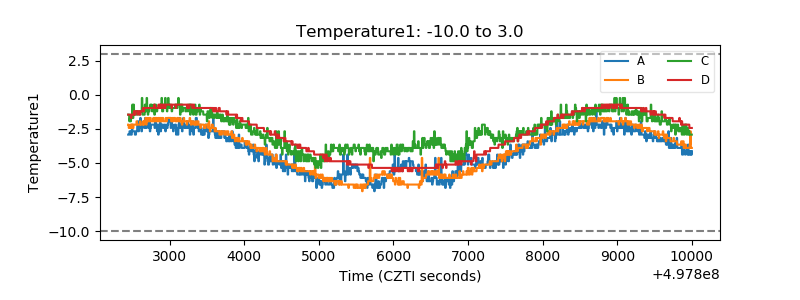 |
| Veto HV Monitor | 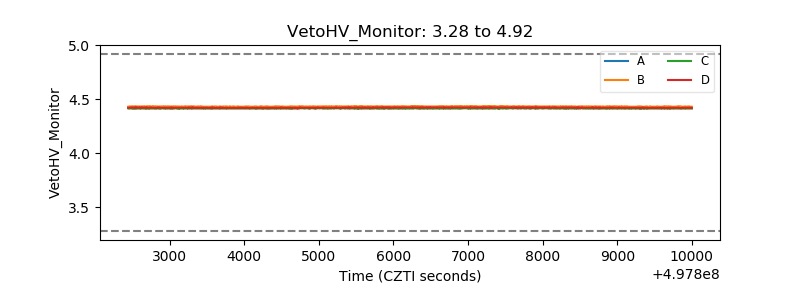 |
| Veto LLD | 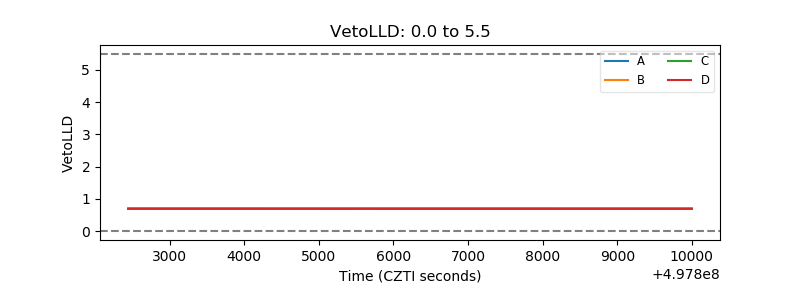 |
| Alpha Counter | 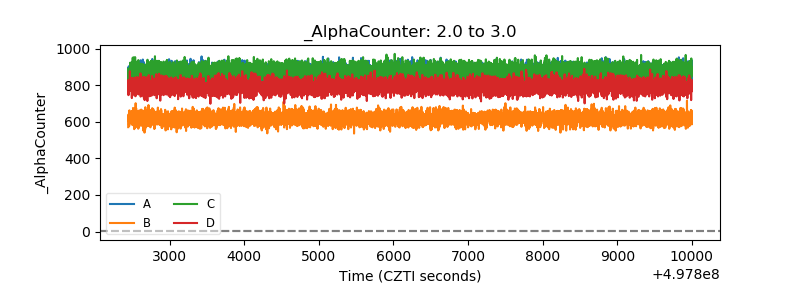 |
| _CPM_Rate | 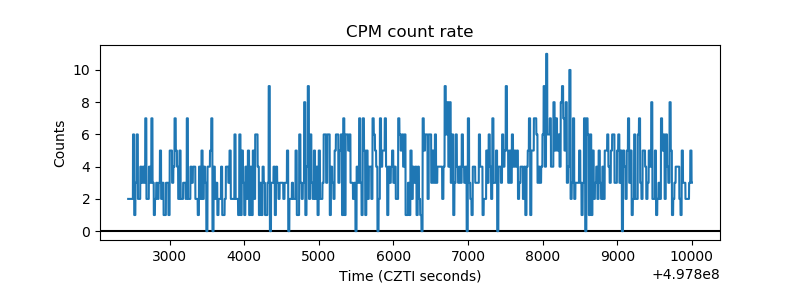 |
| CZT Counter | 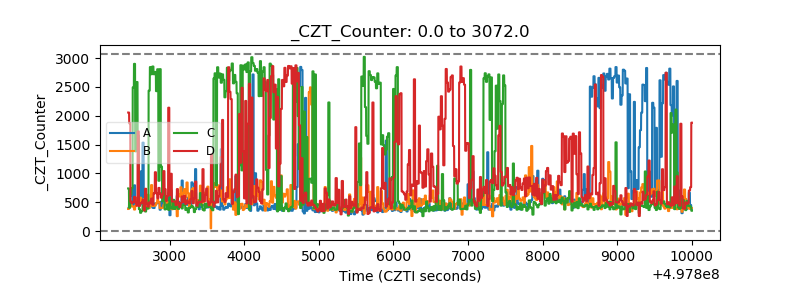 |
| +2.5 Volts monitor |  |
| +5 Volts monitor |  |
| _ROLL_ROT | 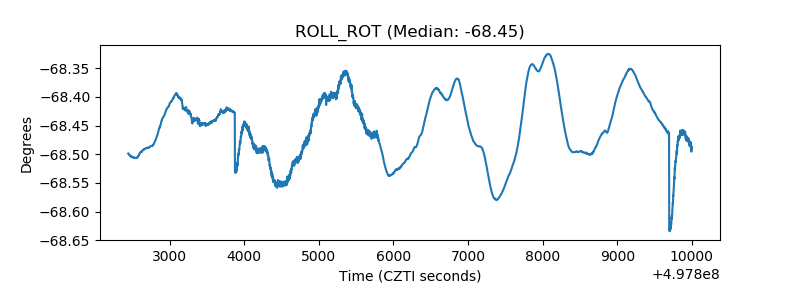 |
| _Roll_DEC | 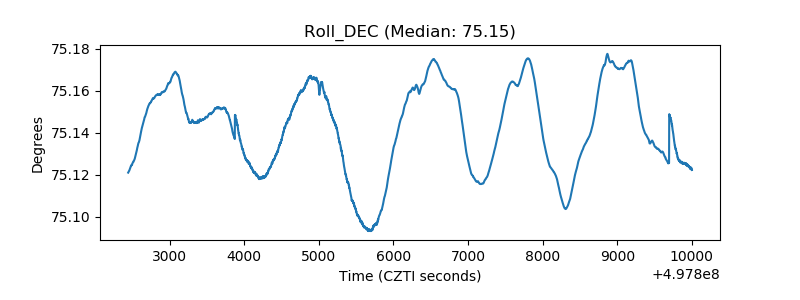 |
| _Roll_RA | 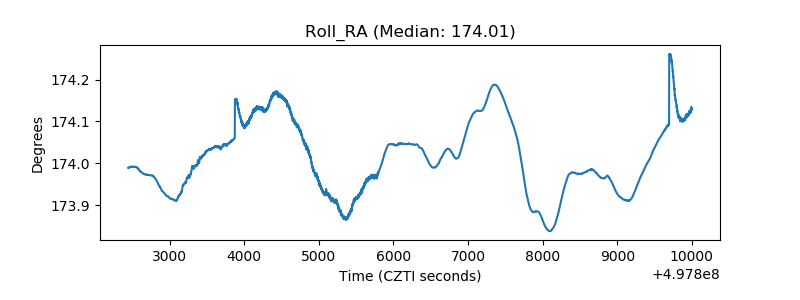 |
| Veto Counter | 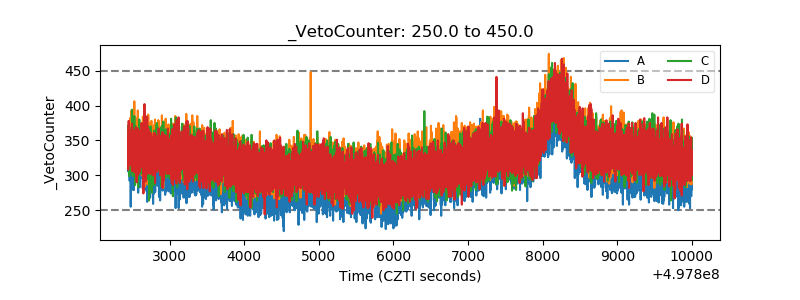 |