| Param | Original file | Final file |
|---|---|---|
| Filename | modeM0/AS1A14_126T15_9000006516_54289cztM0_level2.fits | modeM0/AS1A14_126T15_9000006516_54289cztM0_level2_quad_clean.evt |
| Size (bytes) | 506,747,520 | 102,911,040 |
| Size | 483.3 MB | 98.1 MB |
| Events in quadrant A | 4,788,520 | 641,606 |
| Events in quadrant B | 3,908,106 | 734,879 |
| Events in quadrant C | 3,931,499 | 629,891 |
| Events in quadrant D | 5,559,838 | 598,951 |
| Mode SS | |||
|---|---|---|---|
| Quadrant | BADHDUFLAG | Total packets | Discarded packets |
| A | 0 | 148 | 0 |
| B | 0 | 148 | 0 |
| C | 0 | 147 | 0 |
| D | 0 | 148 | 0 |
| Mode M0 | |||
|---|---|---|---|
| Quadrant | BADHDUFLAG | Total packets | Discarded packets |
| A | 0 | 19962 | 312 |
| B | 0 | 17148 | 113 |
| C | 0 | 17490 | 191 |
| D | 0 | 21709 | 191 |
| Quadrant | Total seconds | Saturated seconds | Saturation percentage |
|---|---|---|---|
| A | 7336 | 627 | 8.546892% |
| B | 7345 | 72 | 0.980259% |
| C | 7322 | 308 | 4.206501% |
| D | 7332 | 264 | 3.600655% |
Noise dominated data is calculated using 1-second bins in cleaned event files. If a bin has >2000 counts, and if more than 50% of those come from <1% of pixels, then it is considered to be noise-dominated and hence unusable.
| Quadrant | # 1 sec bins | Bins with >0 counts | Bins with >2000 counts | High rate bins dominated by noise | Noise dominated (total time) | Noise dominated (detector-on time) | Marked lightcurve |
|---|---|---|---|---|---|---|---|
| A | 7412 | 7389 | 578 | 578 | 7.80% | 7.82% | 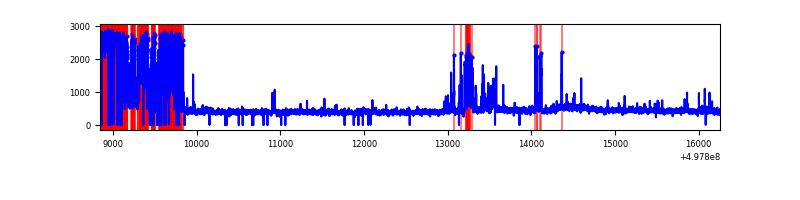 |
| B | 7412 | 7377 | 53 | 53 | 0.72% | 0.72% | 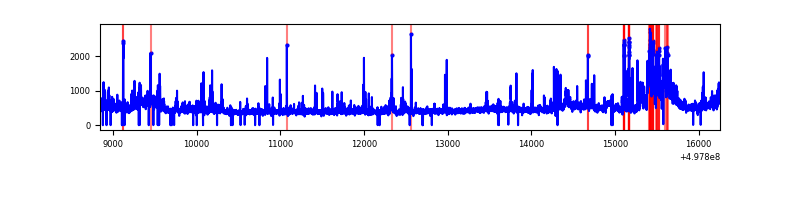 |
| C | 7413 | 7362 | 320 | 320 | 4.32% | 4.35% | 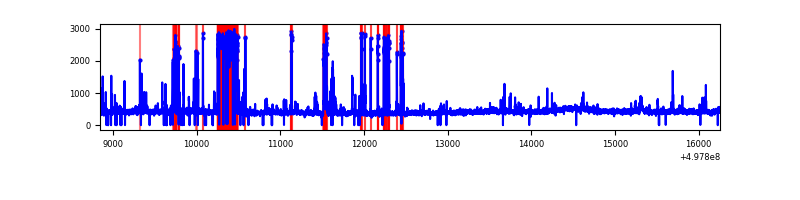 |
| D | 7412 | 7381 | 280 | 280 | 3.78% | 3.79% | 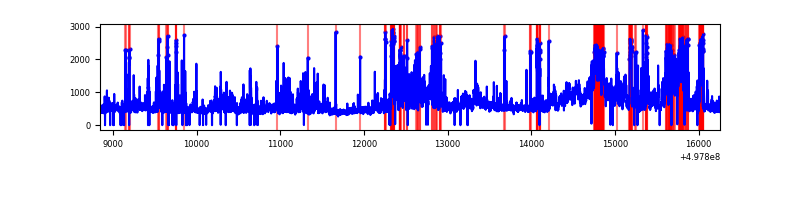 |
Top three noisy pixels from each quadrant. If the there are fewer than three noisy pixels in the level2.evt file, extra rows are filled as -1
| Pixel properties | Quadrant properties | ||||||
|---|---|---|---|---|---|---|---|
| Quadrant | DetID | PixID | Counts | Sigma | Mean | Median | Sigma |
| A | 7 | 29 | 1535713 | 8375.94 | 736 | 718 | 183.3 |
| A | 3 | 130 | 203461 | 1106.3 | 736 | 718 | 183.3 |
| A | 15 | 174 | 44097 | 236.7 | 736 | 718 | 183.3 |
| B | 7 | 0 | 250536 | 1533.92 | 757 | 730 | 162.9 |
| B | 5 | 172 | 205473 | 1257.22 | 757 | 730 | 162.9 |
| B | 10 | 247 | 203707 | 1246.37 | 757 | 730 | 162.9 |
| C | 1 | 241 | 852172 | 4257.83 | 733 | 728 | 200.0 |
| C | 14 | 254 | 84610 | 419.47 | 733 | 728 | 200.0 |
| C | 15 | 189 | 47151 | 232.15 | 733 | 728 | 200.0 |
| D | 8 | 176 | 1054654 | 5084.27 | 735 | 702 | 207.3 |
| D | 2 | 172 | 570682 | 2749.59 | 735 | 702 | 207.3 |
| D | 2 | 153 | 443682 | 2136.94 | 735 | 702 | 207.3 |
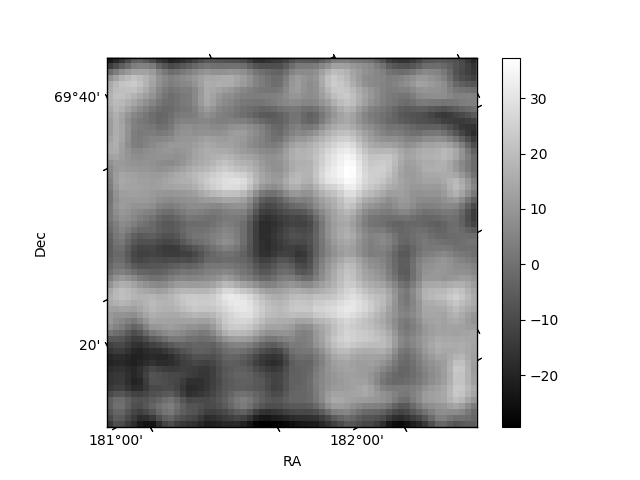
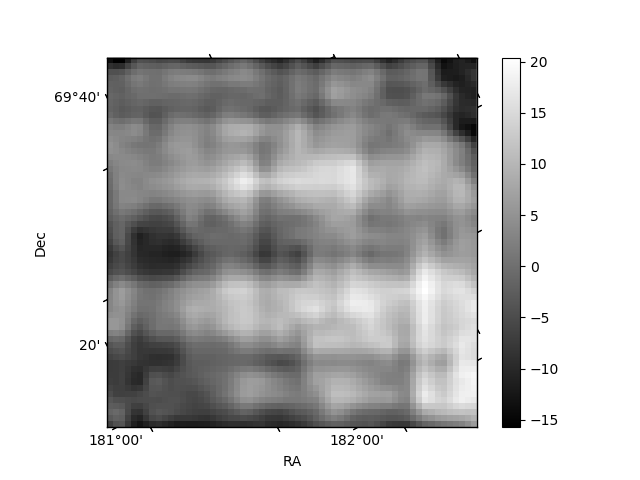
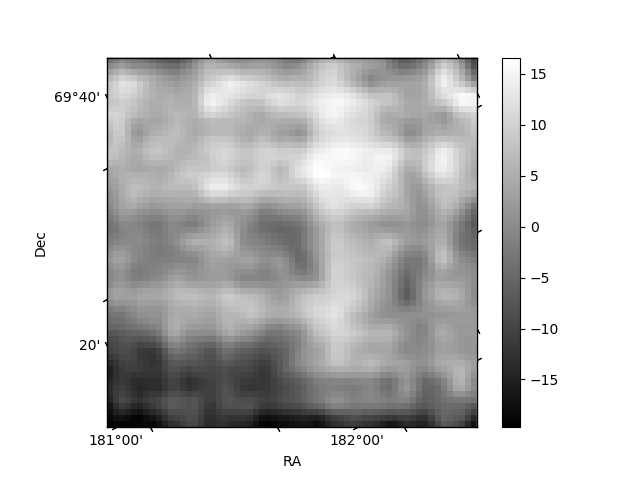
Histogram calculated using DETX and DETY for each event in the final _common_clean file
| Quadrant A | 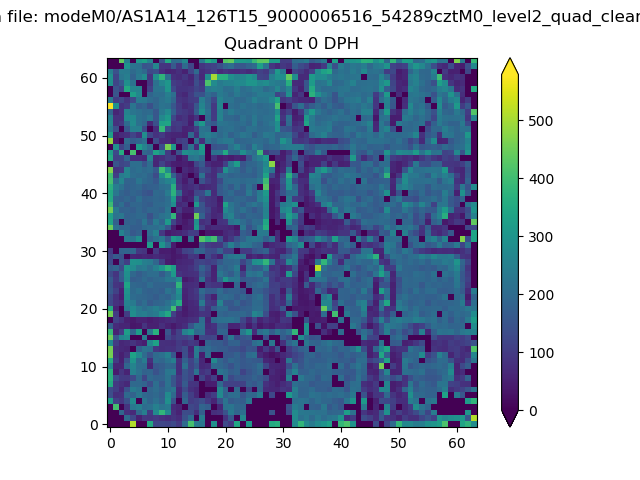 |
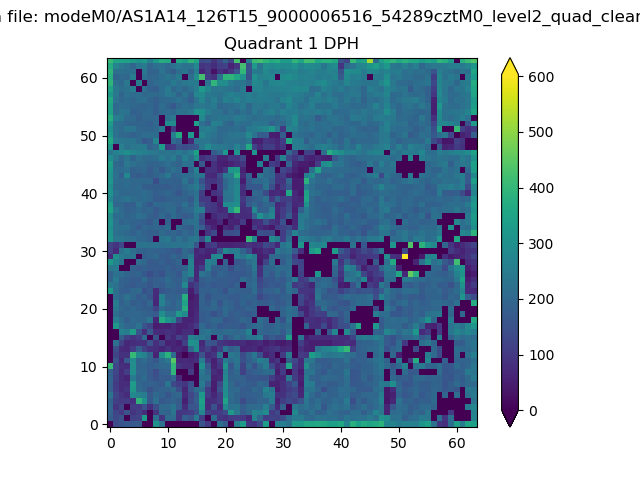 |
Quadrant B |
|---|---|---|---|
| Quadrant D | 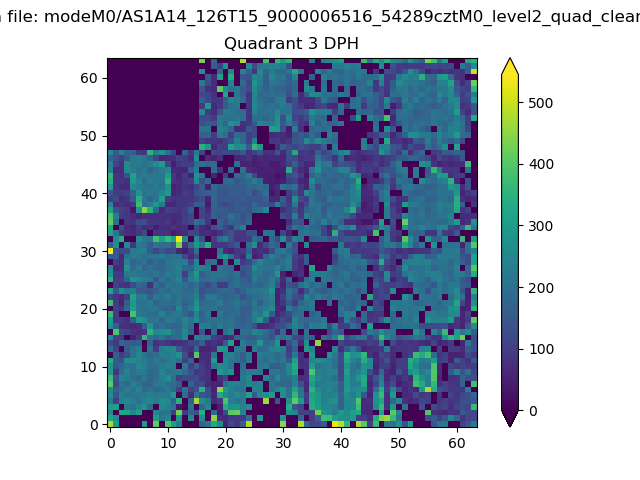 |
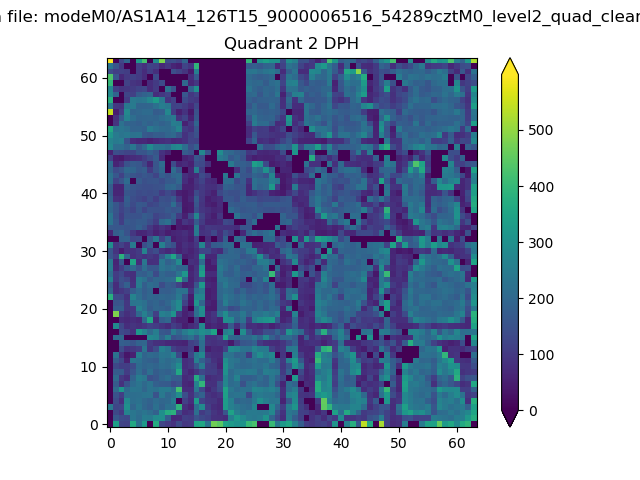 |
Quadrant C |
| Plot type | Count rate plots | Images |
|---|---|---|
| Comparison with Poisson distribution Blue bars denote a histogram of data divided into 1 sec bins. Red curve is a Poisson curve with rate = median count rate of data. |
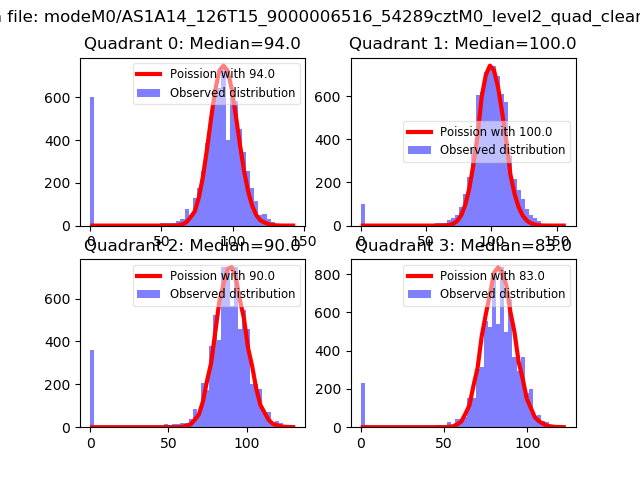 |
 |
| Quadrant-wise count rates Data is divided into 100 sec bins |
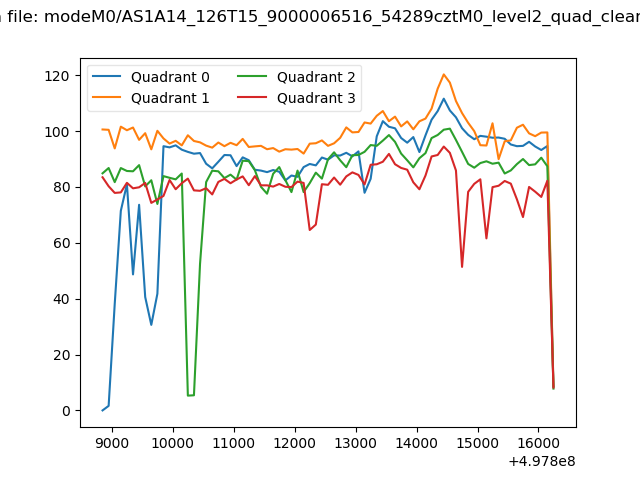 |
|
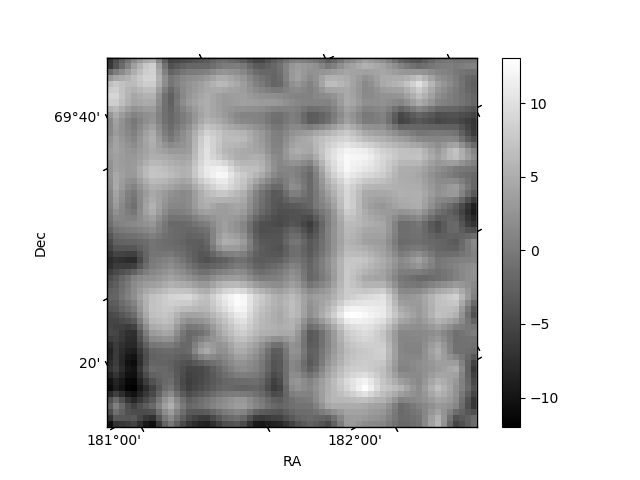
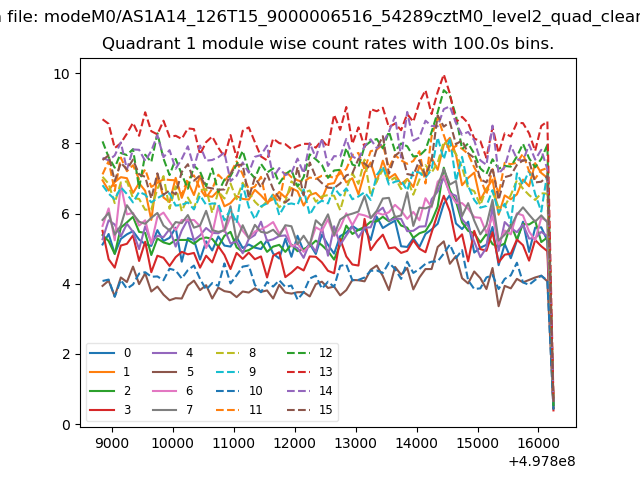
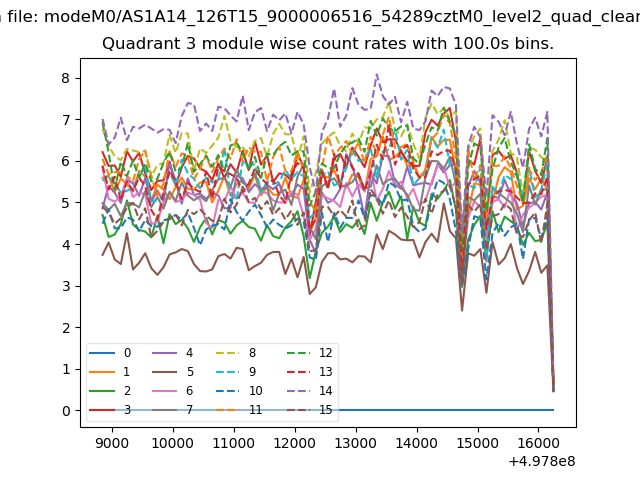
| Module-wise count rates for Quadrant A Data is divided into 100 sec bins |
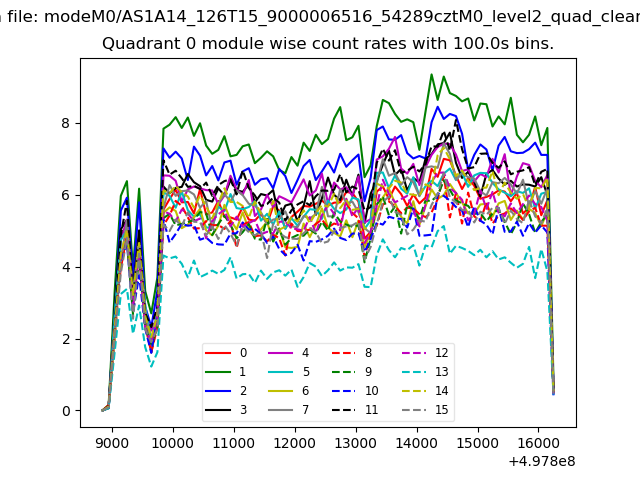 |
 |
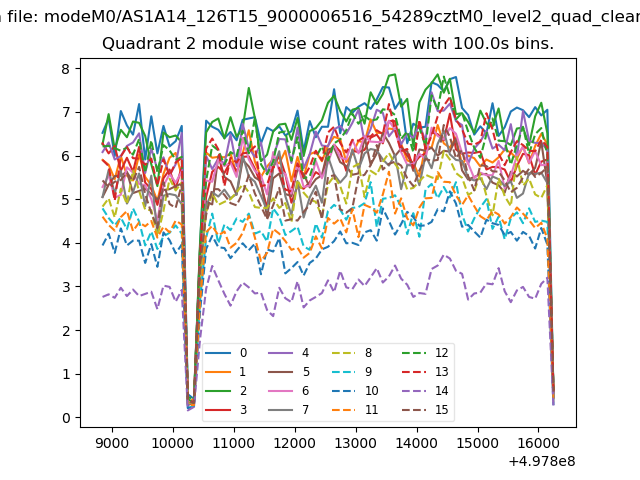
| Module-wise count rates for Quadrant B Data is divided into 100 sec bins |
 |
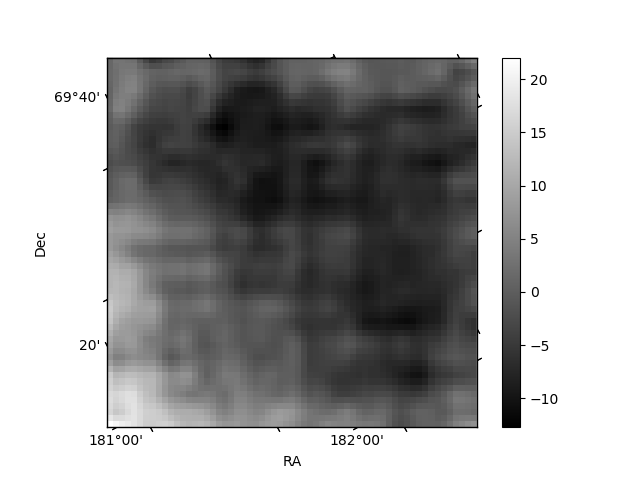 |
| Module-wise count rates for Quadrant C Data is divided into 100 sec bins |
 |
 |
| Module-wise count rates for Quadrant D Data is divided into 100 sec bins |
 |
 |
| Parameter | Plot |
|---|---|
| CZT HV Monitor |  |
| D_VDD | 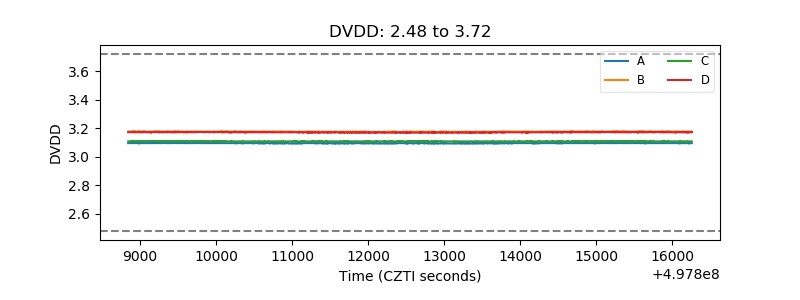 |
| Temperature 1 | 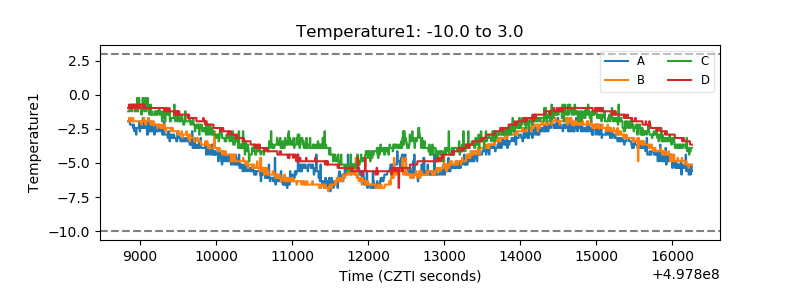 |
| Veto HV Monitor | 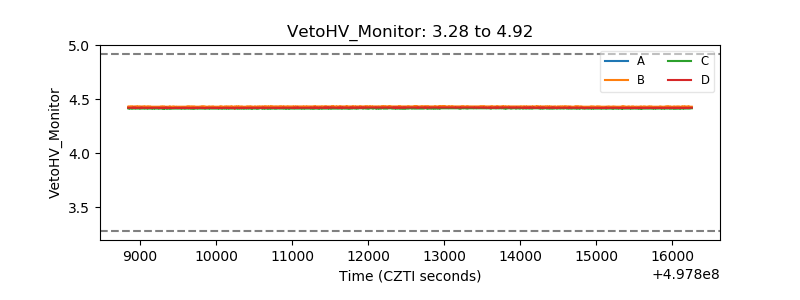 |
| Veto LLD | 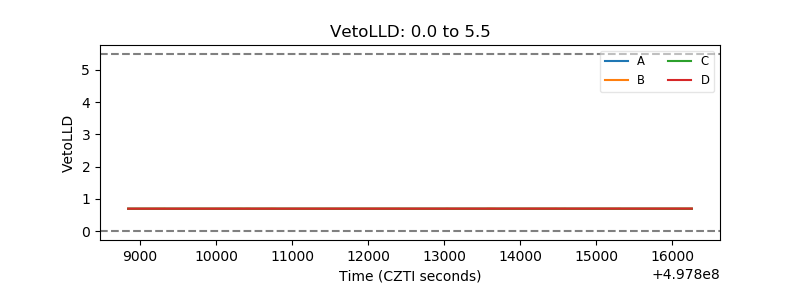 |
| Alpha Counter | 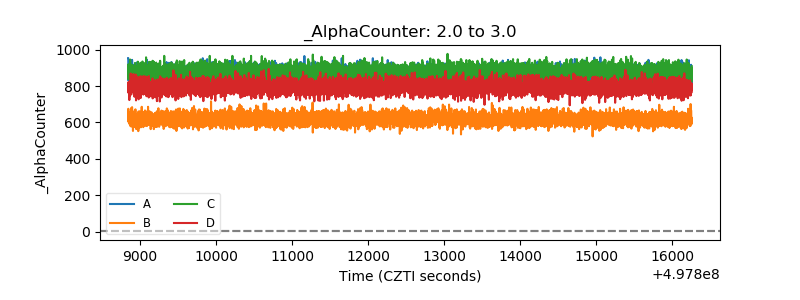 |
| _CPM_Rate | 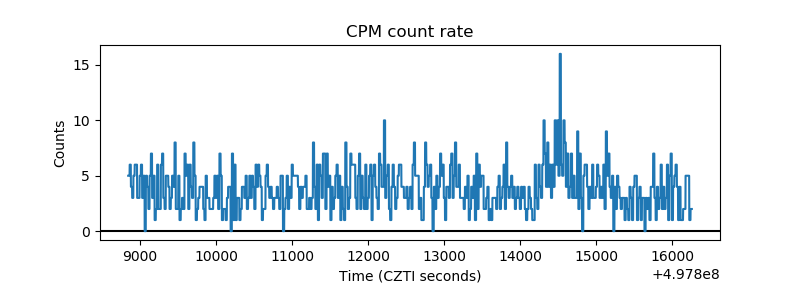 |
| CZT Counter | 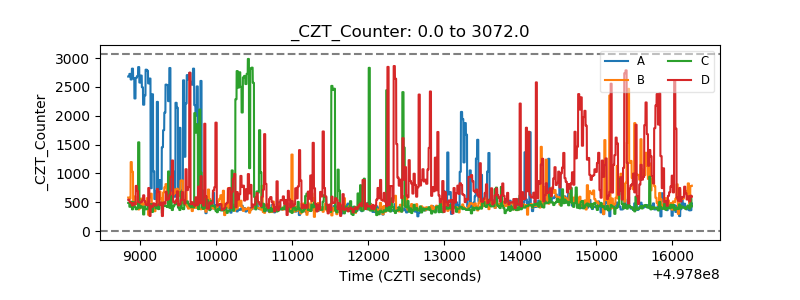 |
| +2.5 Volts monitor | 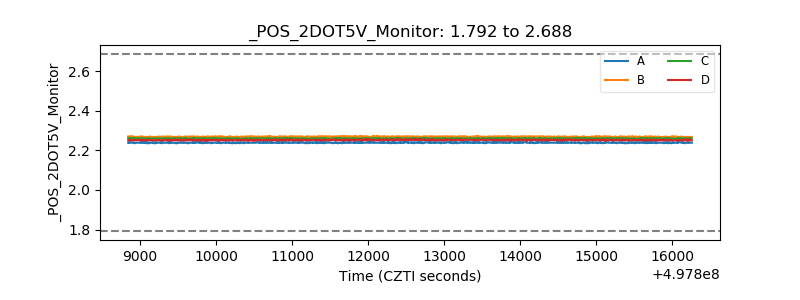 |
| +5 Volts monitor | 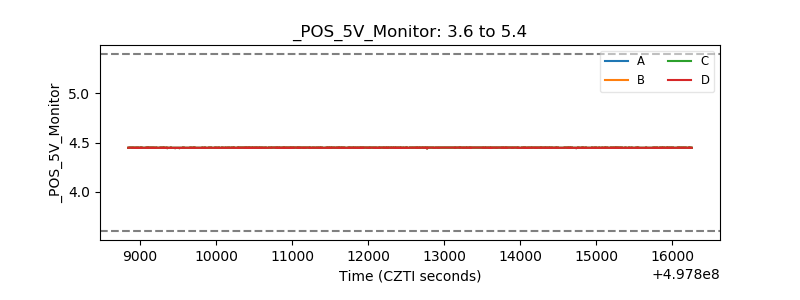 |
| _ROLL_ROT | 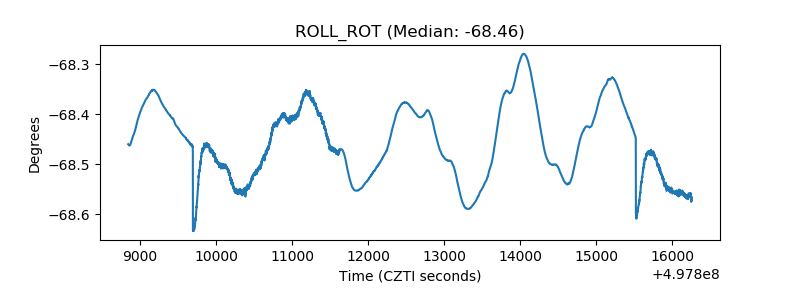 |
| _Roll_DEC | 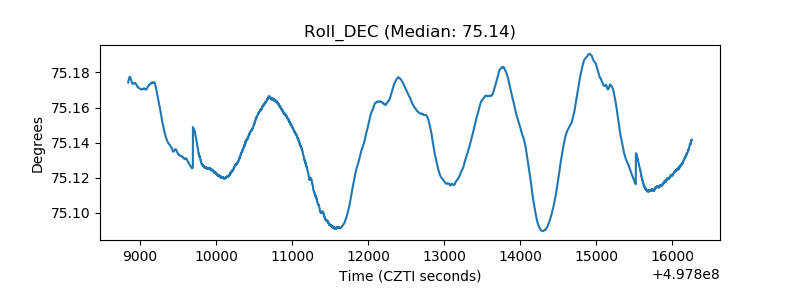 |
| _Roll_RA | 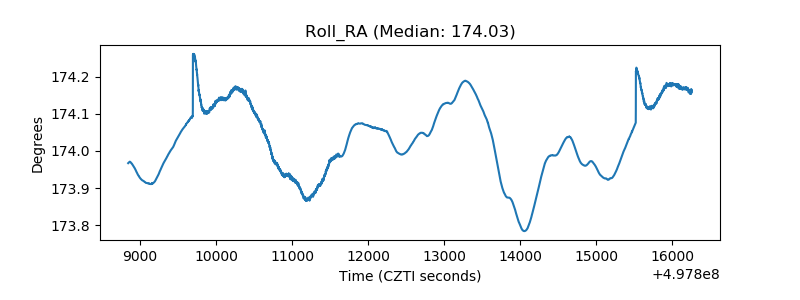 |
| Veto Counter | 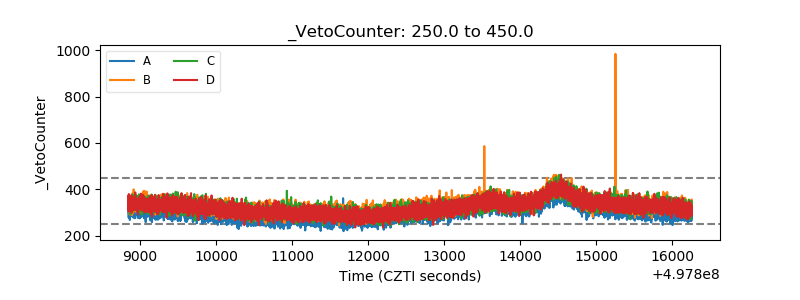 |