| Param | Original file | Final file |
|---|---|---|
| Filename | modeM0/AS1A14_126T15_9000006516_54292cztM0_level2.fits | modeM0/AS1A14_126T15_9000006516_54292cztM0_level2_quad_clean.evt |
| Size (bytes) | 1,651,256,640 | 252,826,560 |
| Size | 1.5 GB | 241.1 MB |
| Events in quadrant A | 10,308,523 | 1,733,942 |
| Events in quadrant B | 10,299,928 | 1,906,148 |
| Events in quadrant C | 12,010,718 | 1,585,950 |
| Events in quadrant D | 27,020,240 | 1,104,770 |
| Mode SS | |||
|---|---|---|---|
| Quadrant | BADHDUFLAG | Total packets | Discarded packets |
| A | 0 | 389 | 0 |
| B | 0 | 389 | 0 |
| C | 0 | 389 | 0 |
| D | 0 | 390 | 0 |
| Mode M0 | |||
|---|---|---|---|
| Quadrant | BADHDUFLAG | Total packets | Discarded packets |
| A | 0 | 45390 | 140 |
| B | 0 | 44504 | 126 |
| C | 0 | 50489 | 301 |
| D | 0 | 94040 | 698 |
| Mode M9 | |||
|---|---|---|---|
| Quadrant | BADHDUFLAG | Total packets | Discarded packets |
| A | 0 | 10 | 0 |
| B | 0 | 10 | 0 |
| C | 0 | 10 | 0 |
| D | 0 | 10 | 0 |
| Quadrant | Total seconds | Saturated seconds | Saturation percentage |
|---|---|---|---|
| A | 19227 | 734 | 3.817548% |
| B | 19230 | 255 | 1.326053% |
| C | 19196 | 1257 | 6.548239% |
| D | 19162 | 5678 | 29.631562% |
Noise dominated data is calculated using 1-second bins in cleaned event files. If a bin has >2000 counts, and if more than 50% of those come from <1% of pixels, then it is considered to be noise-dominated and hence unusable.
| Quadrant | # 1 sec bins | Bins with >0 counts | Bins with >2000 counts | High rate bins dominated by noise | Noise dominated (total time) | Noise dominated (detector-on time) | Marked lightcurve |
|---|---|---|---|---|---|---|---|
| A | 20309 | 19284 | 541 | 541 | 2.66% | 2.81% | 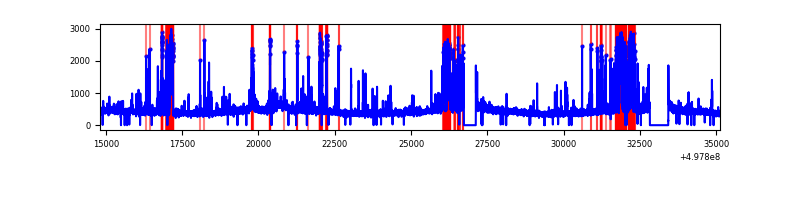 |
| B | 20310 | 19287 | 100 | 100 | 0.49% | 0.52% | 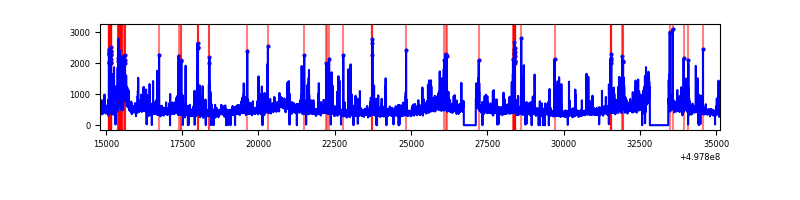 |
| C | 20310 | 19274 | 1250 | 1250 | 6.15% | 6.49% | 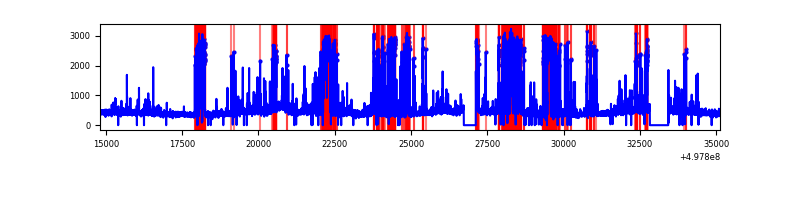 |
| D | 20309 | 19283 | 5745 | 5745 | 28.29% | 29.79% | 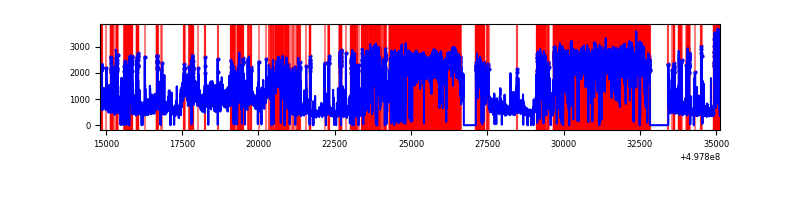 |
Top three noisy pixels from each quadrant. If the there are fewer than three noisy pixels in the level2.evt file, extra rows are filled as -1
| Pixel properties | Quadrant properties | ||||||
|---|---|---|---|---|---|---|---|
| Quadrant | DetID | PixID | Counts | Sigma | Mean | Median | Sigma |
| A | 7 | 29 | 1185241 | 2396.48 | 1994 | 1942 | 493.8 |
| A | 3 | 130 | 536459 | 1082.53 | 1994 | 1942 | 493.8 |
| A | 15 | 174 | 228488 | 458.81 | 1994 | 1942 | 493.8 |
| B | 7 | 0 | 921880 | 2168.13 | 1997 | 1923 | 424.3 |
| B | 10 | 247 | 368724 | 864.47 | 1997 | 1923 | 424.3 |
| B | 5 | 172 | 250204 | 585.14 | 1997 | 1923 | 424.3 |
| C | 1 | 241 | 2556562 | 4858.15 | 1917 | 1895 | 525.9 |
| C | 14 | 254 | 746298 | 1415.61 | 1917 | 1895 | 525.9 |
| C | 12 | 249 | 649728 | 1231.97 | 1917 | 1895 | 525.9 |
| D | 8 | 176 | 16973721 | 34604.48 | 1718 | 1637 | 490.5 |
| D | 2 | 153 | 1379099 | 2808.52 | 1718 | 1637 | 490.5 |
| D | 2 | 172 | 878989 | 1788.84 | 1718 | 1637 | 490.5 |
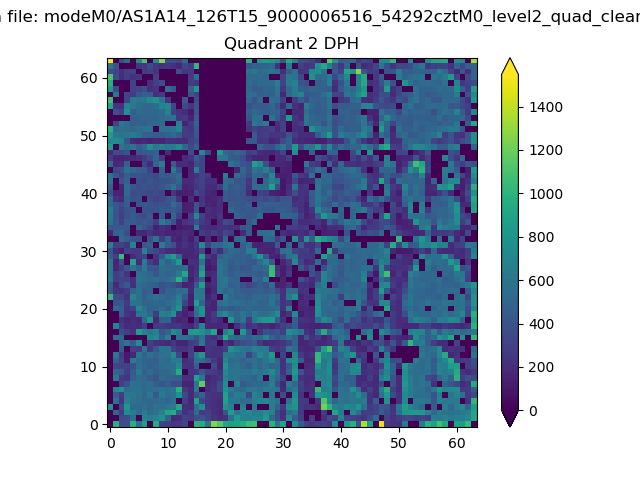
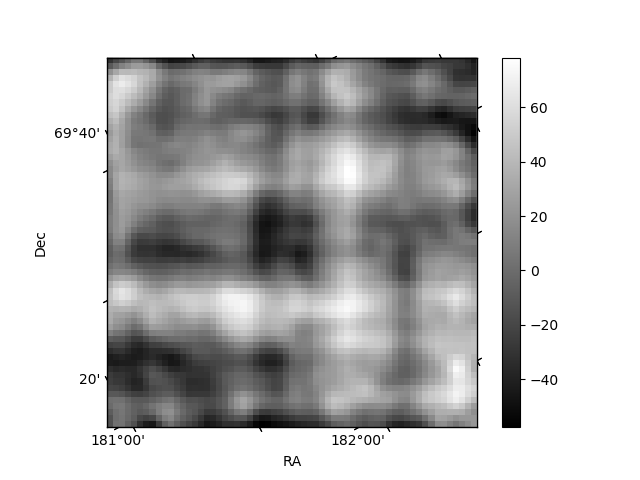
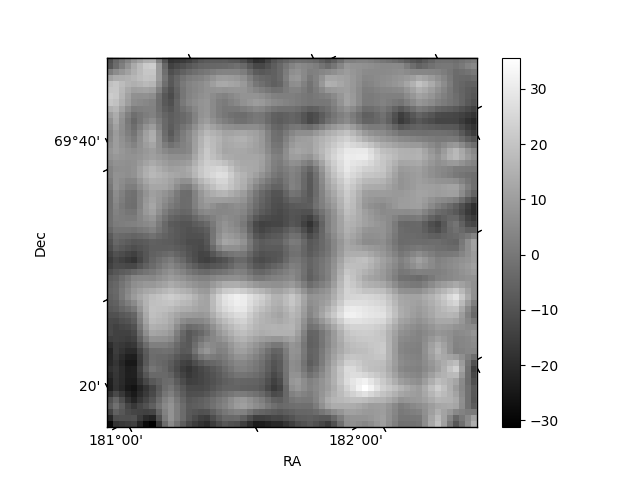
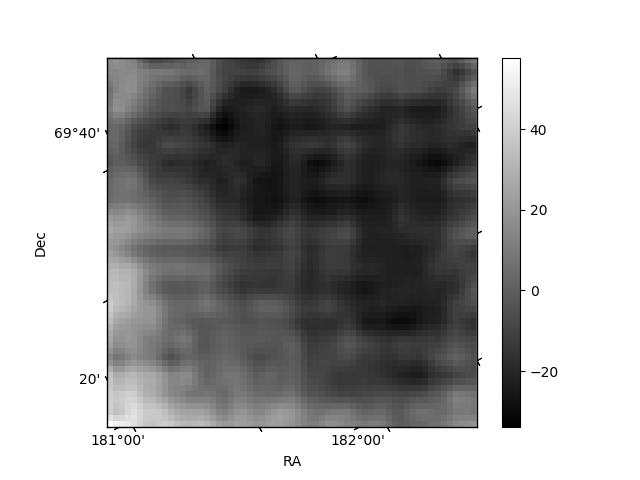
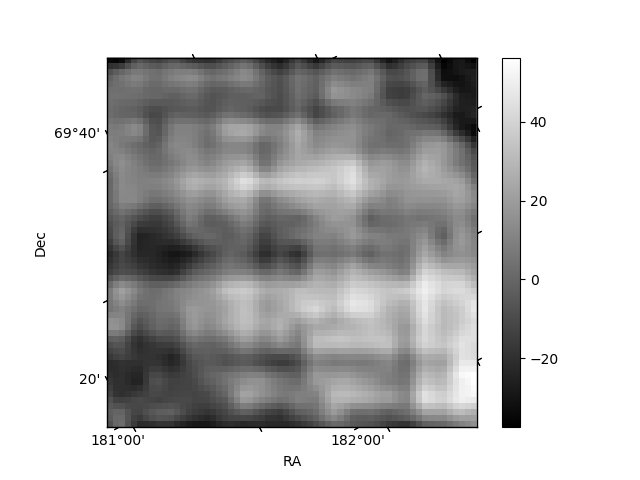
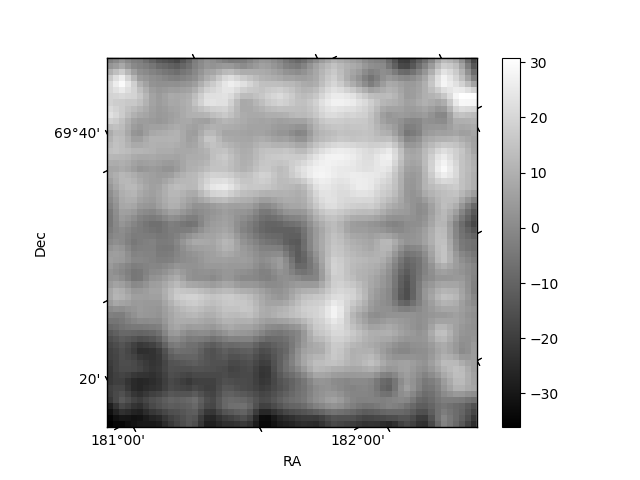
Histogram calculated using DETX and DETY for each event in the final _common_clean file
| Quadrant A | 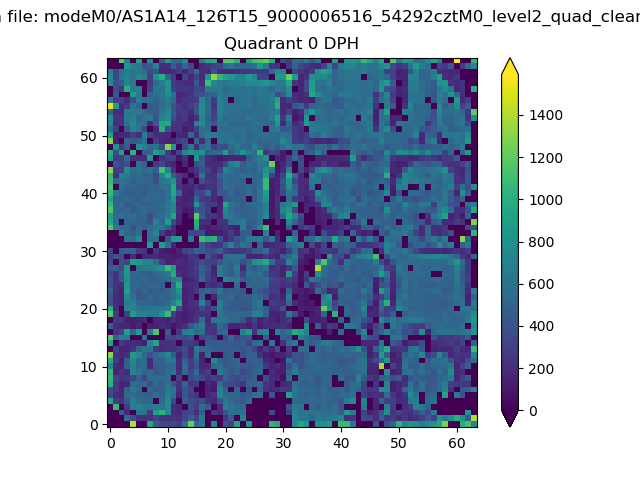 |
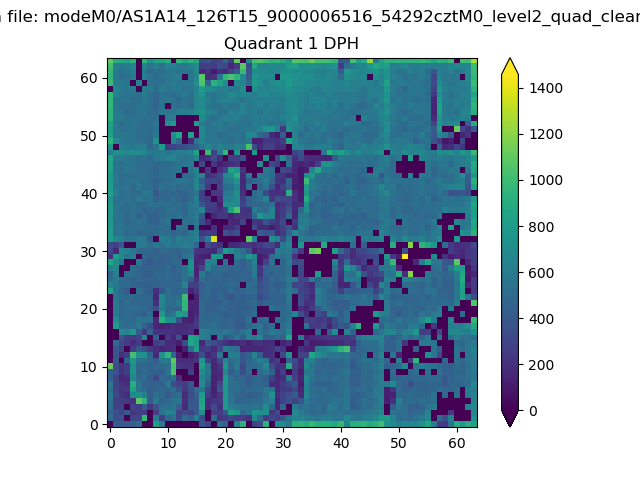 |
Quadrant B |
|---|---|---|---|
| Quadrant D | 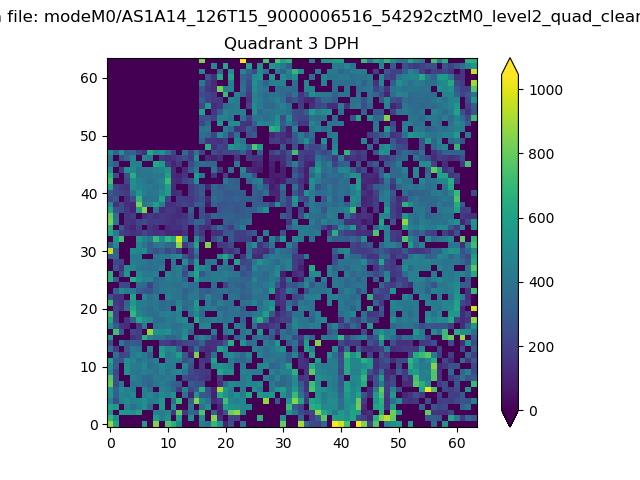 |
 |
Quadrant C |
| Plot type | Count rate plots | Images |
|---|---|---|
| Comparison with Poisson distribution Blue bars denote a histogram of data divided into 1 sec bins. Red curve is a Poisson curve with rate = median count rate of data. |
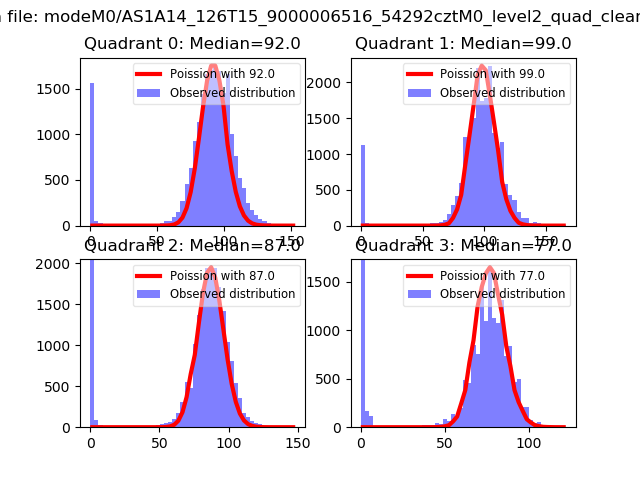 |
 |
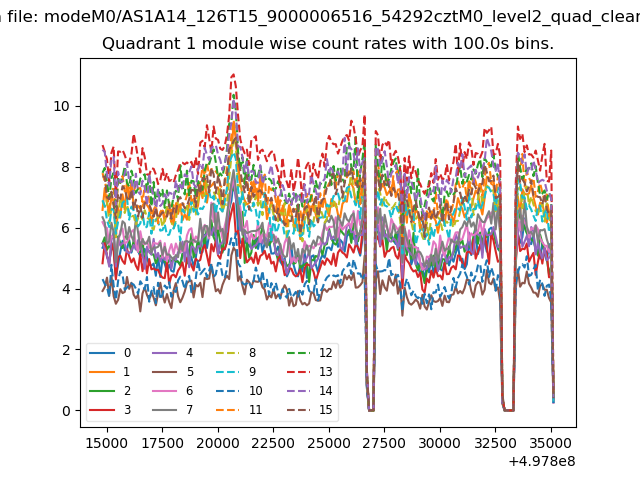
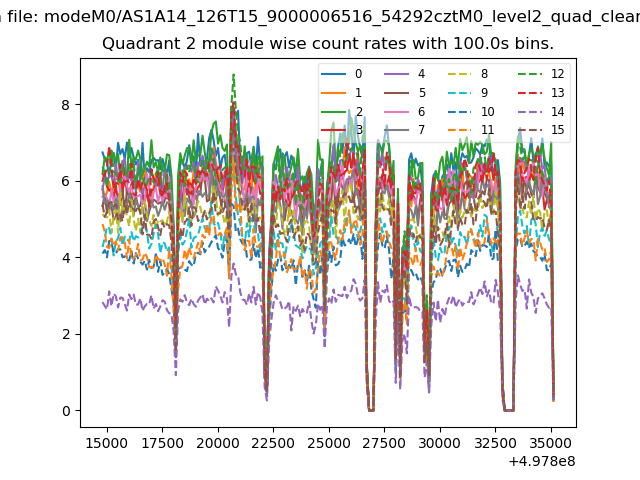
| Quadrant-wise count rates Data is divided into 100 sec bins |
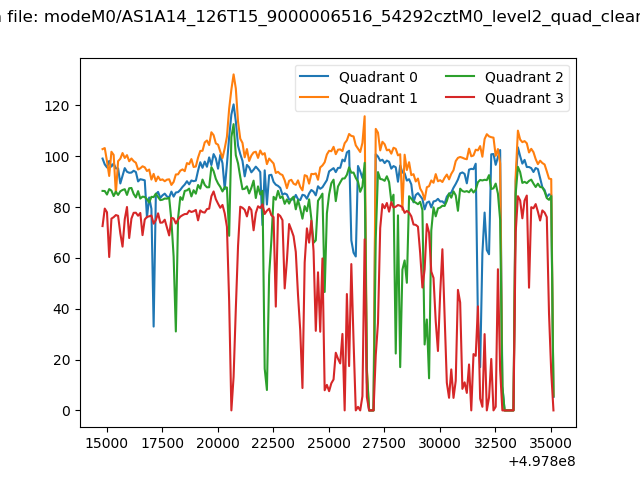 |
|
| Module-wise count rates for Quadrant A Data is divided into 100 sec bins |
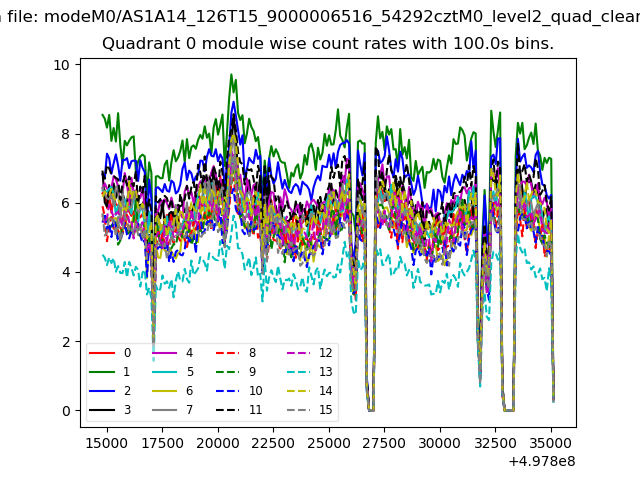 |
 |
| Module-wise count rates for Quadrant B Data is divided into 100 sec bins |
 |
 |
| Module-wise count rates for Quadrant C Data is divided into 100 sec bins |
 |
 |
| Module-wise count rates for Quadrant D Data is divided into 100 sec bins |
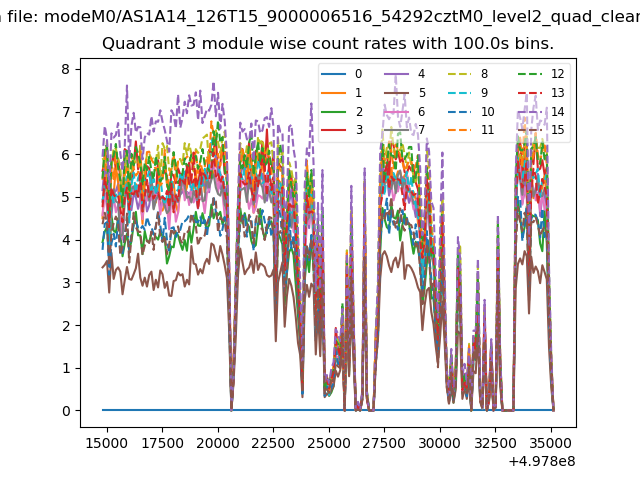 |
 |
| Parameter | Plot |
|---|---|
| CZT HV Monitor | 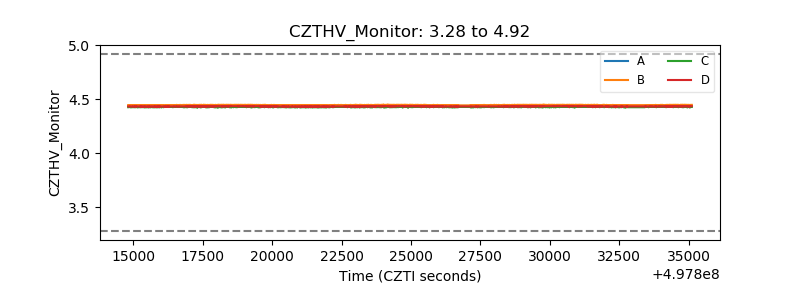 |
| D_VDD | 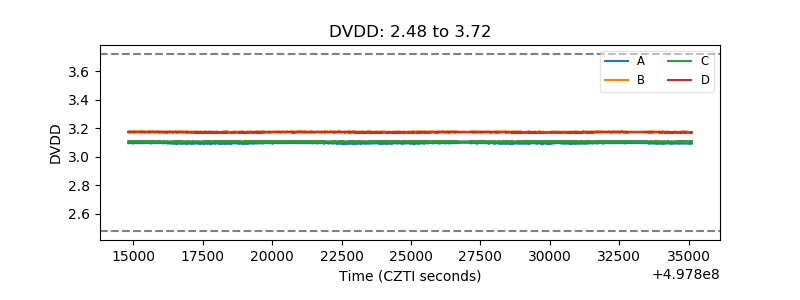 |
| Temperature 1 | 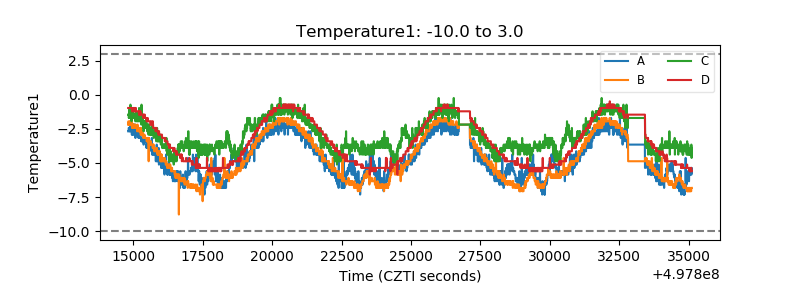 |
| Veto HV Monitor | 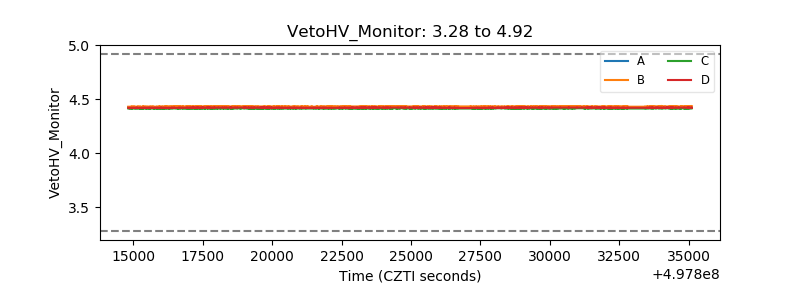 |
| Veto LLD | 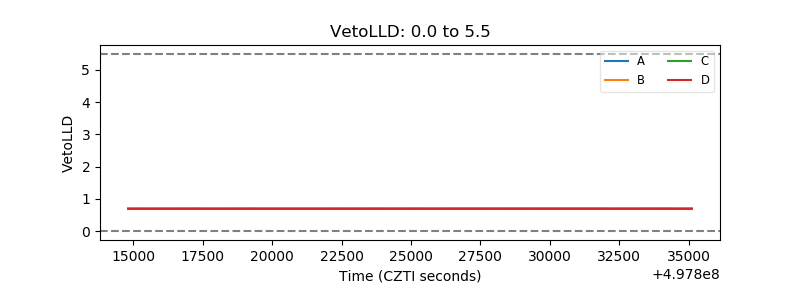 |
| Alpha Counter | 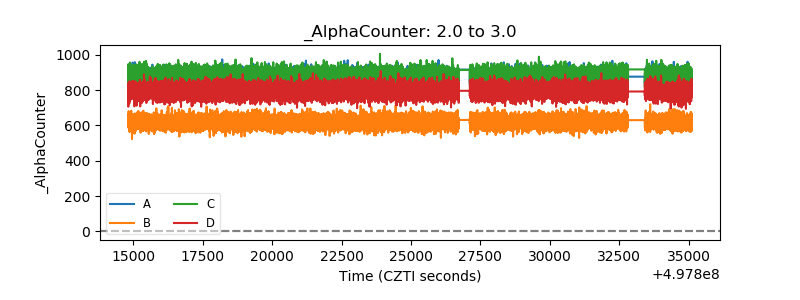 |
| _CPM_Rate | 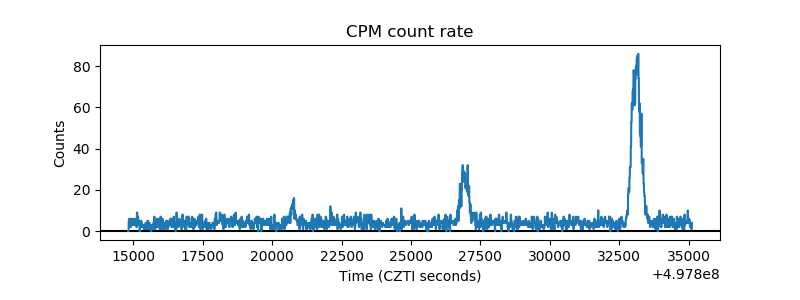 |
| CZT Counter | 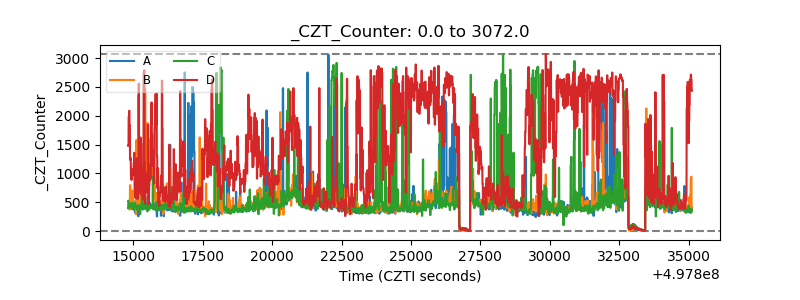 |
| +2.5 Volts monitor |  |
| +5 Volts monitor |  |
| _ROLL_ROT | 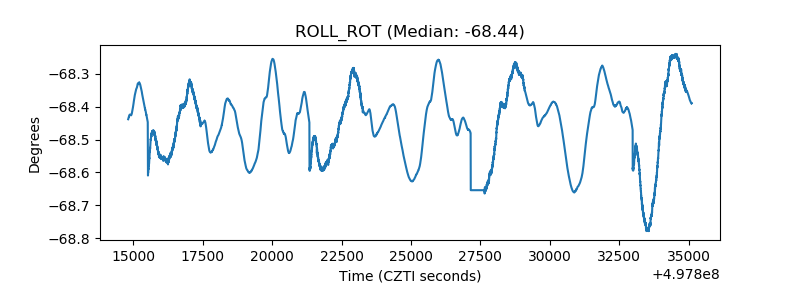 |
| _Roll_DEC | 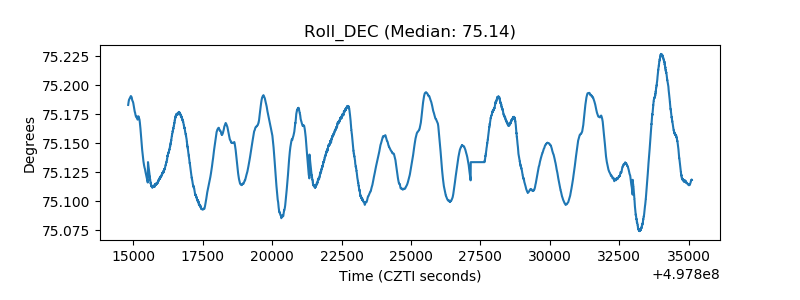 |
| _Roll_RA | 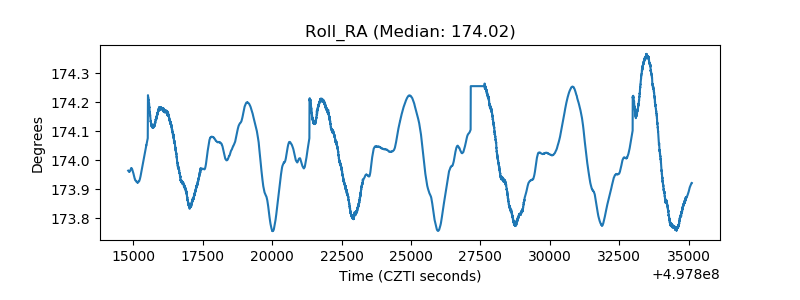 |
| Veto Counter | 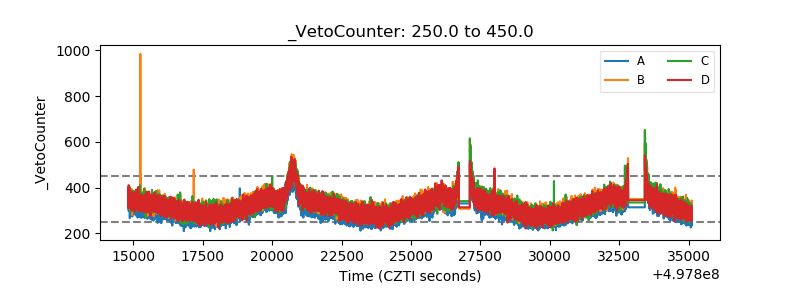 |