| Param | Original file | Final file |
|---|---|---|
| Filename | modeM0/AS1A14_126T15_9000006516_54293cztM0_level2.fits | modeM0/AS1A14_126T15_9000006516_54293cztM0_level2_quad_clean.evt |
| Size (bytes) | 582,341,760 | 98,576,640 |
| Size | 555.4 MB | 94.0 MB |
| Events in quadrant A | 3,170,148 | 678,929 |
| Events in quadrant B | 3,691,673 | 722,357 |
| Events in quadrant C | 3,747,530 | 646,698 |
| Events in quadrant D | 10,383,543 | 431,448 |
| Mode SS | |||
|---|---|---|---|
| Quadrant | BADHDUFLAG | Total packets | Discarded packets |
| A | 0 | 150 | 0 |
| B | 0 | 150 | 0 |
| C | 0 | 150 | 0 |
| D | 0 | 150 | 0 |
| Mode M0 | |||
|---|---|---|---|
| Quadrant | BADHDUFLAG | Total packets | Discarded packets |
| A | 0 | 14956 | 2 |
| B | 0 | 16252 | 2 |
| C | 0 | 16625 | 2 |
| D | 0 | 35815 | 27 |
| Mode M9 | |||
|---|---|---|---|
| Quadrant | BADHDUFLAG | Total packets | Discarded packets |
| A | 0 | 14 | 0 |
| B | 0 | 14 | 0 |
| C | 0 | 14 | 0 |
| D | 0 | 14 | 0 |
| Quadrant | Total seconds | Saturated seconds | Saturation percentage |
|---|---|---|---|
| A | 7252 | 34 | 0.468836% |
| B | 7252 | 102 | 1.406509% |
| C | 7253 | 119 | 1.640700% |
| D | 7248 | 2417 | 33.347130% |
Noise dominated data is calculated using 1-second bins in cleaned event files. If a bin has >2000 counts, and if more than 50% of those come from <1% of pixels, then it is considered to be noise-dominated and hence unusable.
| Quadrant | # 1 sec bins | Bins with >0 counts | Bins with >2000 counts | High rate bins dominated by noise | Noise dominated (total time) | Noise dominated (detector-on time) | Marked lightcurve |
|---|---|---|---|---|---|---|---|
| A | 8672 | 7254 | 11 | 11 | 0.13% | 0.15% | 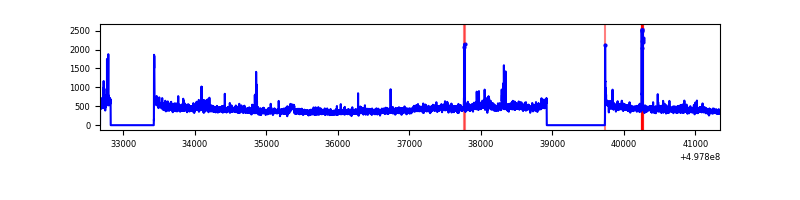 |
| B | 8672 | 7254 | 29 | 29 | 0.33% | 0.40% | 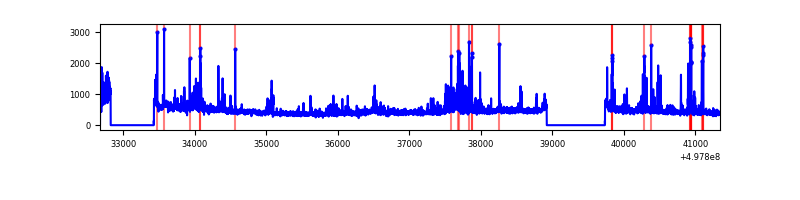 |
| C | 8673 | 7255 | 104 | 104 | 1.20% | 1.43% | 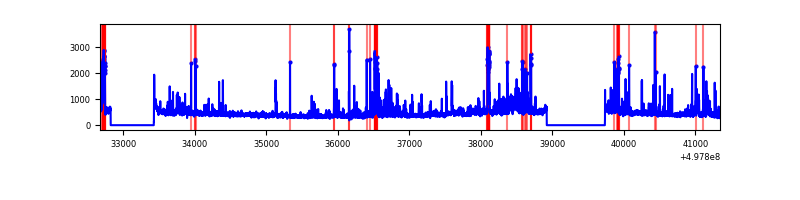 |
| D | 8672 | 7253 | 2338 | 2338 | 26.96% | 32.23% | 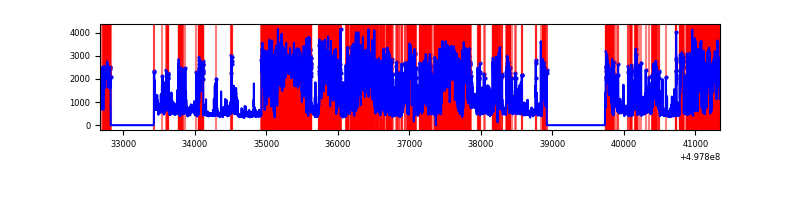 |
Top three noisy pixels from each quadrant. If the there are fewer than three noisy pixels in the level2.evt file, extra rows are filled as -1
| Pixel properties | Quadrant properties | ||||||
|---|---|---|---|---|---|---|---|
| Quadrant | DetID | PixID | Counts | Sigma | Mean | Median | Sigma |
| A | 10 | 253 | 51565 | 271.24 | 761 | 743 | 187.4 |
| A | 15 | 174 | 41795 | 219.09 | 761 | 743 | 187.4 |
| A | 12 | 17 | 26048 | 135.05 | 761 | 743 | 187.4 |
| B | 7 | 0 | 240827 | 1481.06 | 753 | 725 | 162.1 |
| B | 0 | 213 | 110993 | 680.18 | 753 | 725 | 162.1 |
| B | 5 | 185 | 96516 | 590.88 | 753 | 725 | 162.1 |
| C | 14 | 254 | 565092 | 2741.15 | 743 | 736 | 205.9 |
| C | 12 | 252 | 67701 | 325.26 | 743 | 736 | 205.9 |
| C | 15 | 189 | 39946 | 190.45 | 743 | 736 | 205.9 |
| D | 8 | 176 | 6102894 | 34576.33 | 621 | 594 | 176.5 |
| D | 2 | 153 | 1101234 | 6236.35 | 621 | 594 | 176.5 |
| D | 2 | 172 | 350158 | 1980.67 | 621 | 594 | 176.5 |
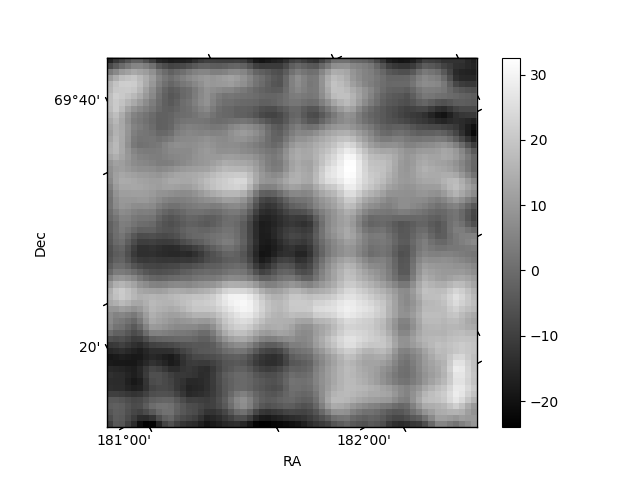
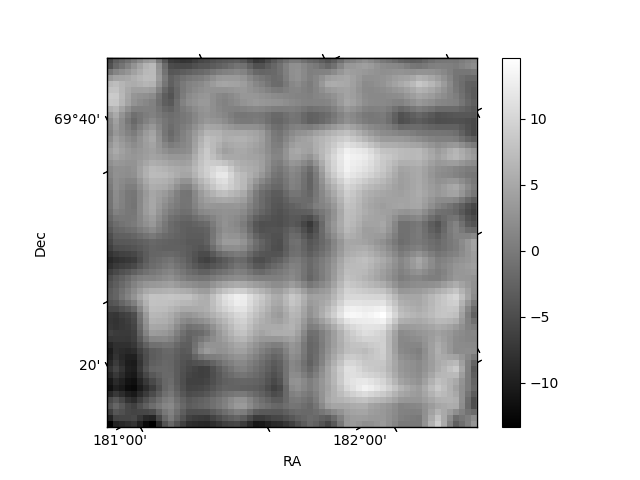
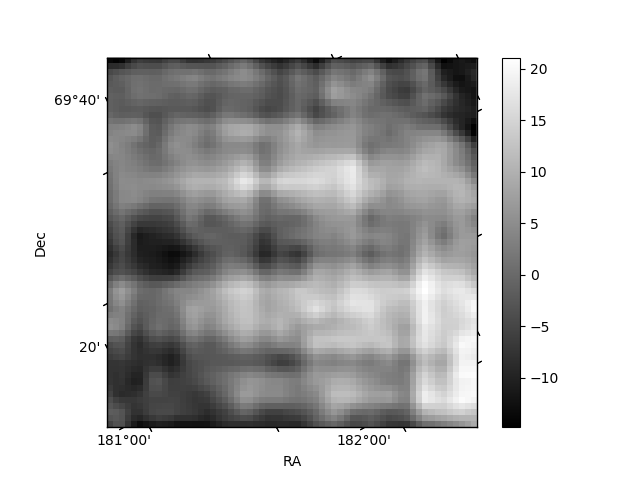
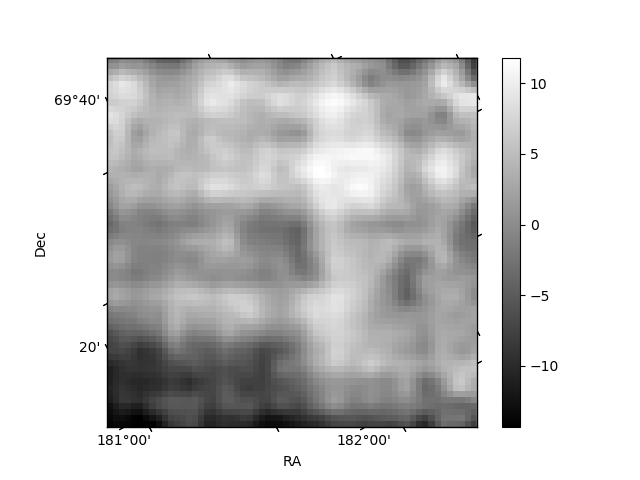
Histogram calculated using DETX and DETY for each event in the final _common_clean file
| Quadrant A | 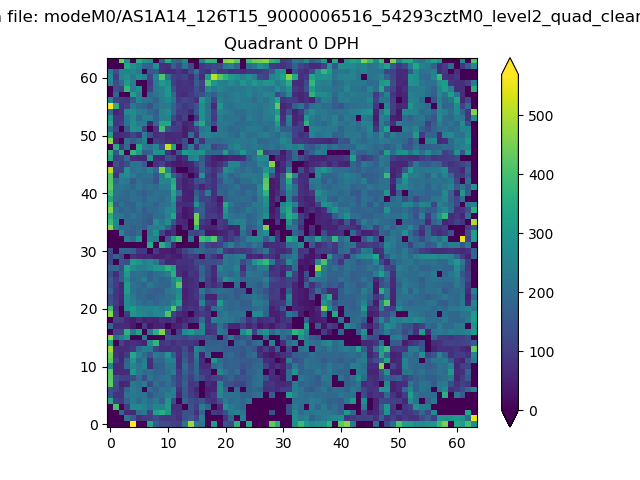 |
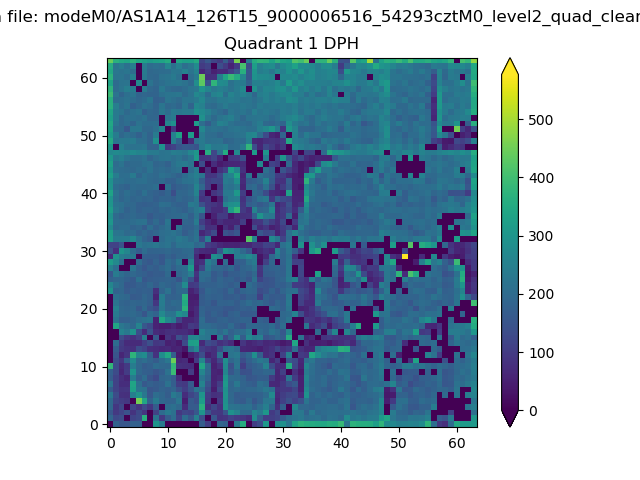 |
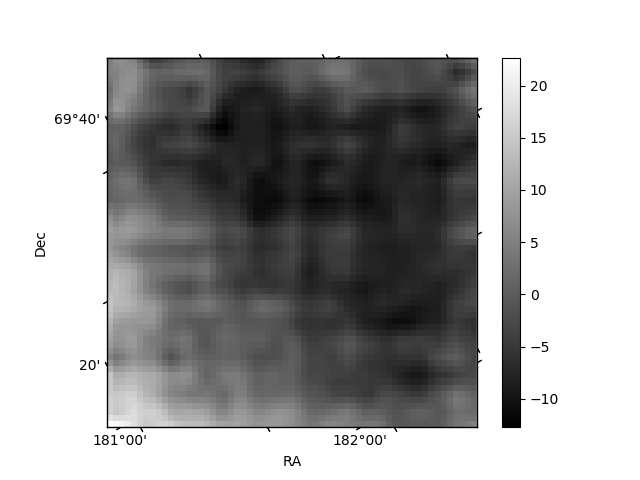
Quadrant B |
|---|---|---|---|
| Quadrant D | 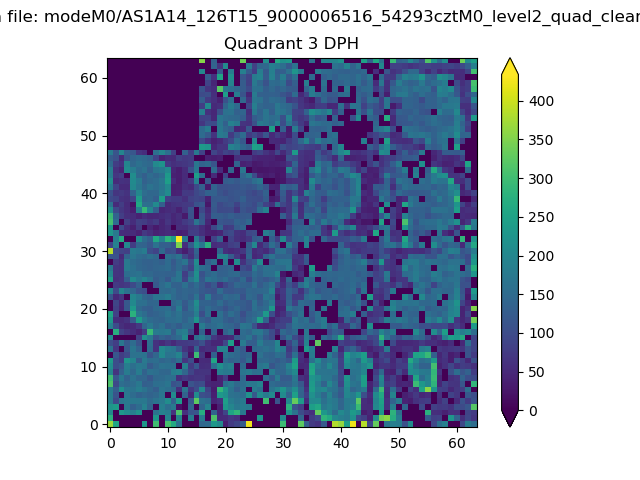 |
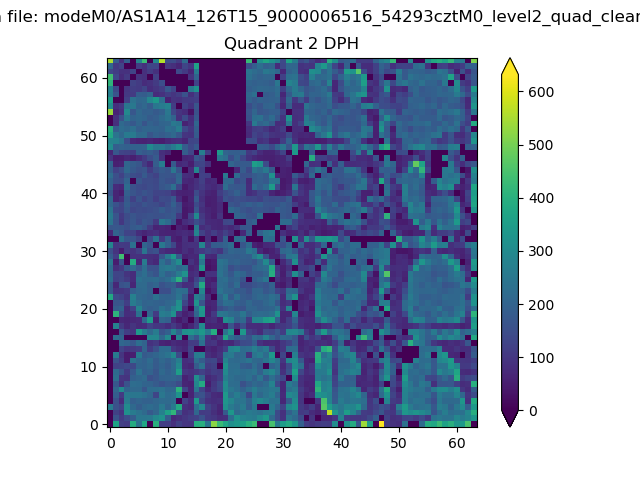 |
Quadrant C |
| Plot type | Count rate plots | Images |
|---|---|---|
| Comparison with Poisson distribution Blue bars denote a histogram of data divided into 1 sec bins. Red curve is a Poisson curve with rate = median count rate of data. |
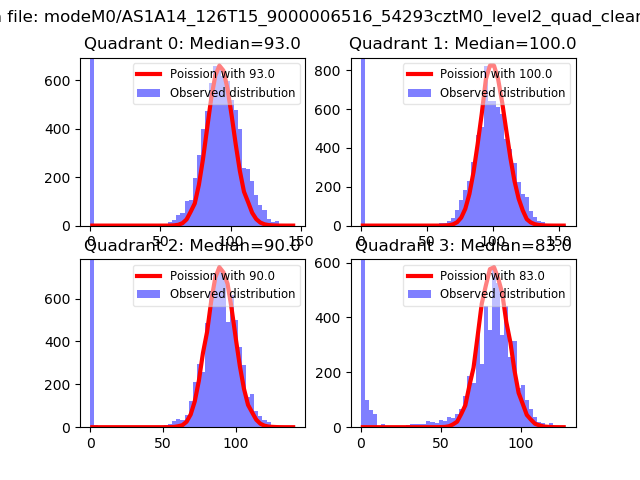 |
 |
| Quadrant-wise count rates Data is divided into 100 sec bins |
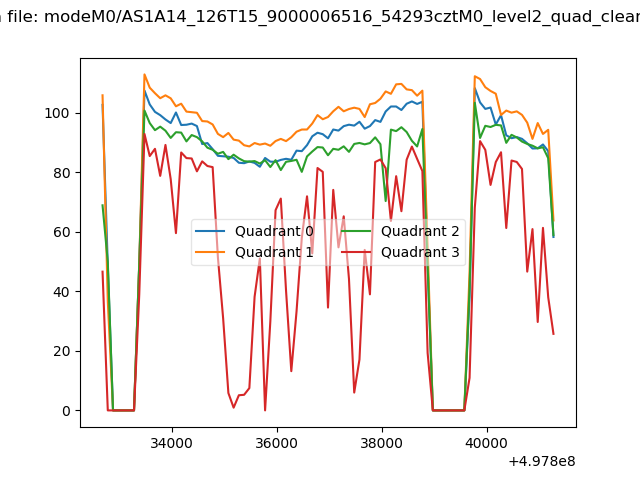 |
|
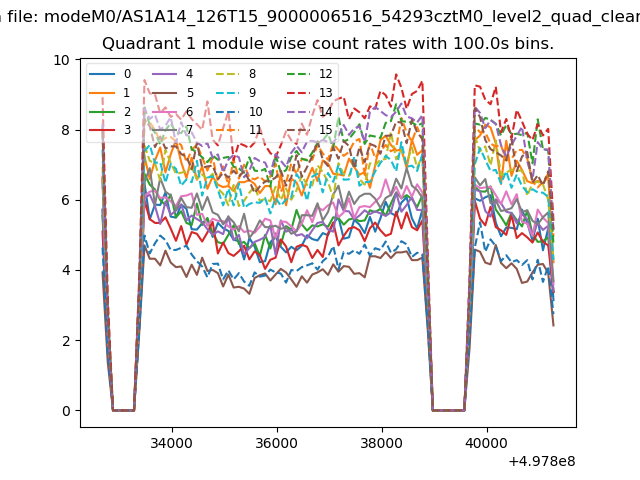
| Module-wise count rates for Quadrant A Data is divided into 100 sec bins |
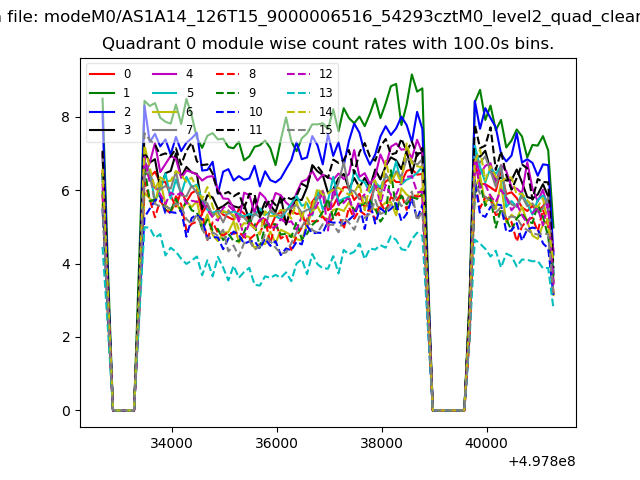 |
 |
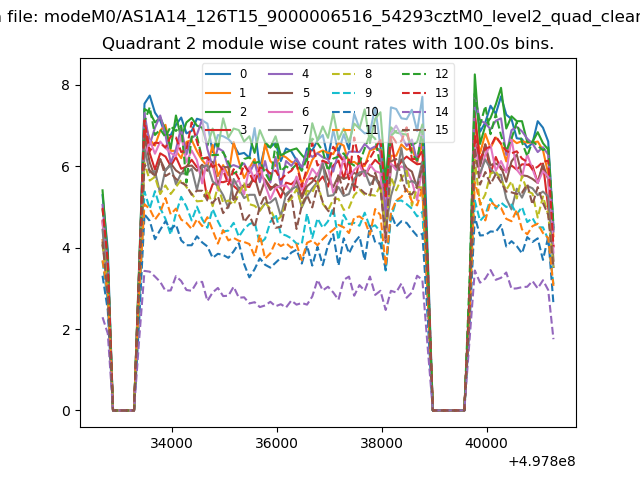
| Module-wise count rates for Quadrant B Data is divided into 100 sec bins |
 |
 |
| Module-wise count rates for Quadrant C Data is divided into 100 sec bins |
 |
 |
| Module-wise count rates for Quadrant D Data is divided into 100 sec bins |
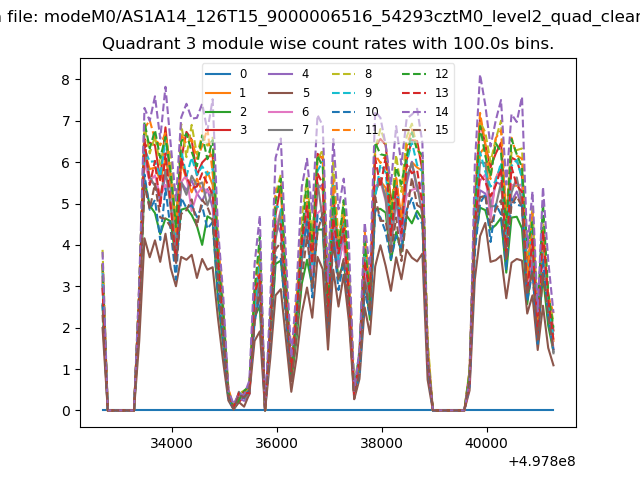 |
 |
| Parameter | Plot |
|---|---|
| CZT HV Monitor | 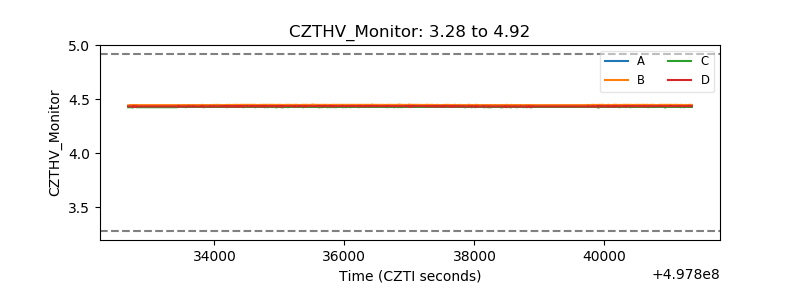 |
| D_VDD | 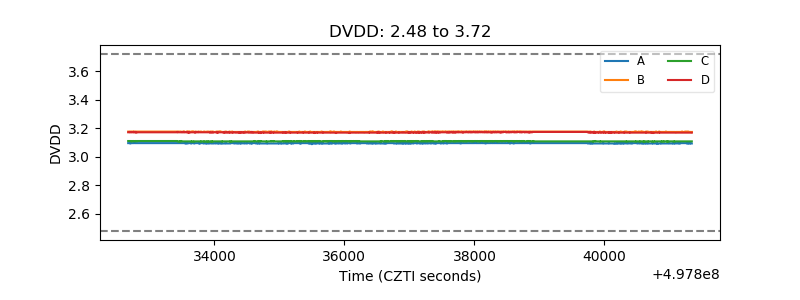 |
| Temperature 1 | 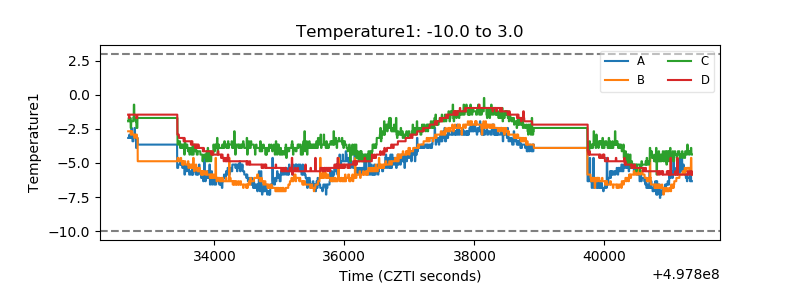 |
| Veto HV Monitor |  |
| Veto LLD | 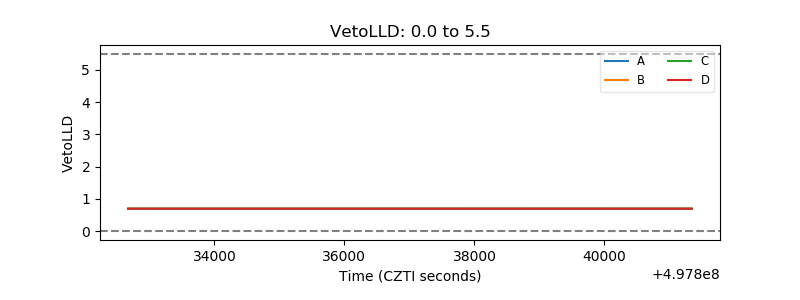 |
| Alpha Counter | 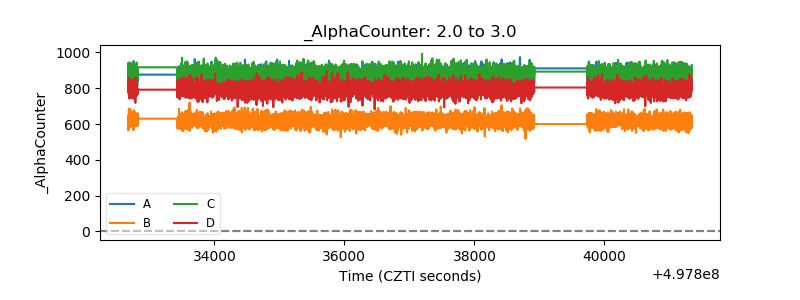 |
| _CPM_Rate | 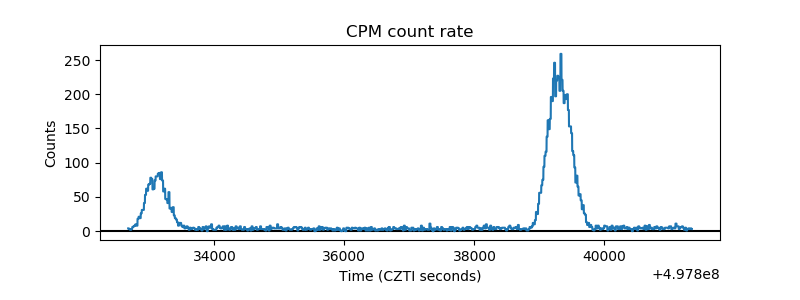 |
| CZT Counter | 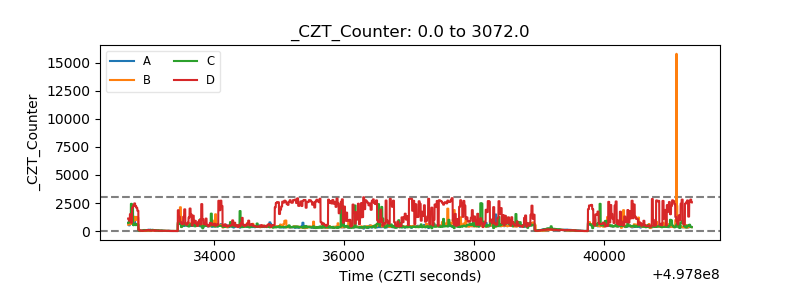 |
| +2.5 Volts monitor | 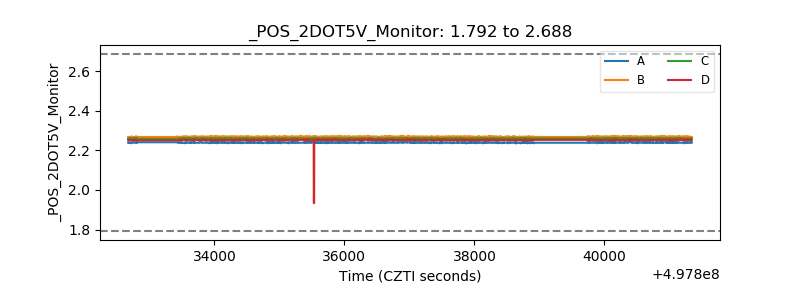 |
| +5 Volts monitor | 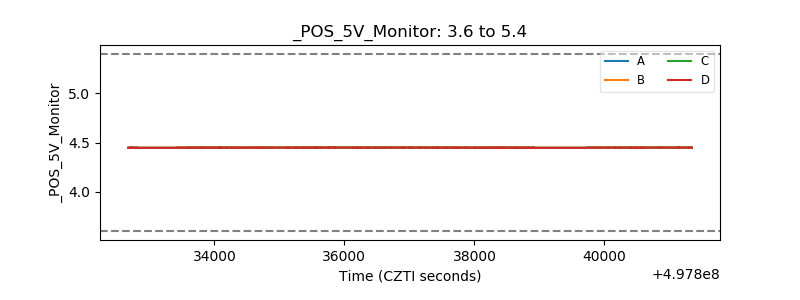 |
| _ROLL_ROT | 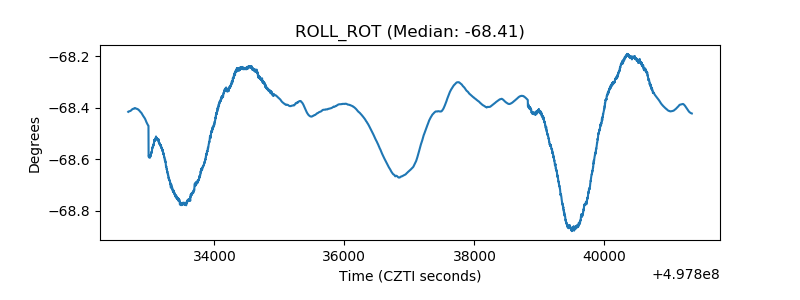 |
| _Roll_DEC | 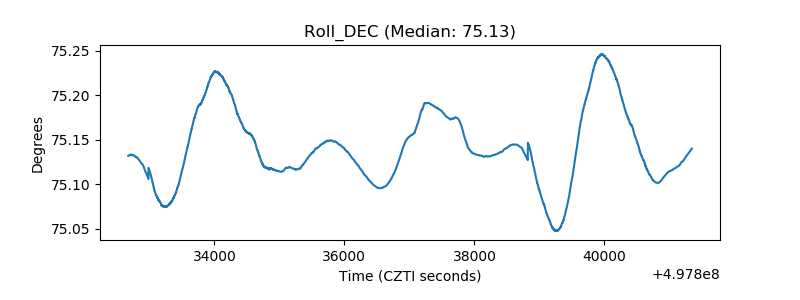 |
| _Roll_RA | 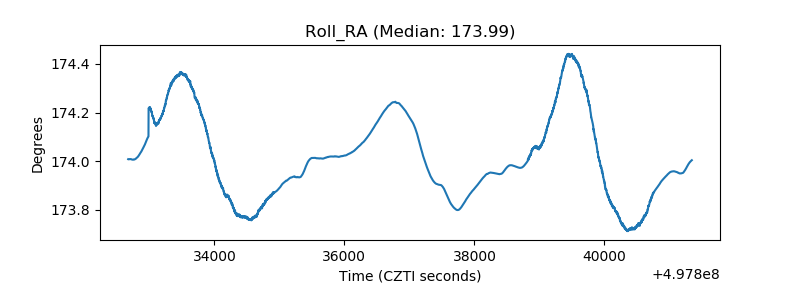 |
| Veto Counter | 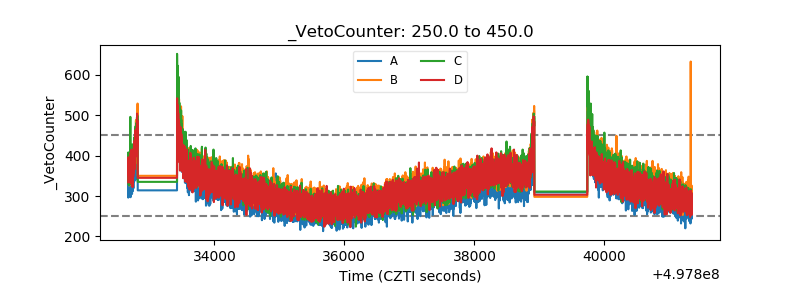 |