| Param | Original file | Final file |
|---|---|---|
| Filename | modeM0/AS1A14_126T15_9000006516_54296cztM0_level2.fits | modeM0/AS1A14_126T15_9000006516_54296cztM0_level2_quad_clean.evt |
| Size (bytes) | 636,603,840 | 83,442,240 |
| Size | 607.1 MB | 79.6 MB |
| Events in quadrant A | 2,924,466 | 615,260 |
| Events in quadrant B | 3,176,449 | 666,256 |
| Events in quadrant C | 6,332,731 | 478,747 |
| Events in quadrant D | 10,630,838 | 317,123 |
| Mode SS | |||
|---|---|---|---|
| Quadrant | BADHDUFLAG | Total packets | Discarded packets |
| A | 0 | 130 | 0 |
| B | 0 | 130 | 0 |
| C | 0 | 130 | 0 |
| D | 0 | 130 | 0 |
| Mode M0 | |||
|---|---|---|---|
| Quadrant | BADHDUFLAG | Total packets | Discarded packets |
| A | 0 | 13664 | 1 |
| B | 0 | 13948 | 1 |
| C | 0 | 23565 | 2 |
| D | 0 | 35949 | 1 |
| Mode M9 | |||
|---|---|---|---|
| Quadrant | BADHDUFLAG | Total packets | Discarded packets |
| A | 0 | 11 | 0 |
| B | 0 | 11 | 0 |
| C | 0 | 11 | 0 |
| D | 0 | 11 | 0 |
| Quadrant | Total seconds | Saturated seconds | Saturation percentage |
|---|---|---|---|
| A | 6439 | 91 | 1.413263% |
| B | 6439 | 61 | 0.947352% |
| C | 6438 | 1341 | 20.829450% |
| D | 6438 | 3083 | 47.887543% |
Noise dominated data is calculated using 1-second bins in cleaned event files. If a bin has >2000 counts, and if more than 50% of those come from <1% of pixels, then it is considered to be noise-dominated and hence unusable.
| Quadrant | # 1 sec bins | Bins with >0 counts | Bins with >2000 counts | High rate bins dominated by noise | Noise dominated (total time) | Noise dominated (detector-on time) | Marked lightcurve |
|---|---|---|---|---|---|---|---|
| A | 7499 | 6440 | 63 | 63 | 0.84% | 0.98% | 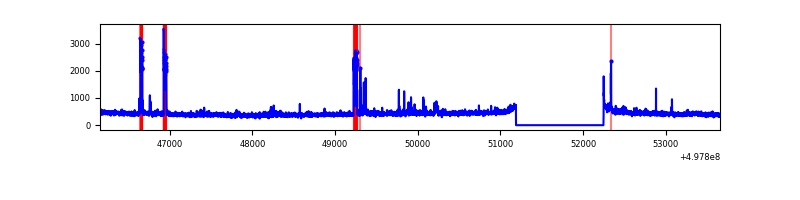 |
| B | 7499 | 6440 | 10 | 10 | 0.13% | 0.16% | 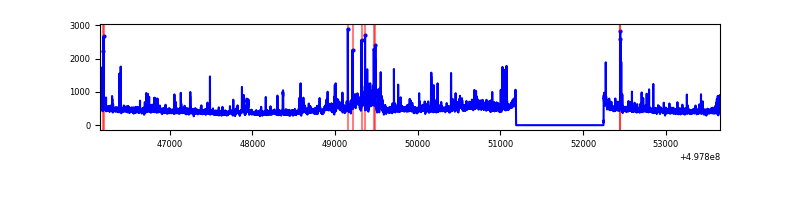 |
| C | 7498 | 6439 | 1336 | 1336 | 17.82% | 20.75% | 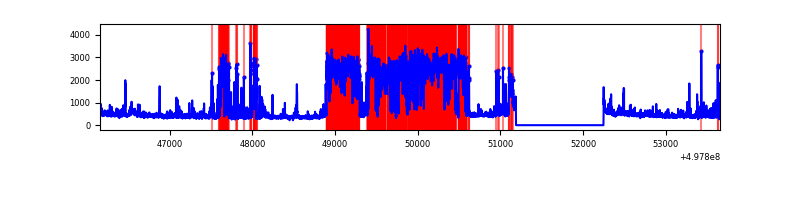 |
| D | 7498 | 6439 | 2536 | 2536 | 33.82% | 39.38% | 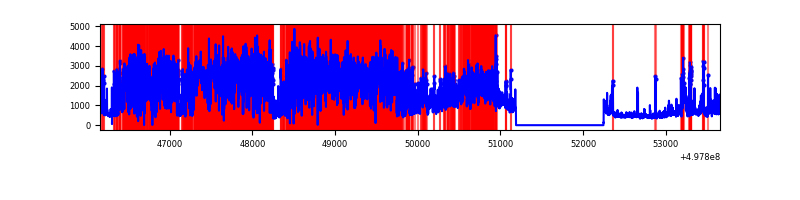 |
Top three noisy pixels from each quadrant. If the there are fewer than three noisy pixels in the level2.evt file, extra rows are filled as -1
| Pixel properties | Quadrant properties | ||||||
|---|---|---|---|---|---|---|---|
| Quadrant | DetID | PixID | Counts | Sigma | Mean | Median | Sigma |
| A | 15 | 174 | 104582 | 632.26 | 670 | 655 | 164.4 |
| A | 7 | 29 | 66272 | 399.2 | 670 | 655 | 164.4 |
| A | 12 | 17 | 43549 | 260.96 | 670 | 655 | 164.4 |
| B | 14 | 167 | 160599 | 1123.09 | 668 | 643 | 142.4 |
| B | 7 | 0 | 128960 | 900.94 | 668 | 643 | 142.4 |
| B | 10 | 247 | 67292 | 467.96 | 668 | 643 | 142.4 |
| C | 1 | 241 | 3114783 | 19227.6 | 590 | 586 | 162.0 |
| C | 12 | 249 | 413265 | 2547.95 | 590 | 586 | 162.0 |
| C | 14 | 254 | 306044 | 1885.95 | 590 | 586 | 162.0 |
| D | 8 | 176 | 8251329 | 63911.83 | 451 | 431 | 129.1 |
| D | 2 | 172 | 288522 | 2231.57 | 451 | 431 | 129.1 |
| D | 3 | 12 | 95606 | 737.23 | 451 | 431 | 129.1 |
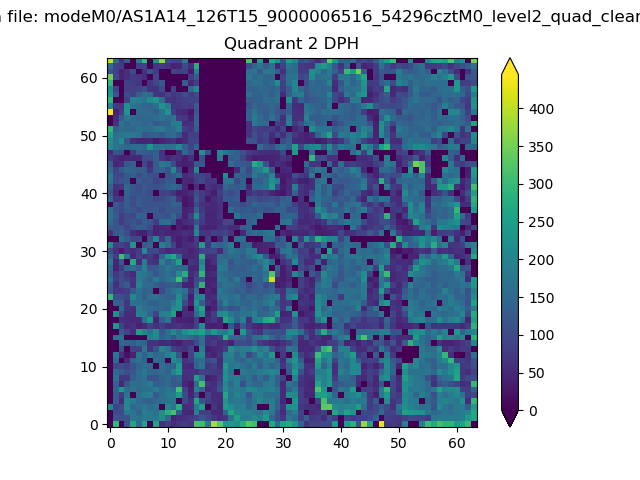
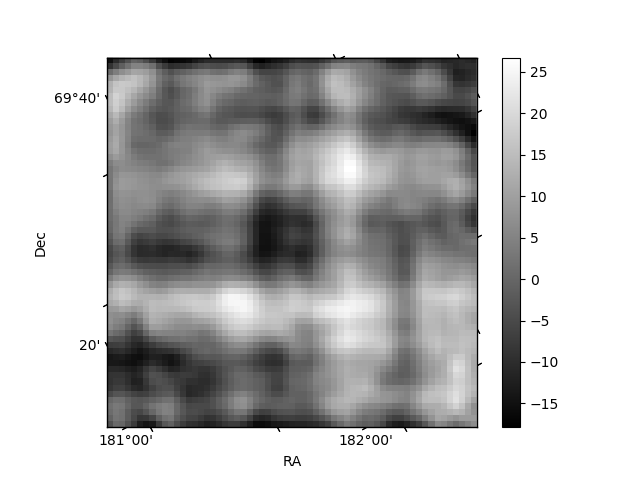
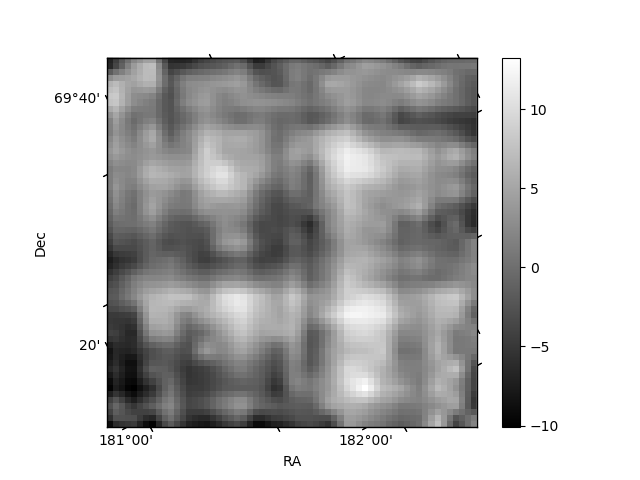
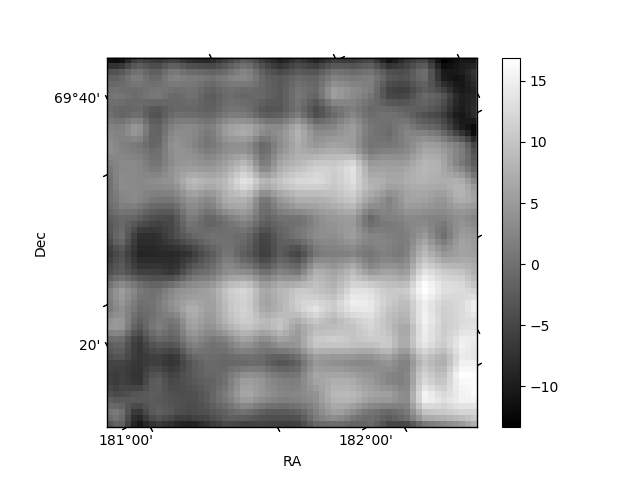
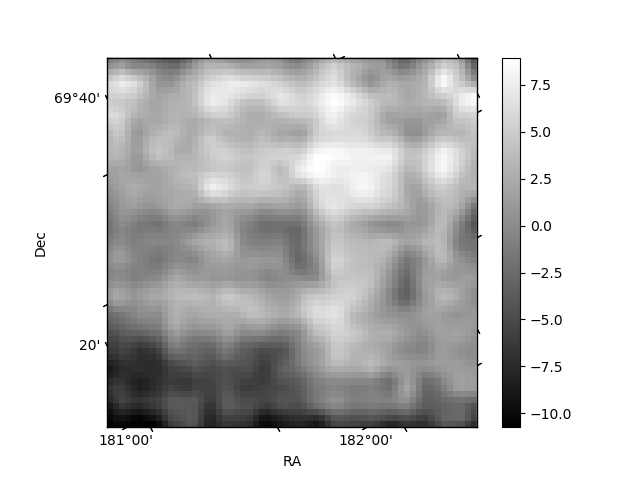
Histogram calculated using DETX and DETY for each event in the final _common_clean file
| Quadrant A | 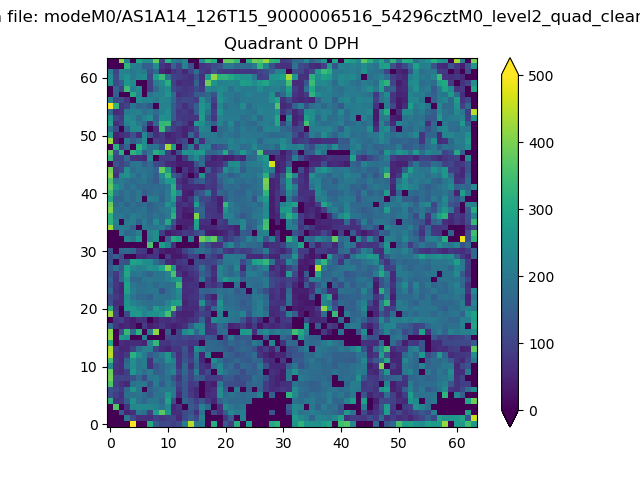 |
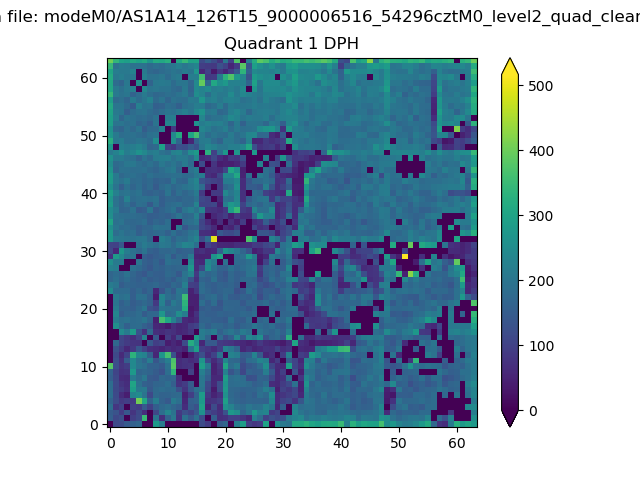 |
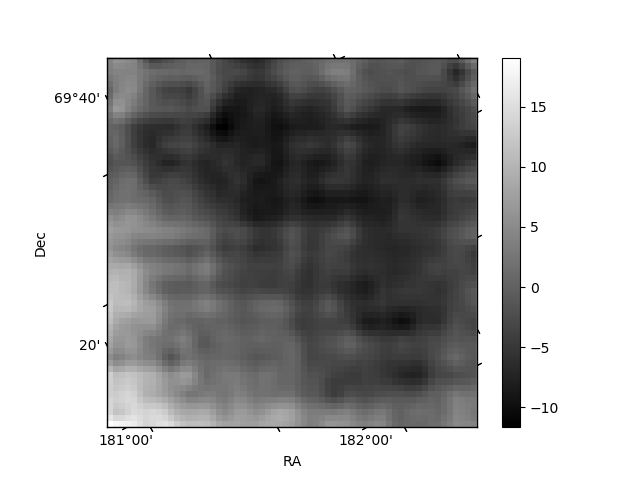
Quadrant B |
|---|---|---|---|
| Quadrant D | 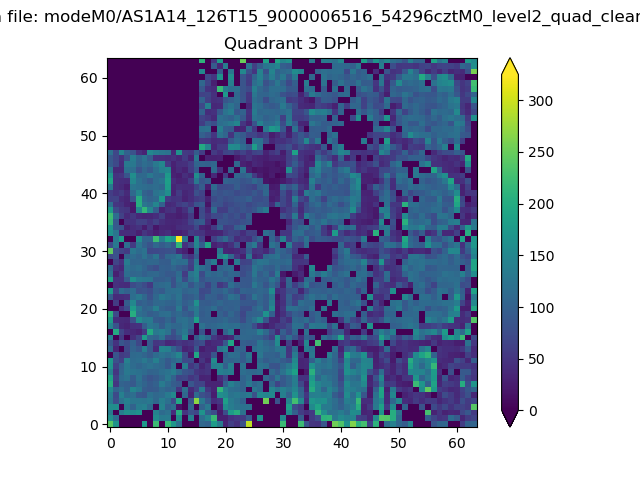 |
 |
Quadrant C |
| Plot type | Count rate plots | Images |
|---|---|---|
| Comparison with Poisson distribution Blue bars denote a histogram of data divided into 1 sec bins. Red curve is a Poisson curve with rate = median count rate of data. |
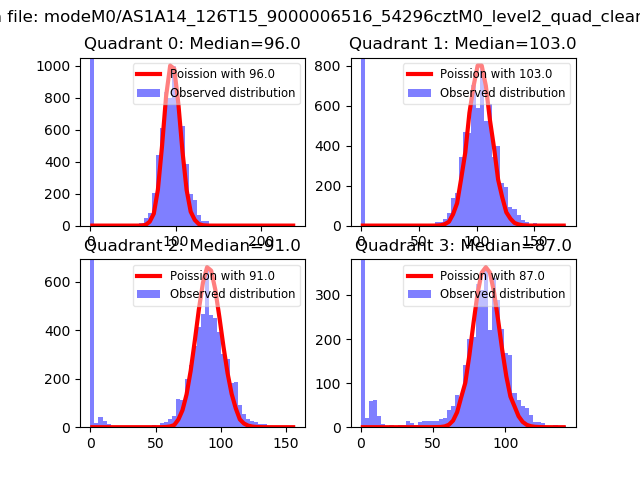 |
 |
| Quadrant-wise count rates Data is divided into 100 sec bins |
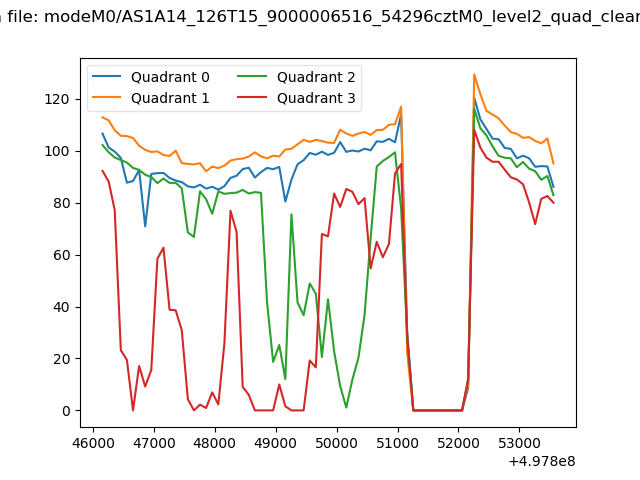 |
|
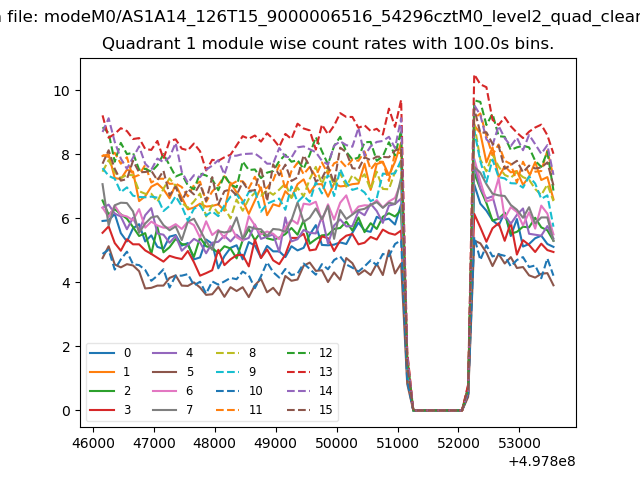
| Module-wise count rates for Quadrant A Data is divided into 100 sec bins |
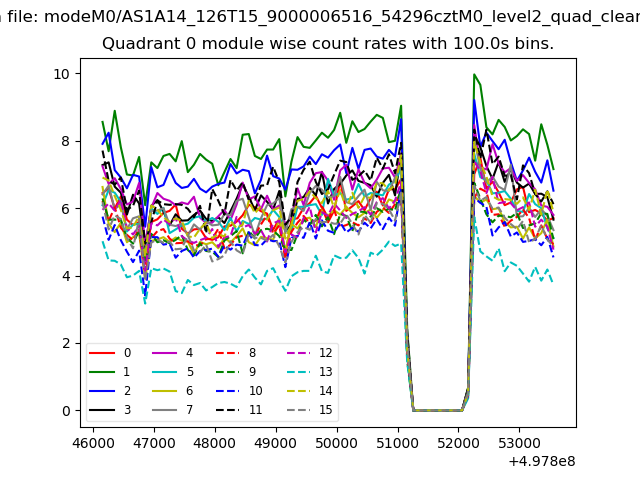 |
 |
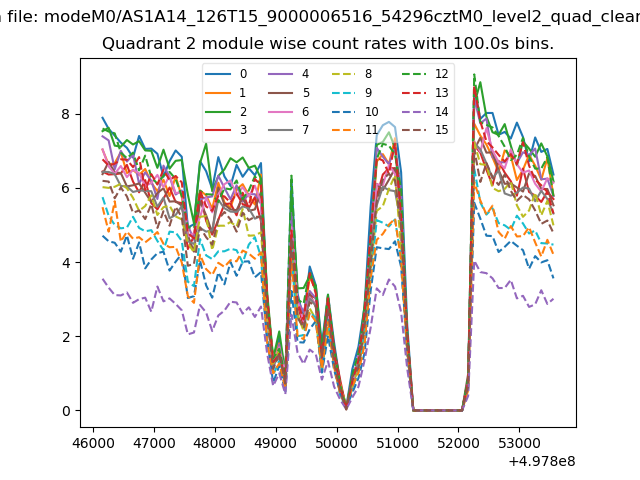
| Module-wise count rates for Quadrant B Data is divided into 100 sec bins |
 |
 |
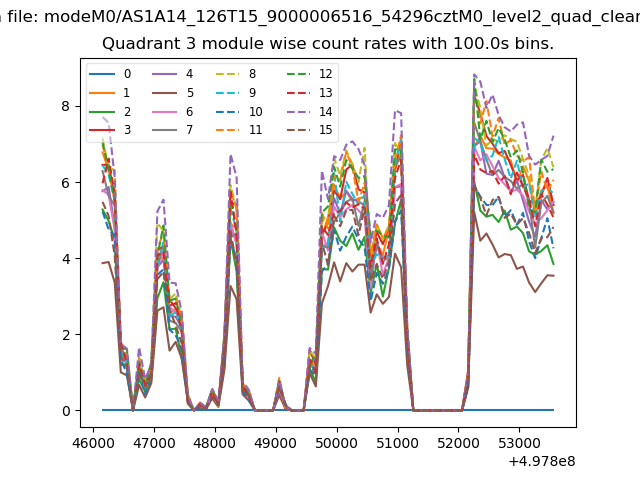
| Module-wise count rates for Quadrant C Data is divided into 100 sec bins |
 |
 |
| Module-wise count rates for Quadrant D Data is divided into 100 sec bins |
 |
 |
| Parameter | Plot |
|---|---|
| CZT HV Monitor | 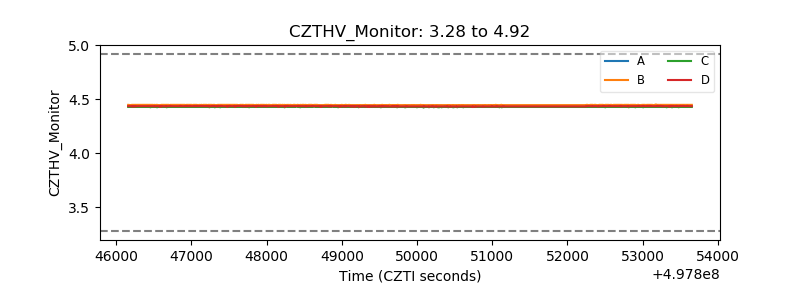 |
| D_VDD | 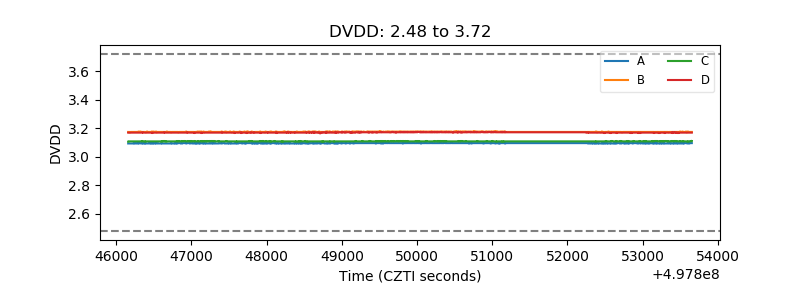 |
| Temperature 1 |  |
| Veto HV Monitor | 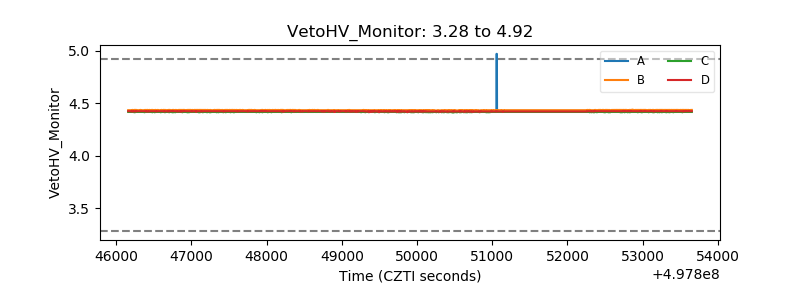 |
| Veto LLD | 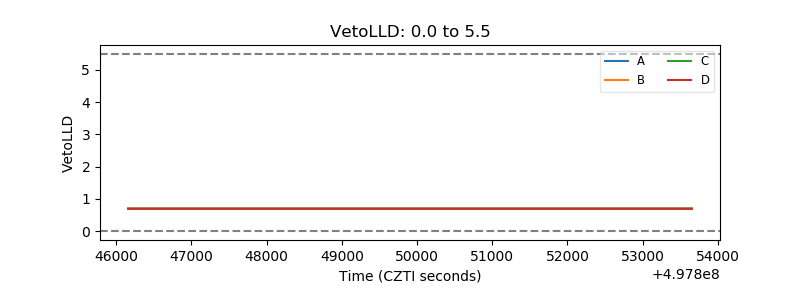 |
| Alpha Counter | 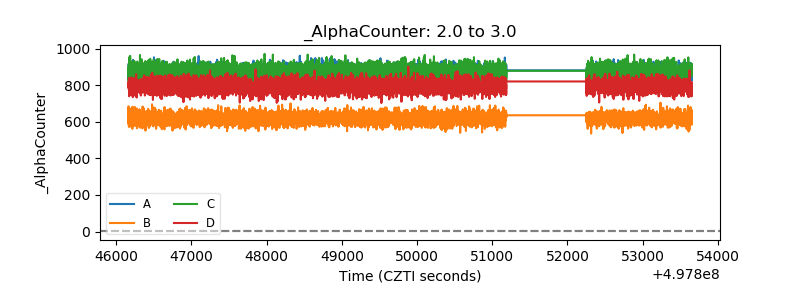 |
| _CPM_Rate | 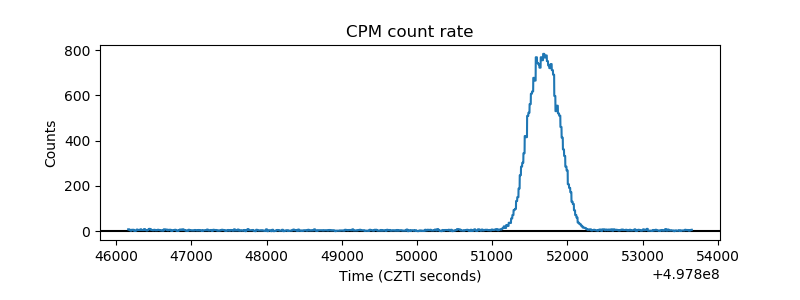 |
| CZT Counter | 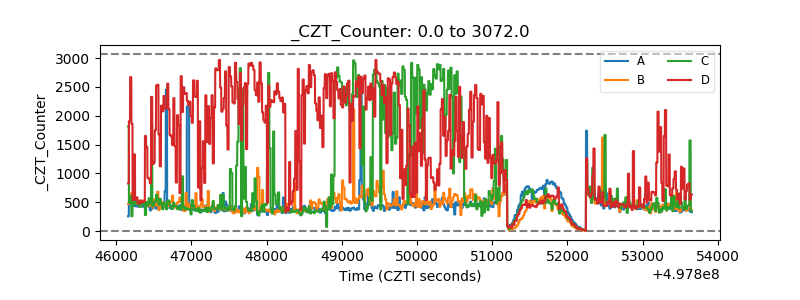 |
| +2.5 Volts monitor |  |
| +5 Volts monitor |  |
| _ROLL_ROT | 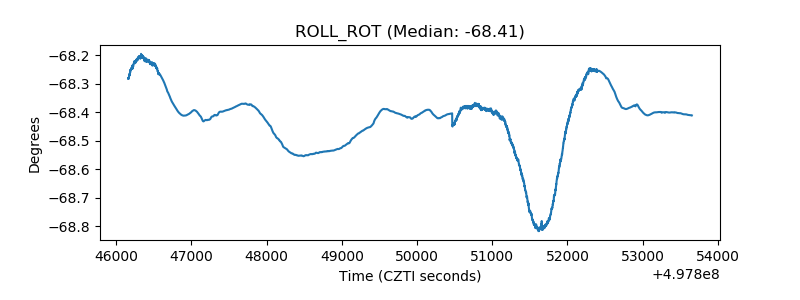 |
| _Roll_DEC | 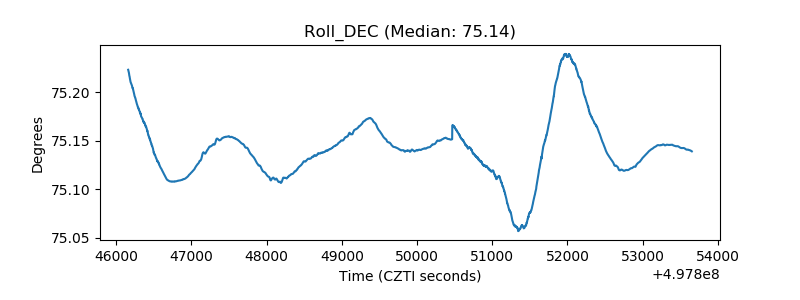 |
| _Roll_RA | 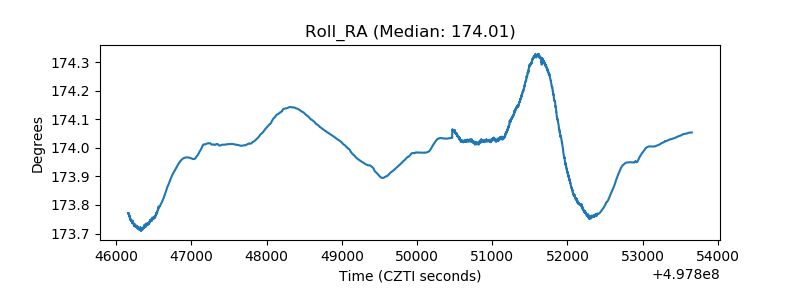 |
| Veto Counter | 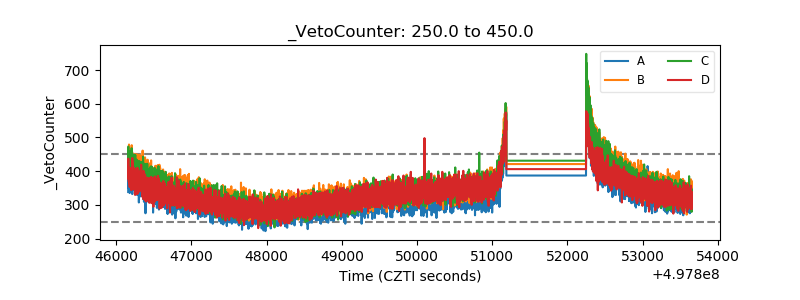 |