| Param | Original file | Final file |
|---|---|---|
| Filename | modeM0/AS1A14_126T15_9000006516_54297cztM0_level2.fits | modeM0/AS1A14_126T15_9000006516_54297cztM0_level2_quad_clean.evt |
| Size (bytes) | 507,139,200 | 83,920,320 |
| Size | 483.6 MB | 80.0 MB |
| Events in quadrant A | 2,679,692 | 601,776 |
| Events in quadrant B | 2,922,091 | 643,913 |
| Events in quadrant C | 3,170,060 | 562,700 |
| Events in quadrant D | 9,527,384 | 308,023 |
| Mode SS | |||
|---|---|---|---|
| Quadrant | BADHDUFLAG | Total packets | Discarded packets |
| A | 0 | 124 | 0 |
| B | 0 | 124 | 0 |
| C | 0 | 124 | 0 |
| D | 0 | 124 | 0 |
| Mode M0 | |||
|---|---|---|---|
| Quadrant | BADHDUFLAG | Total packets | Discarded packets |
| A | 0 | 12581 | 1 |
| B | 0 | 13106 | 1 |
| C | 0 | 14127 | 1 |
| D | 0 | 32570 | 1 |
| Mode M9 | |||
|---|---|---|---|
| Quadrant | BADHDUFLAG | Total packets | Discarded packets |
| A | 0 | 11 | 0 |
| B | 0 | 11 | 0 |
| C | 0 | 11 | 0 |
| D | 0 | 11 | 0 |
| Quadrant | Total seconds | Saturated seconds | Saturation percentage |
|---|---|---|---|
| A | 6079 | 21 | 0.345452% |
| B | 6080 | 80 | 1.315789% |
| C | 6080 | 113 | 1.858553% |
| D | 6080 | 2670 | 43.914474% |
Noise dominated data is calculated using 1-second bins in cleaned event files. If a bin has >2000 counts, and if more than 50% of those come from <1% of pixels, then it is considered to be noise-dominated and hence unusable.
| Quadrant | # 1 sec bins | Bins with >0 counts | Bins with >2000 counts | High rate bins dominated by noise | Noise dominated (total time) | Noise dominated (detector-on time) | Marked lightcurve |
|---|---|---|---|---|---|---|---|
| A | 7229 | 6080 | 8 | 8 | 0.11% | 0.13% | 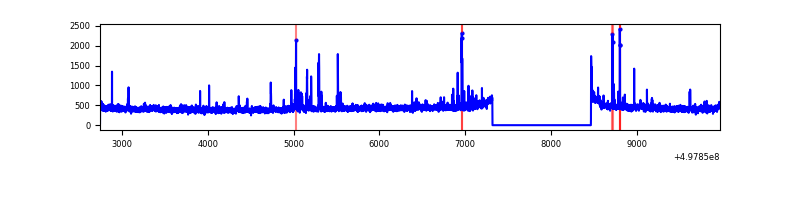 |
| B | 7230 | 6081 | 25 | 25 | 0.35% | 0.41% | 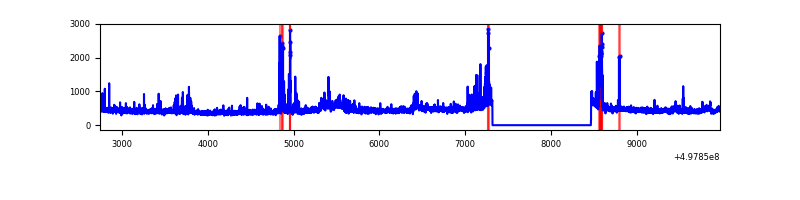 |
| C | 7230 | 6081 | 103 | 103 | 1.42% | 1.69% | 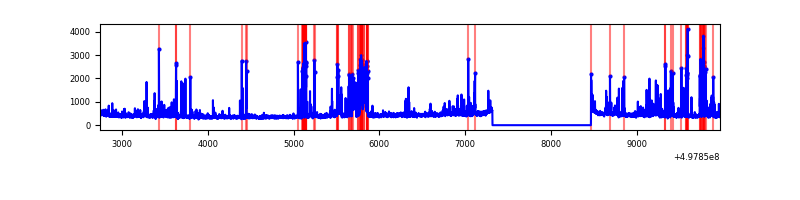 |
| D | 7230 | 6081 | 2374 | 2374 | 32.84% | 39.04% | 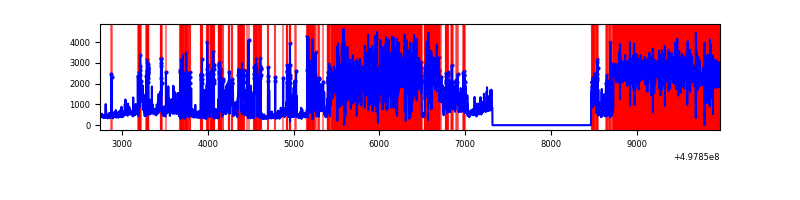 |
Top three noisy pixels from each quadrant. If the there are fewer than three noisy pixels in the level2.evt file, extra rows are filled as -1
| Pixel properties | Quadrant properties | ||||||
|---|---|---|---|---|---|---|---|
| Quadrant | DetID | PixID | Counts | Sigma | Mean | Median | Sigma |
| A | 15 | 174 | 37748 | 233.27 | 641 | 625 | 159.1 |
| A | 8 | 246 | 33252 | 205.02 | 641 | 625 | 159.1 |
| A | 4 | 3 | 20851 | 127.1 | 641 | 625 | 159.1 |
| B | 7 | 0 | 116841 | 850.66 | 633 | 610 | 136.6 |
| B | 0 | 213 | 81362 | 591.0 | 633 | 610 | 136.6 |
| B | 10 | 247 | 72710 | 527.68 | 633 | 610 | 136.6 |
| C | 14 | 254 | 500507 | 2956.14 | 610 | 603 | 169.1 |
| C | 12 | 249 | 214821 | 1266.76 | 610 | 603 | 169.1 |
| C | 1 | 241 | 27093 | 156.65 | 610 | 603 | 169.1 |
| D | 8 | 176 | 5080731 | 40876.69 | 433 | 414 | 124.3 |
| D | 2 | 172 | 2390286 | 19229.12 | 433 | 414 | 124.3 |
| D | 2 | 153 | 126329 | 1013.12 | 433 | 414 | 124.3 |
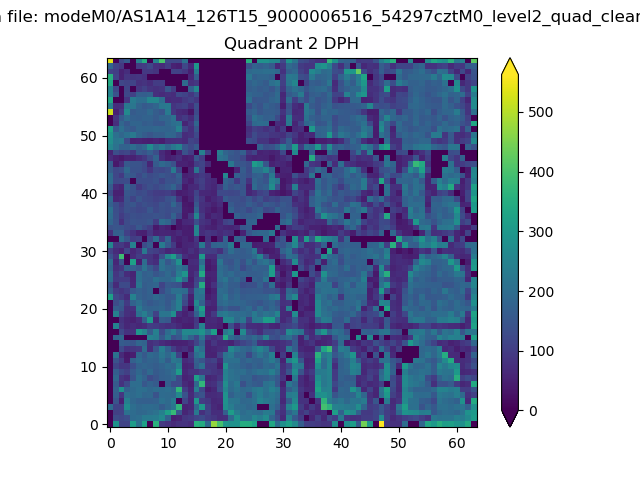
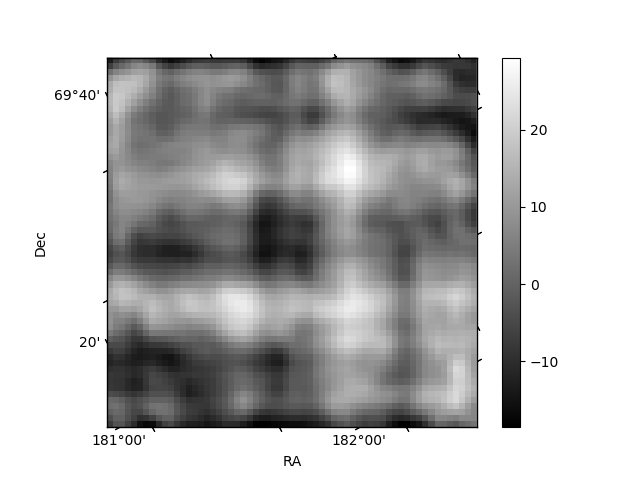
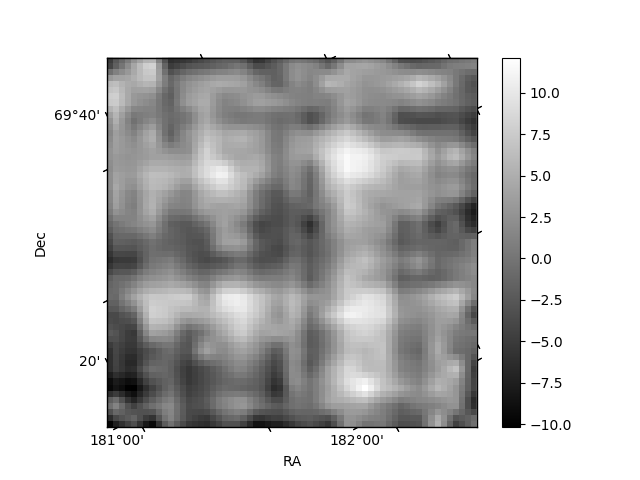
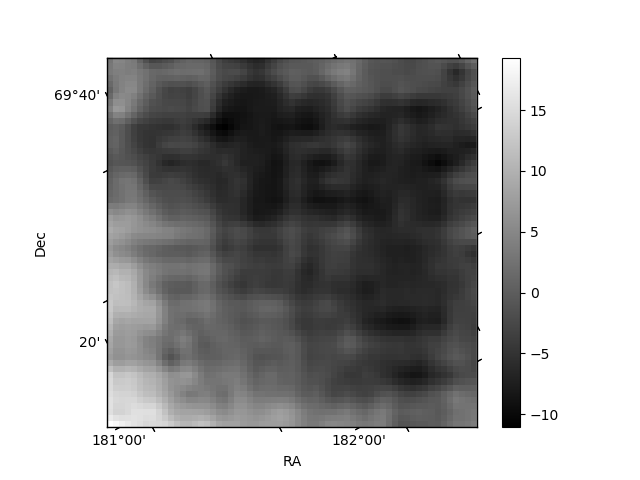
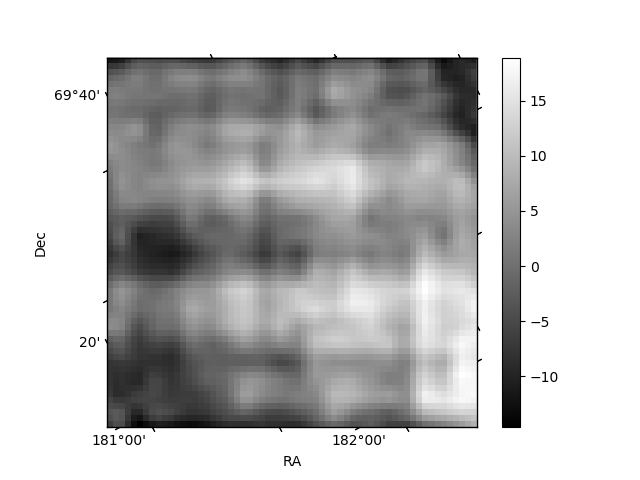
Histogram calculated using DETX and DETY for each event in the final _common_clean file
| Quadrant A | 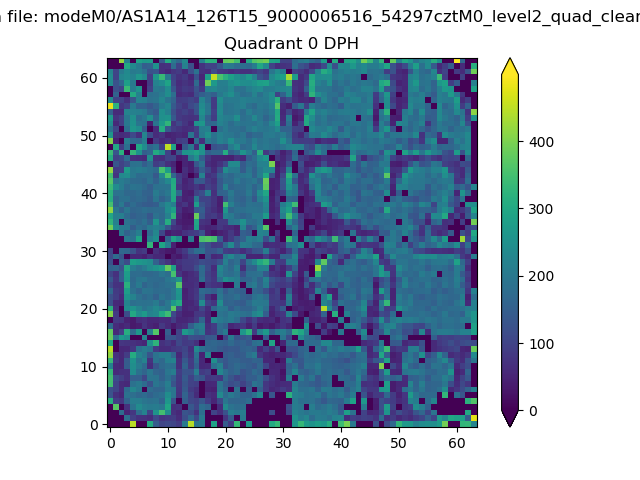 |
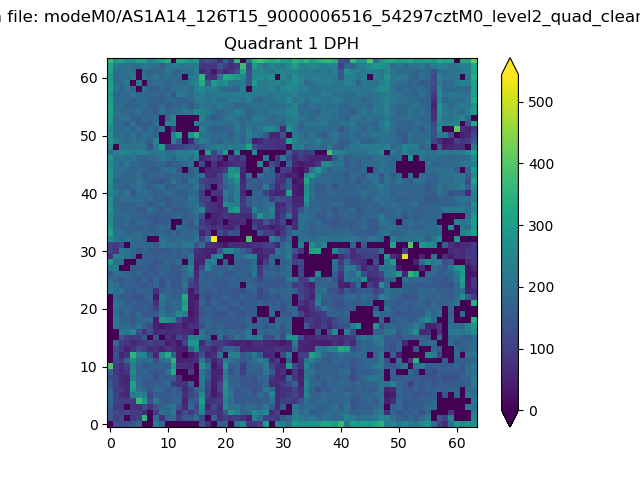 |
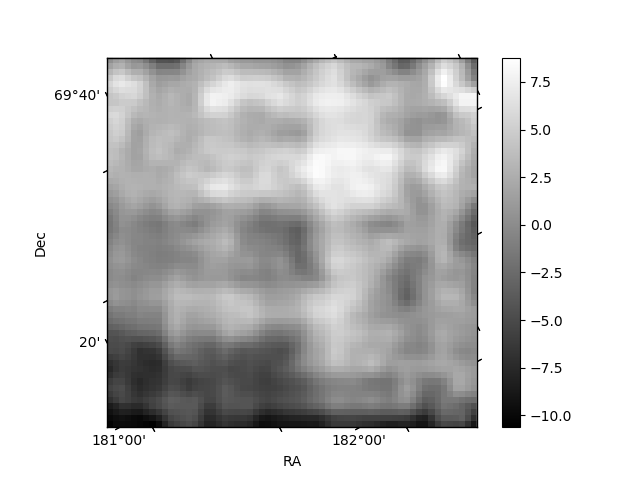
Quadrant B |
|---|---|---|---|
| Quadrant D | 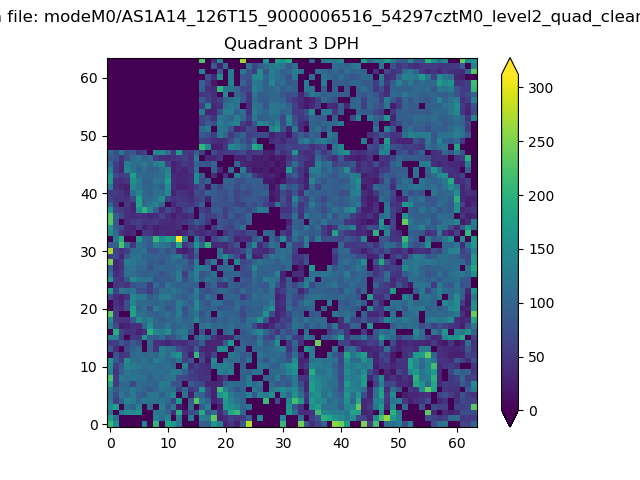 |
 |
Quadrant C |
| Plot type | Count rate plots | Images |
|---|---|---|
| Comparison with Poisson distribution Blue bars denote a histogram of data divided into 1 sec bins. Red curve is a Poisson curve with rate = median count rate of data. |
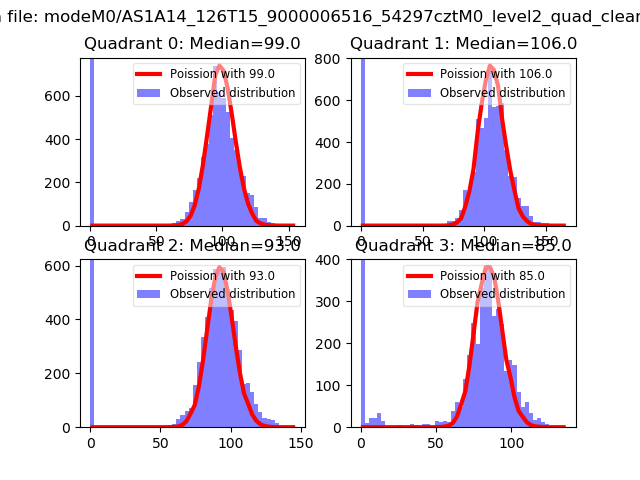 |
 |
| Quadrant-wise count rates Data is divided into 100 sec bins |
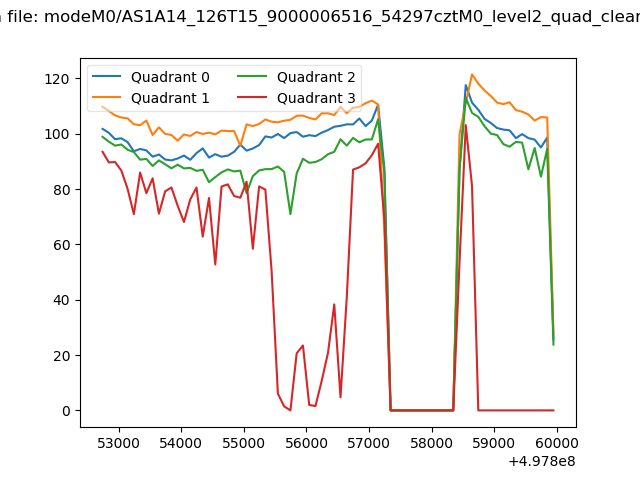 |
|
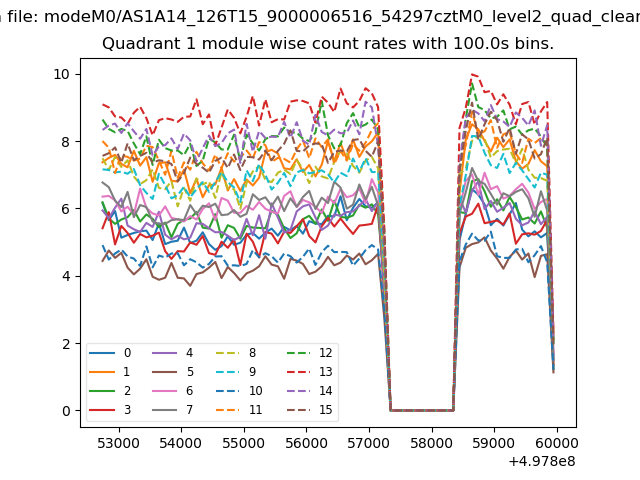
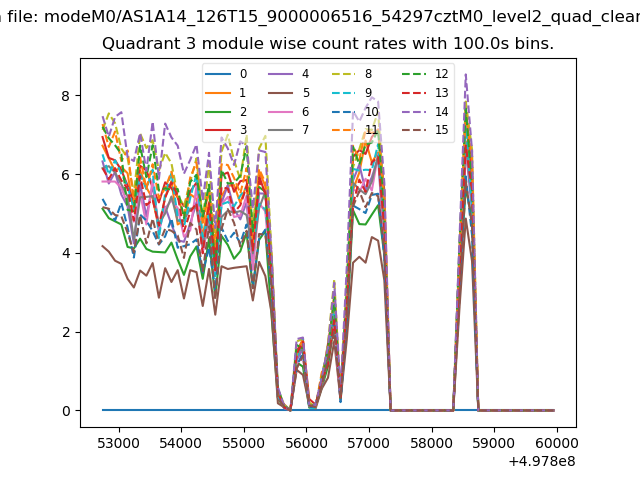
| Module-wise count rates for Quadrant A Data is divided into 100 sec bins |
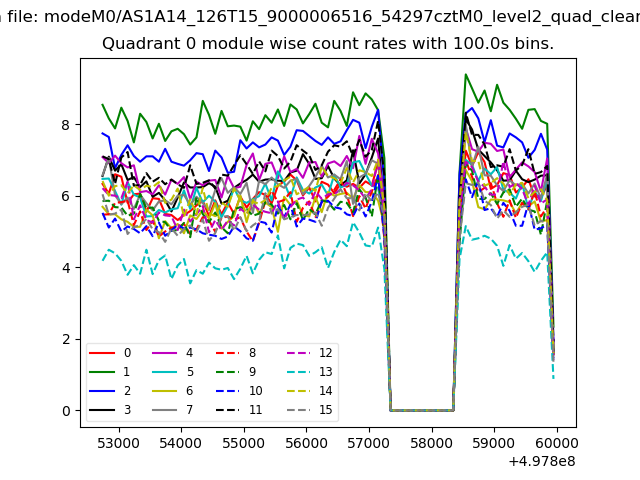 |
 |
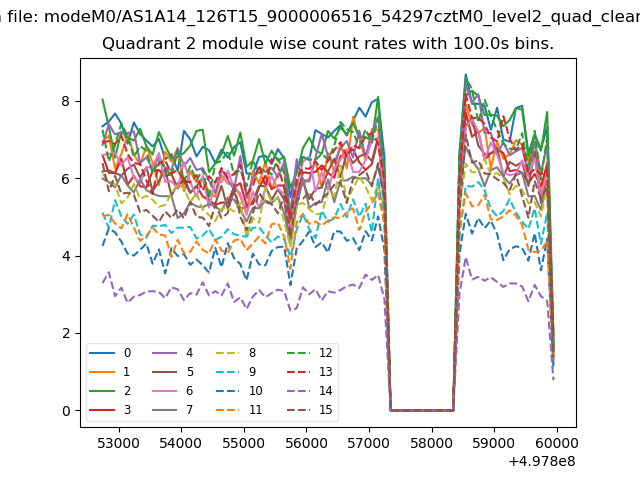
| Module-wise count rates for Quadrant B Data is divided into 100 sec bins |
 |
 |
| Module-wise count rates for Quadrant C Data is divided into 100 sec bins |
 |
 |
| Module-wise count rates for Quadrant D Data is divided into 100 sec bins |
 |
 |
| Parameter | Plot |
|---|---|
| CZT HV Monitor | 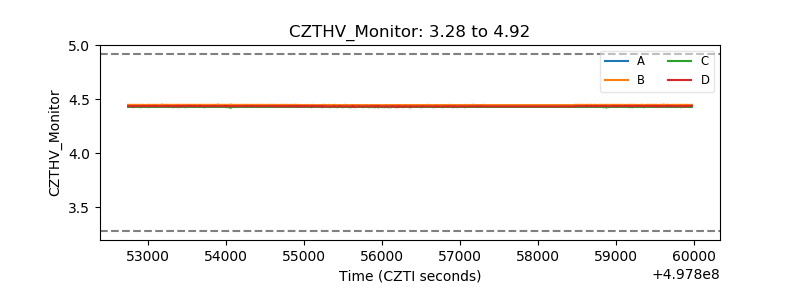 |
| D_VDD | 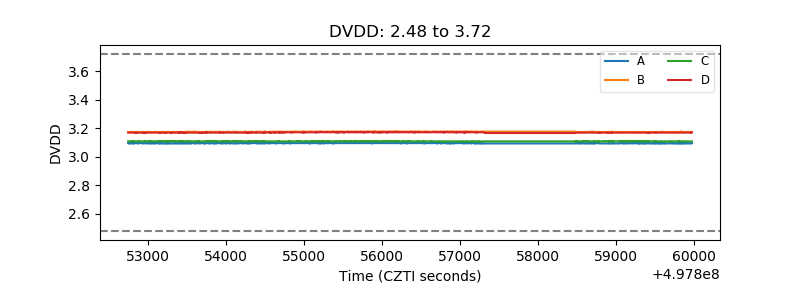 |
| Temperature 1 | 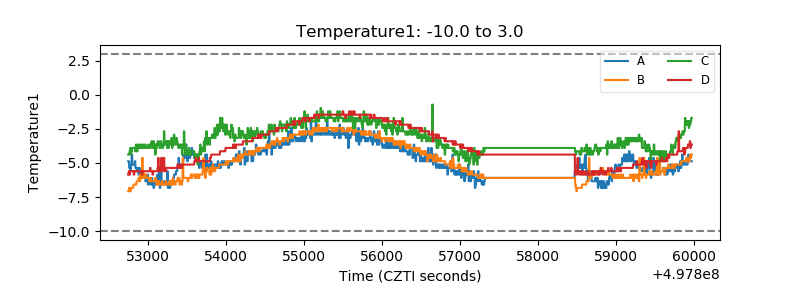 |
| Veto HV Monitor | 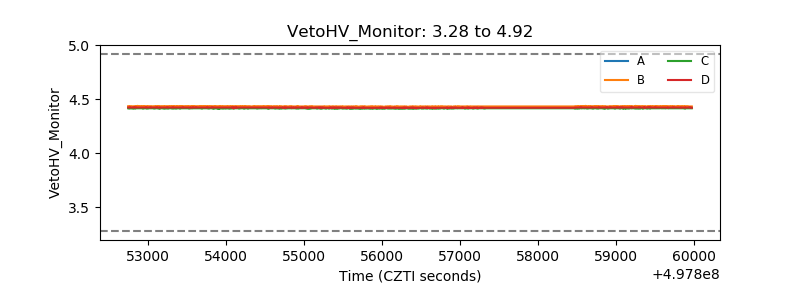 |
| Veto LLD | 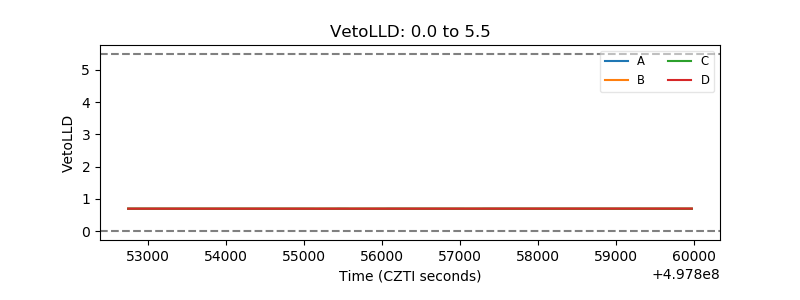 |
| Alpha Counter | 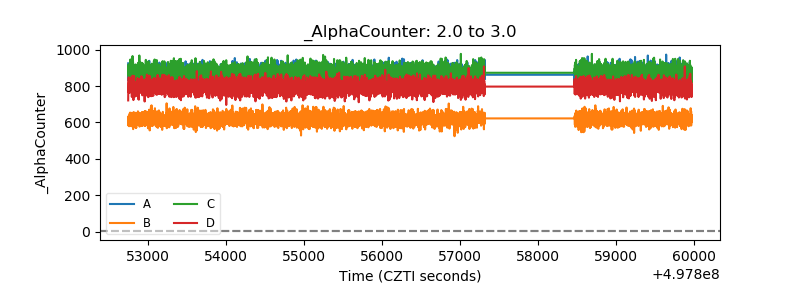 |
| _CPM_Rate | 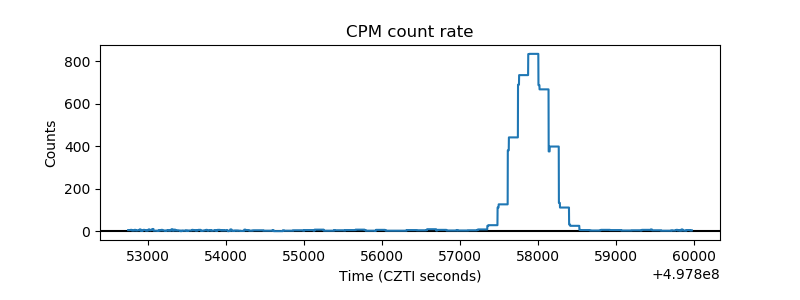 |
| CZT Counter | 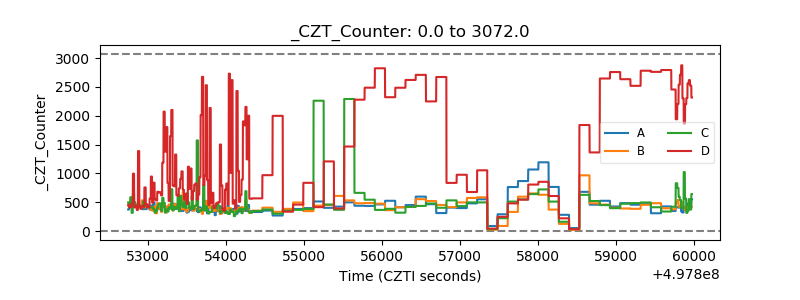 |
| +2.5 Volts monitor |  |
| +5 Volts monitor |  |
| _ROLL_ROT | 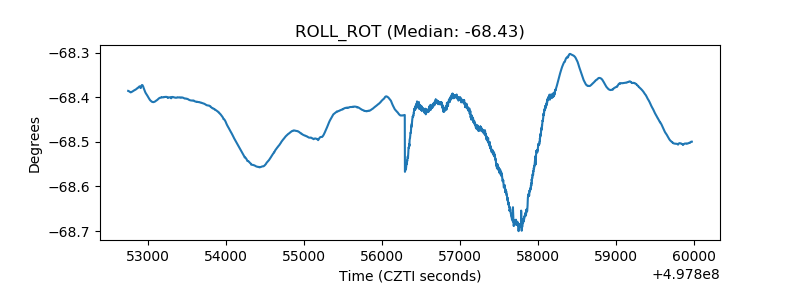 |
| _Roll_DEC | 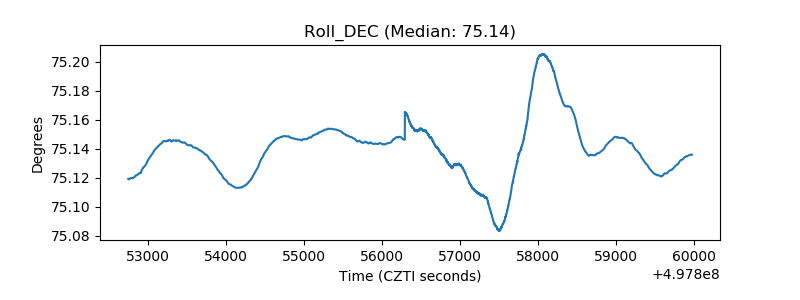 |
| _Roll_RA | 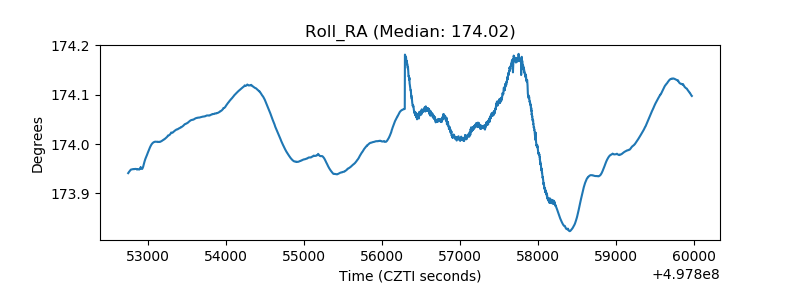 |
| Veto Counter | 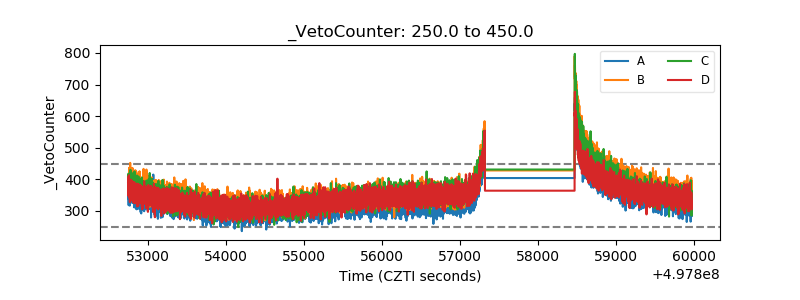 |