| Param | Original file | Final file |
|---|---|---|
| Filename | modeM0/AS1A14_126T15_9000006516_54300cztM0_level2.fits | modeM0/AS1A14_126T15_9000006516_54300cztM0_level2_quad_clean.evt |
| Size (bytes) | 533,652,480 | 95,068,800 |
| Size | 508.9 MB | 90.7 MB |
| Events in quadrant A | 3,367,904 | 651,084 |
| Events in quadrant B | 3,547,409 | 698,149 |
| Events in quadrant C | 5,196,085 | 546,394 |
| Events in quadrant D | 7,125,612 | 518,973 |
| Mode SS | |||
|---|---|---|---|
| Quadrant | BADHDUFLAG | Total packets | Discarded packets |
| A | 0 | 134 | 0 |
| B | 0 | 134 | 0 |
| C | 0 | 134 | 0 |
| D | 0 | 134 | 0 |
| Mode M0 | |||
|---|---|---|---|
| Quadrant | BADHDUFLAG | Total packets | Discarded packets |
| A | 0 | 14869 | 1 |
| B | 0 | 14931 | 1 |
| C | 0 | 20330 | 2 |
| D | 0 | 25780 | 1 |
| Mode M9 | |||
|---|---|---|---|
| Quadrant | BADHDUFLAG | Total packets | Discarded packets |
| A | 0 | 10 | 0 |
| B | 0 | 10 | 0 |
| C | 0 | 10 | 0 |
| D | 0 | 10 | 0 |
| Quadrant | Total seconds | Saturated seconds | Saturation percentage |
|---|---|---|---|
| A | 6659 | 123 | 1.847124% |
| B | 6659 | 71 | 1.066226% |
| C | 6658 | 787 | 11.820366% |
| D | 6659 | 852 | 12.794714% |
Noise dominated data is calculated using 1-second bins in cleaned event files. If a bin has >2000 counts, and if more than 50% of those come from <1% of pixels, then it is considered to be noise-dominated and hence unusable.
| Quadrant | # 1 sec bins | Bins with >0 counts | Bins with >2000 counts | High rate bins dominated by noise | Noise dominated (total time) | Noise dominated (detector-on time) | Marked lightcurve |
|---|---|---|---|---|---|---|---|
| A | 7654 | 6660 | 70 | 70 | 0.91% | 1.05% | 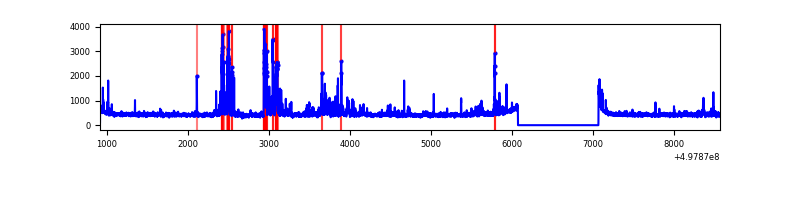 |
| B | 7654 | 6660 | 24 | 24 | 0.31% | 0.36% | 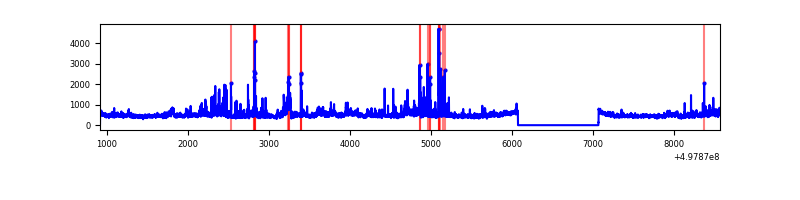 |
| C | 7653 | 6659 | 729 | 729 | 9.53% | 10.95% | 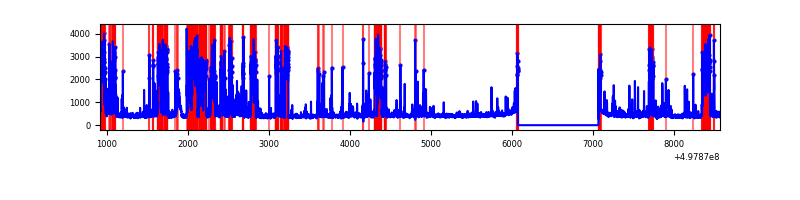 |
| D | 7654 | 6660 | 936 | 936 | 12.23% | 14.05% | 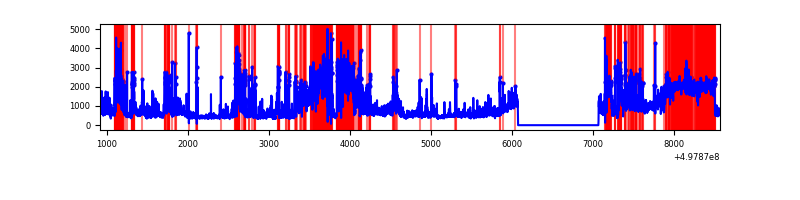 |
Top three noisy pixels from each quadrant. If the there are fewer than three noisy pixels in the level2.evt file, extra rows are filled as -1
| Pixel properties | Quadrant properties | ||||||
|---|---|---|---|---|---|---|---|
| Quadrant | DetID | PixID | Counts | Sigma | Mean | Median | Sigma |
| A | 0 | 8 | 237941 | 1354.26 | 710 | 693 | 175.2 |
| A | 8 | 246 | 104174 | 590.69 | 710 | 693 | 175.2 |
| A | 7 | 29 | 64579 | 364.67 | 710 | 693 | 175.2 |
| B | 7 | 0 | 376313 | 2503.49 | 697 | 671 | 150.0 |
| B | 10 | 247 | 110202 | 729.98 | 697 | 671 | 150.0 |
| B | 5 | 185 | 100156 | 663.02 | 697 | 671 | 150.0 |
| C | 1 | 241 | 1899960 | 10866.73 | 638 | 632 | 174.8 |
| C | 12 | 249 | 540849 | 3090.77 | 638 | 632 | 174.8 |
| C | 14 | 254 | 162923 | 928.52 | 638 | 632 | 174.8 |
| D | 8 | 176 | 2551692 | 13901.2 | 649 | 620 | 183.5 |
| D | 2 | 62 | 1364076 | 7429.69 | 649 | 620 | 183.5 |
| D | 2 | 172 | 257260 | 1398.47 | 649 | 620 | 183.5 |
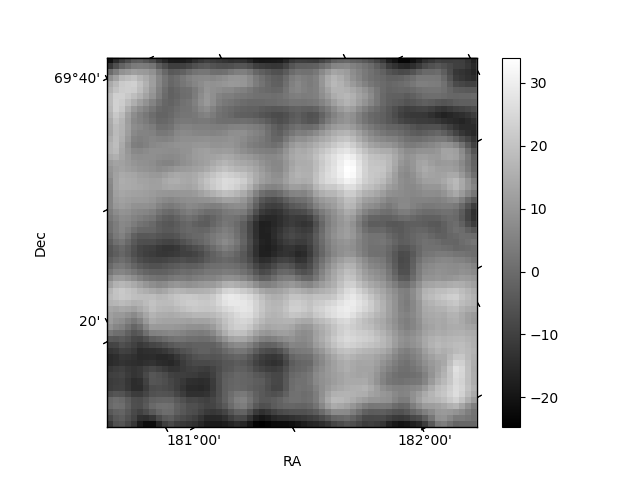
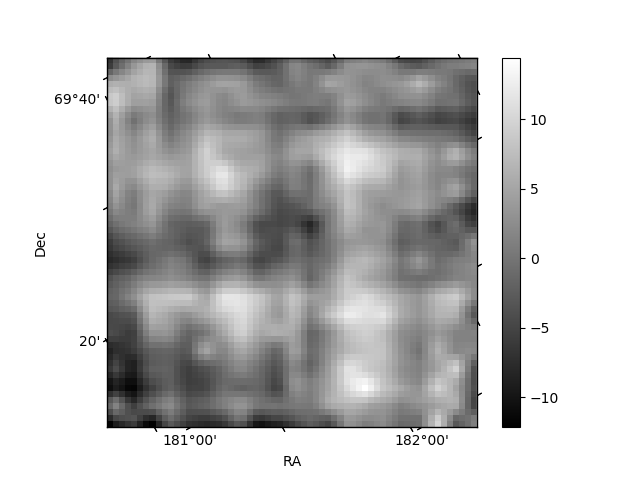
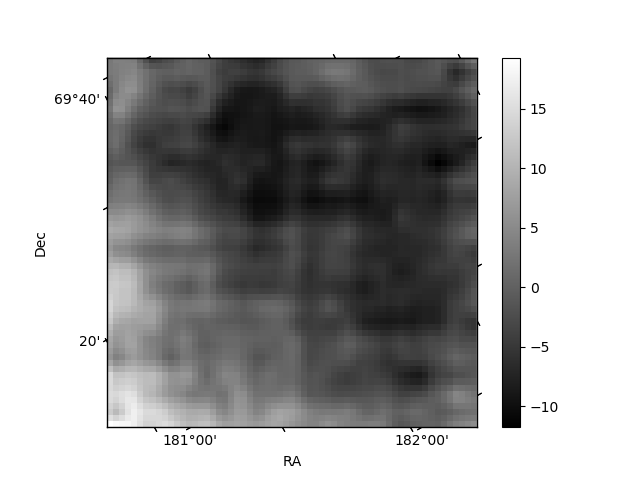
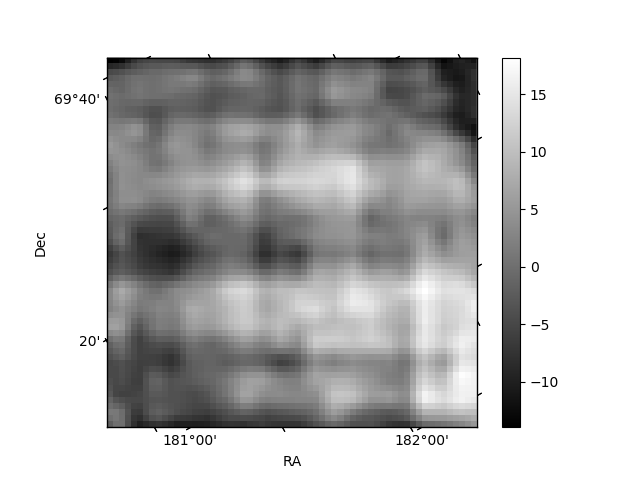
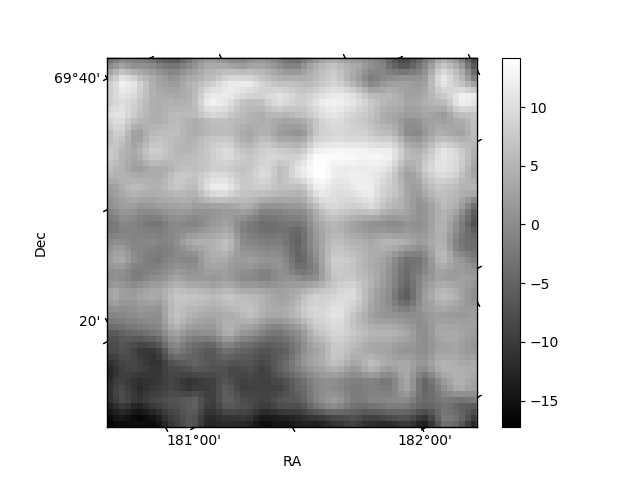
Histogram calculated using DETX and DETY for each event in the final _common_clean file
| Quadrant A | 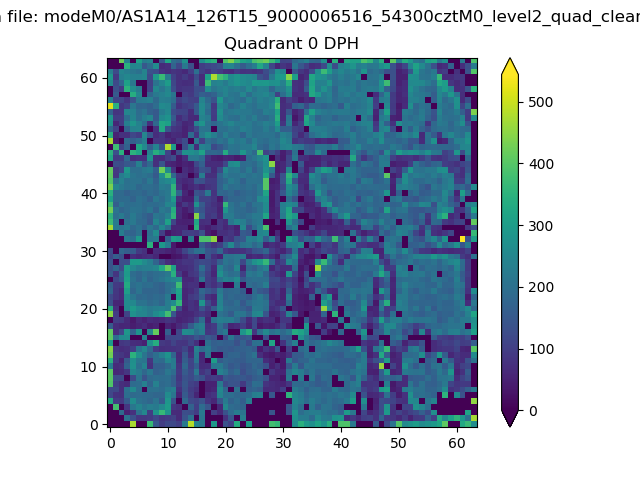 |
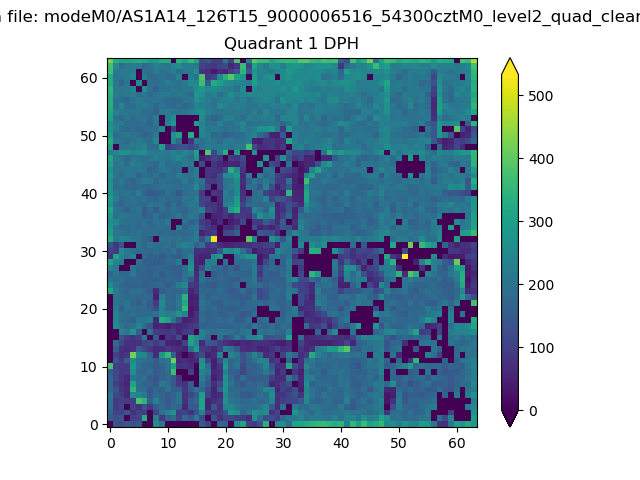 |
Quadrant B |
|---|---|---|---|
| Quadrant D | 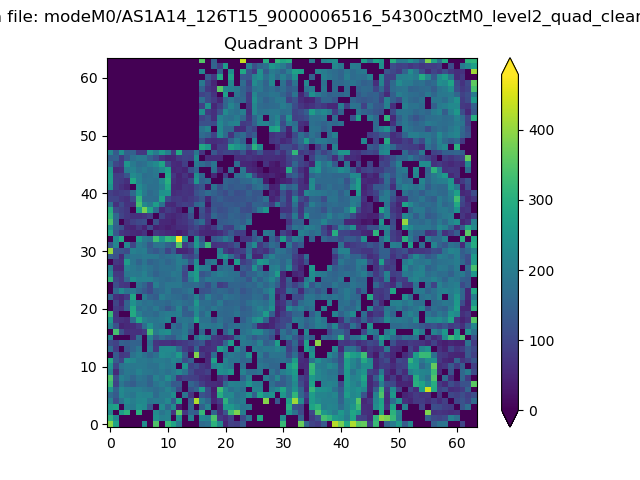 |
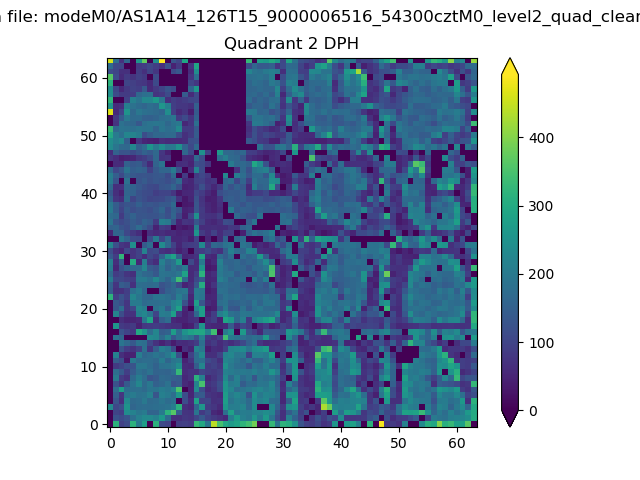 |
Quadrant C |
| Plot type | Count rate plots | Images |
|---|---|---|
| Comparison with Poisson distribution Blue bars denote a histogram of data divided into 1 sec bins. Red curve is a Poisson curve with rate = median count rate of data. |
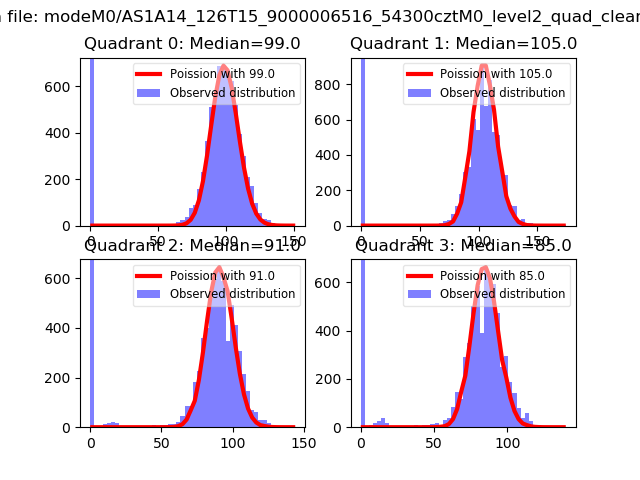 |
 |
| Quadrant-wise count rates Data is divided into 100 sec bins |
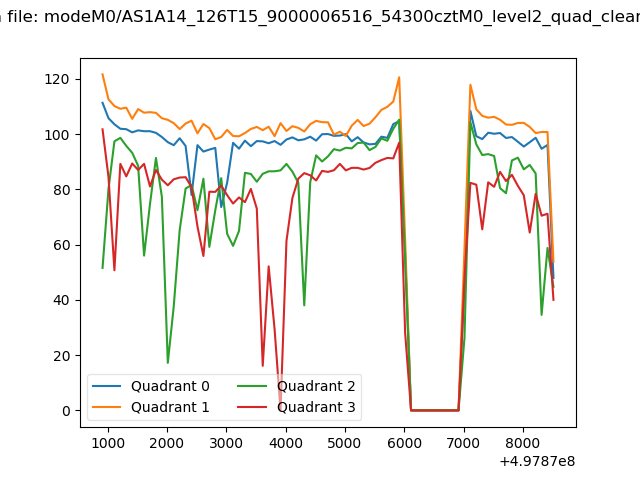 |
|
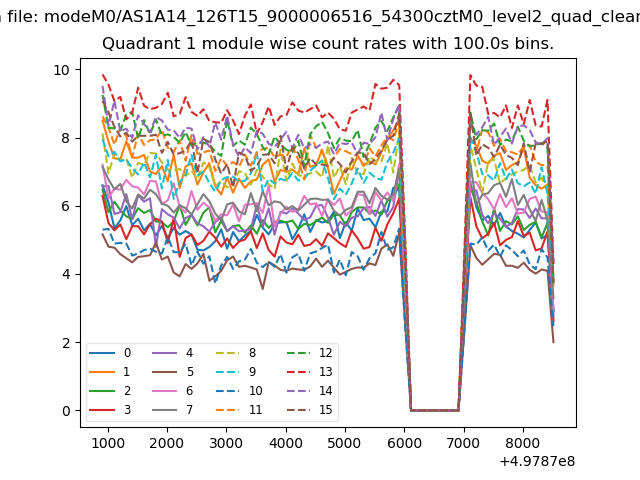
| Module-wise count rates for Quadrant A Data is divided into 100 sec bins |
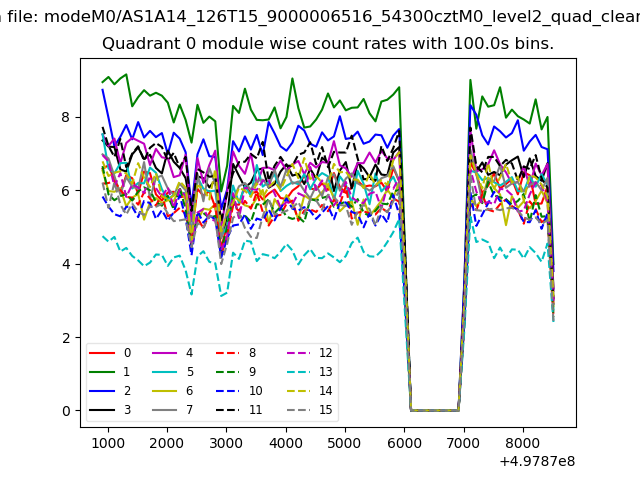 |
 |
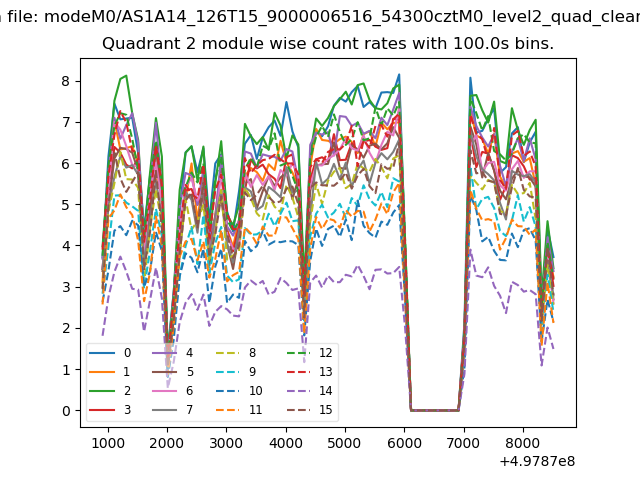
| Module-wise count rates for Quadrant B Data is divided into 100 sec bins |
 |
 |
| Module-wise count rates for Quadrant C Data is divided into 100 sec bins |
 |
 |
| Module-wise count rates for Quadrant D Data is divided into 100 sec bins |
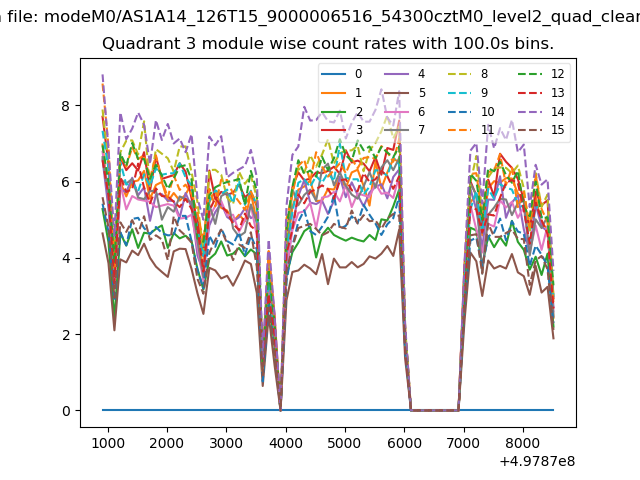 |
 |
| Parameter | Plot |
|---|---|
| CZT HV Monitor | 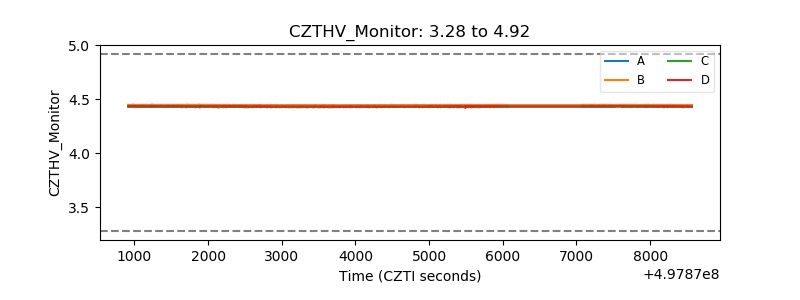 |
| D_VDD |  |
| Temperature 1 | 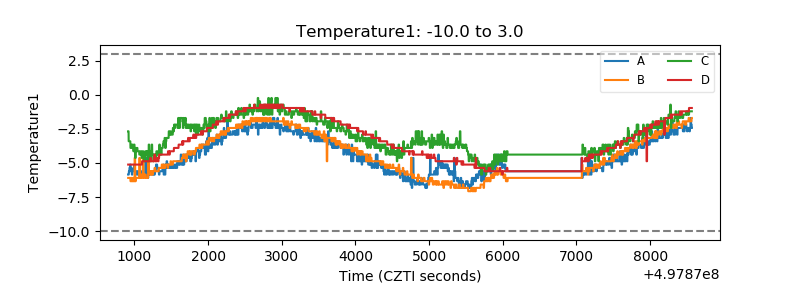 |
| Veto HV Monitor | 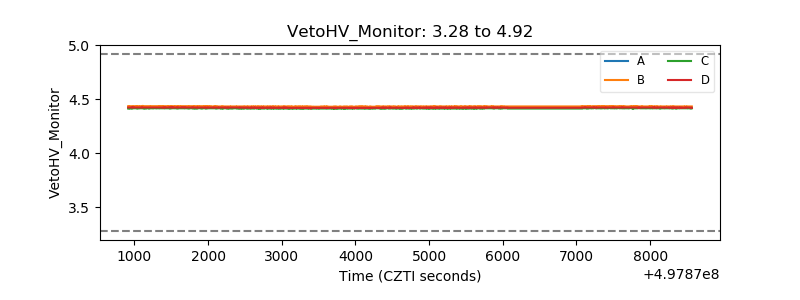 |
| Veto LLD | 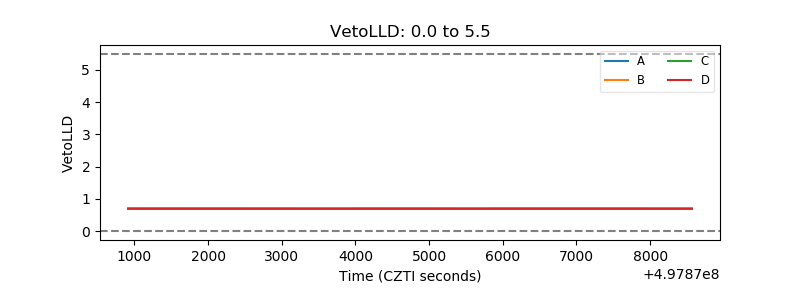 |
| Alpha Counter | 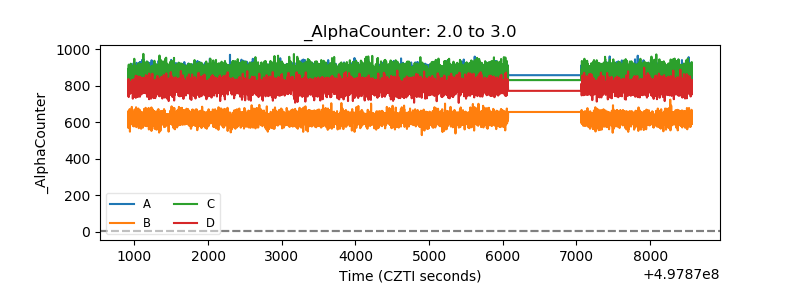 |
| _CPM_Rate | 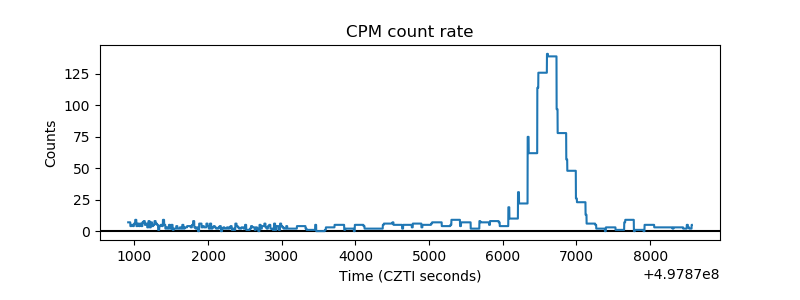 |
| CZT Counter | 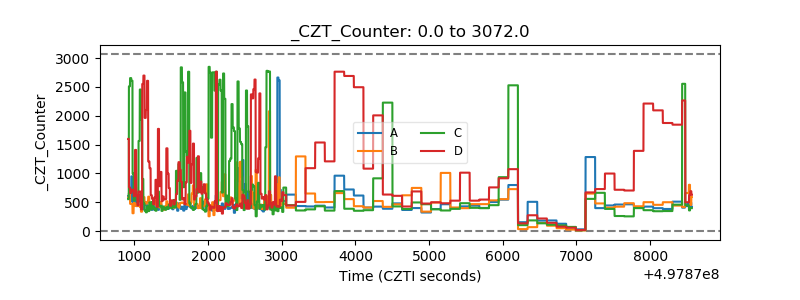 |
| +2.5 Volts monitor |  |
| +5 Volts monitor |  |
| _ROLL_ROT | 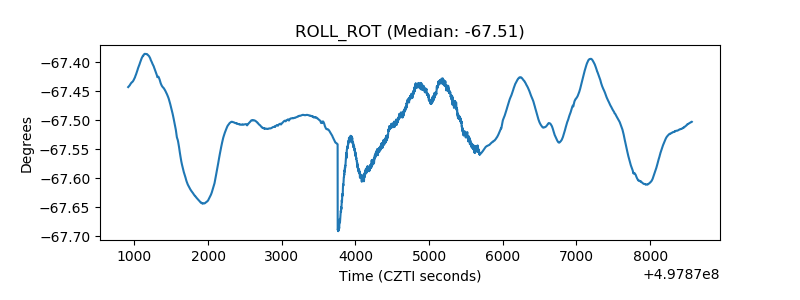 |
| _Roll_DEC | 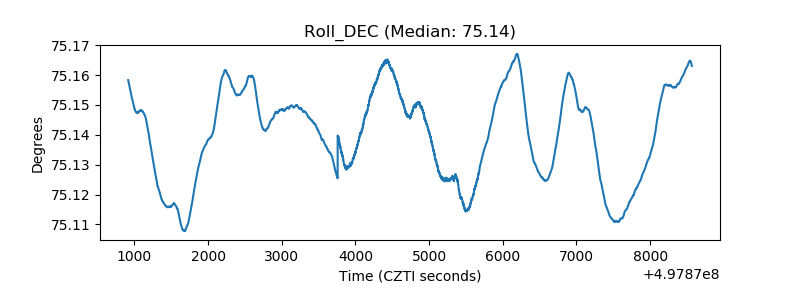 |
| _Roll_RA | 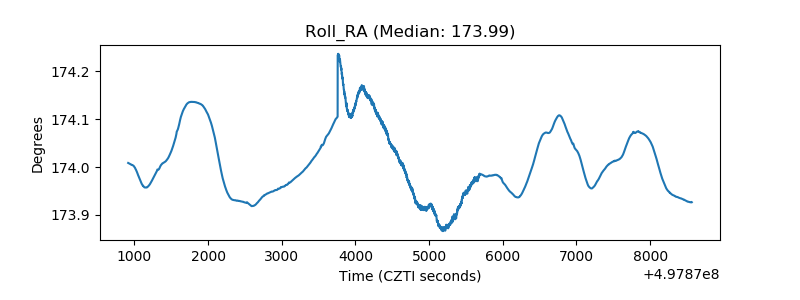 |
| Veto Counter | 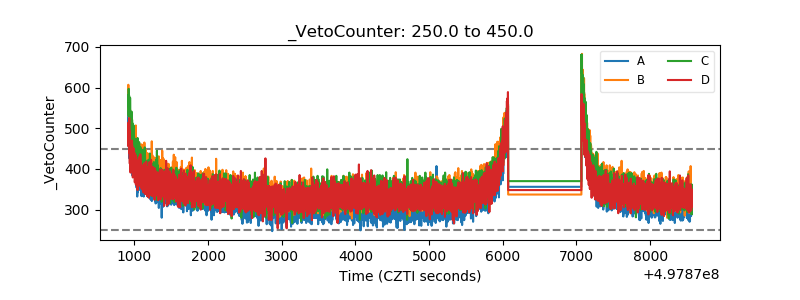 |