| Param | Original file | Final file |
|---|---|---|
| Filename | modeM0/AS1A14_126T15_9000006516_54303cztM0_level2.fits | modeM0/AS1A14_126T15_9000006516_54303cztM0_level2_quad_clean.evt |
| Size (bytes) | 678,720,960 | 96,661,440 |
| Size | 647.3 MB | 92.2 MB |
| Events in quadrant A | 3,746,150 | 690,557 |
| Events in quadrant B | 5,167,666 | 722,617 |
| Events in quadrant C | 3,177,891 | 651,927 |
| Events in quadrant D | 12,460,759 | 348,957 |
| Mode SS | |||
|---|---|---|---|
| Quadrant | BADHDUFLAG | Total packets | Discarded packets |
| A | 0 | 148 | 0 |
| B | 0 | 148 | 0 |
| C | 0 | 148 | 0 |
| D | 0 | 148 | 0 |
| Mode M0 | |||
|---|---|---|---|
| Quadrant | BADHDUFLAG | Total packets | Discarded packets |
| A | 0 | 16544 | 0 |
| B | 0 | 20215 | 0 |
| C | 0 | 15266 | 0 |
| D | 0 | 42083 | 1 |
| Quadrant | Total seconds | Saturated seconds | Saturation percentage |
|---|---|---|---|
| A | 7363 | 126 | 1.711259% |
| B | 7363 | 206 | 2.797773% |
| C | 7364 | 22 | 0.298751% |
| D | 7363 | 3391 | 46.054597% |
Noise dominated data is calculated using 1-second bins in cleaned event files. If a bin has >2000 counts, and if more than 50% of those come from <1% of pixels, then it is considered to be noise-dominated and hence unusable.
| Quadrant | # 1 sec bins | Bins with >0 counts | Bins with >2000 counts | High rate bins dominated by noise | Noise dominated (total time) | Noise dominated (detector-on time) | Marked lightcurve |
|---|---|---|---|---|---|---|---|
| A | 7363 | 7363 | 112 | 112 | 1.52% | 1.52% | 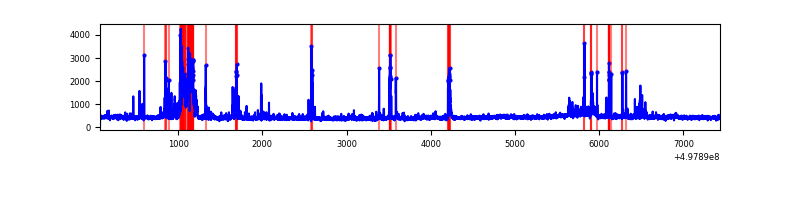 |
| B | 7363 | 7363 | 125 | 125 | 1.70% | 1.70% | 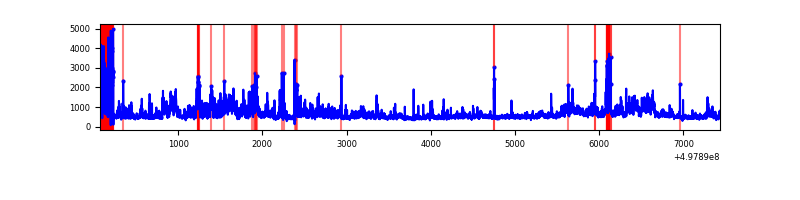 |
| C | 7364 | 7364 | 25 | 25 | 0.34% | 0.34% | 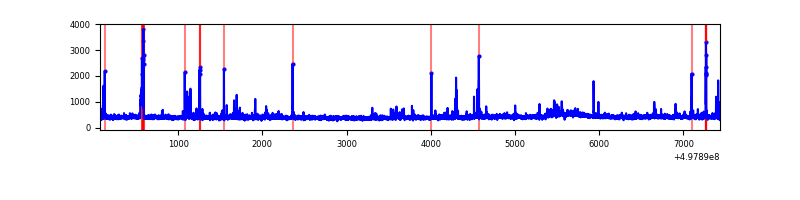 |
| D | 7363 | 7363 | 3193 | 3193 | 43.37% | 43.37% | 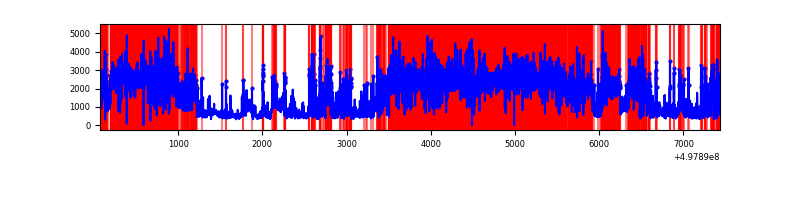 |
Top three noisy pixels from each quadrant. If the there are fewer than three noisy pixels in the level2.evt file, extra rows are filled as -1
| Pixel properties | Quadrant properties | ||||||
|---|---|---|---|---|---|---|---|
| Quadrant | DetID | PixID | Counts | Sigma | Mean | Median | Sigma |
| A | 15 | 174 | 310542 | 1641.13 | 764 | 745 | 188.8 |
| A | 7 | 29 | 198527 | 1047.74 | 764 | 745 | 188.8 |
| A | 8 | 6 | 63504 | 332.46 | 764 | 745 | 188.8 |
| B | 7 | 0 | 1391627 | 8686.54 | 744 | 719 | 160.1 |
| B | 10 | 245 | 315920 | 1968.5 | 744 | 719 | 160.1 |
| B | 5 | 185 | 250862 | 1562.2 | 744 | 719 | 160.1 |
| C | 14 | 254 | 160669 | 787.74 | 743 | 735 | 203.0 |
| C | 12 | 241 | 20873 | 99.19 | 743 | 735 | 203.0 |
| C | 11 | 244 | 18187 | 85.96 | 743 | 735 | 203.0 |
| D | 8 | 176 | 8846851 | 53321.77 | 577 | 550 | 165.9 |
| D | 2 | 172 | 595933 | 3588.72 | 577 | 550 | 165.9 |
| D | 7 | 70 | 220700 | 1326.97 | 577 | 550 | 165.9 |
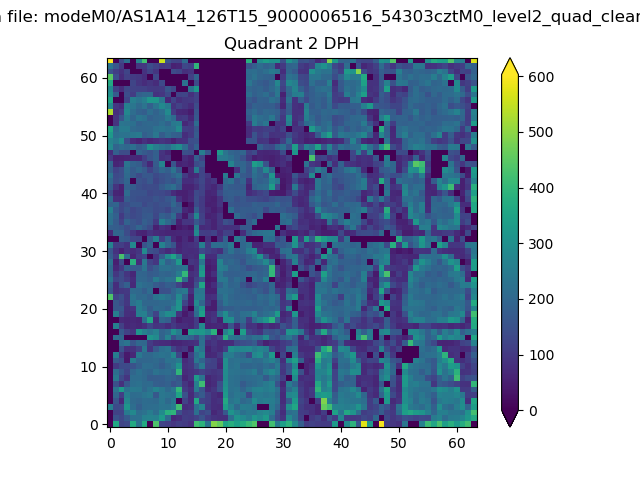
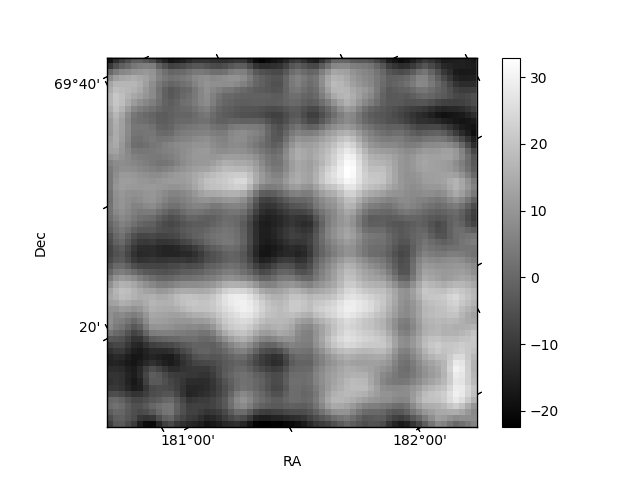
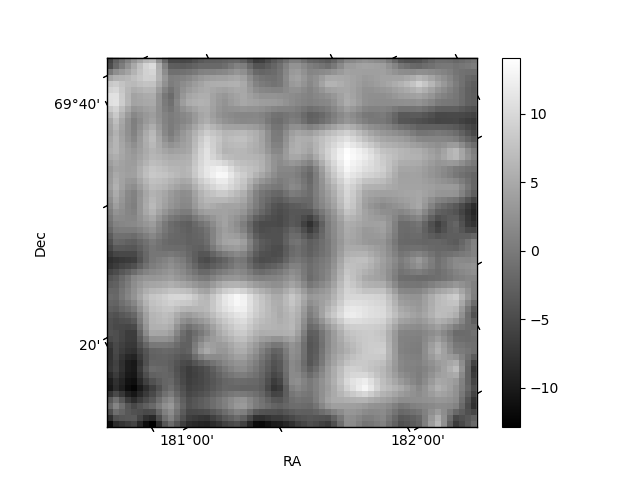
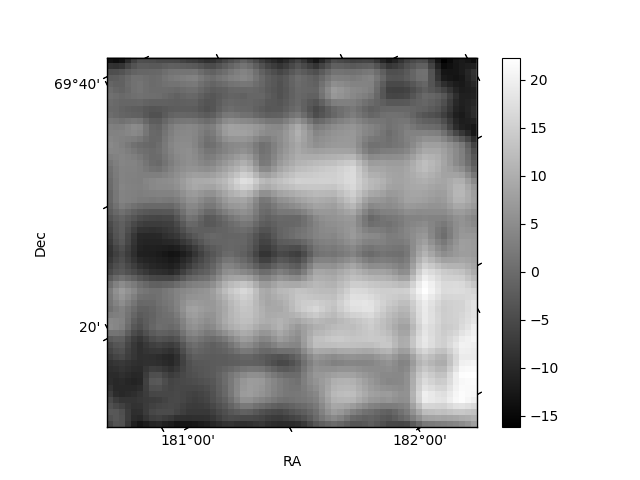
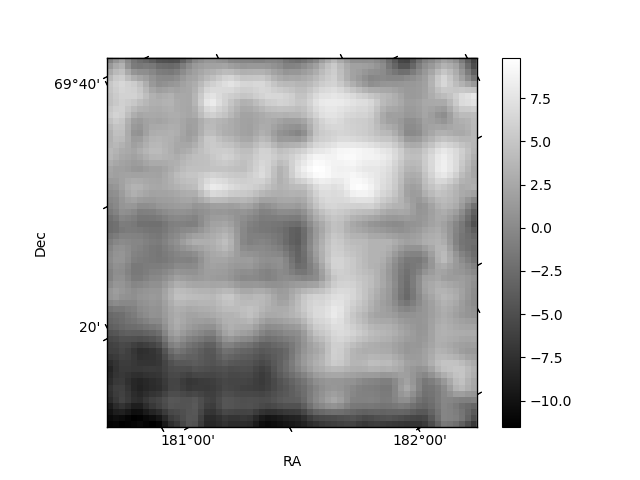
Histogram calculated using DETX and DETY for each event in the final _common_clean file
| Quadrant A | 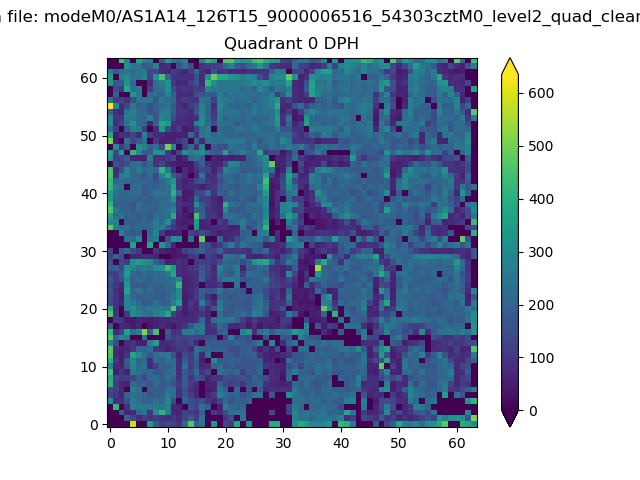 |
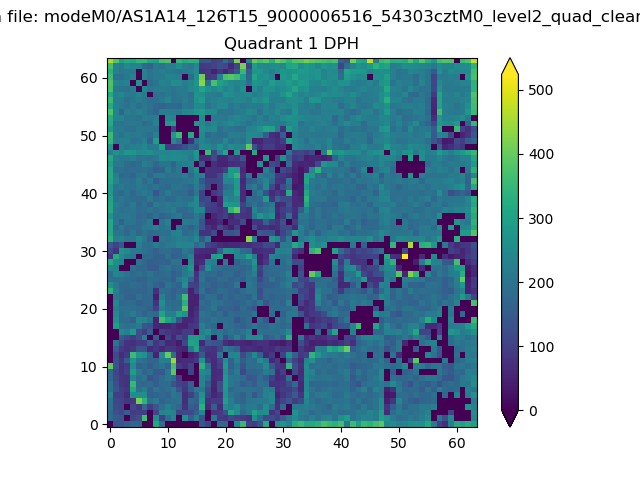 |
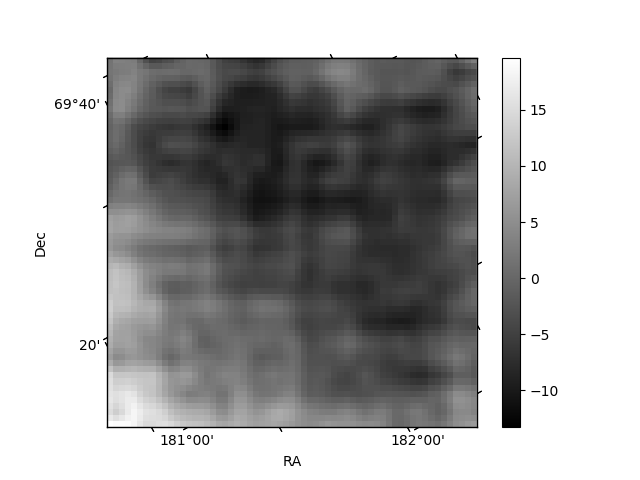
Quadrant B |
|---|---|---|---|
| Quadrant D | 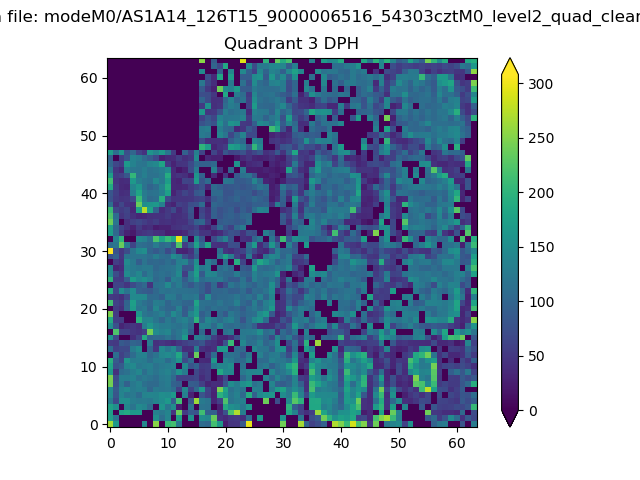 |
 |
Quadrant C |
| Plot type | Count rate plots | Images |
|---|---|---|
| Comparison with Poisson distribution Blue bars denote a histogram of data divided into 1 sec bins. Red curve is a Poisson curve with rate = median count rate of data. |
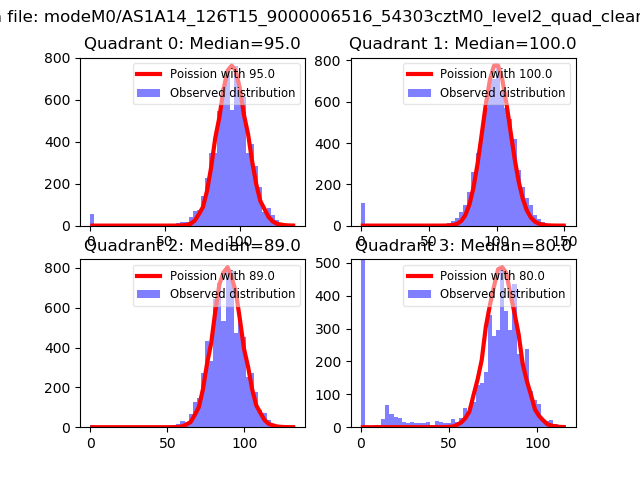 |
 |
| Quadrant-wise count rates Data is divided into 100 sec bins |
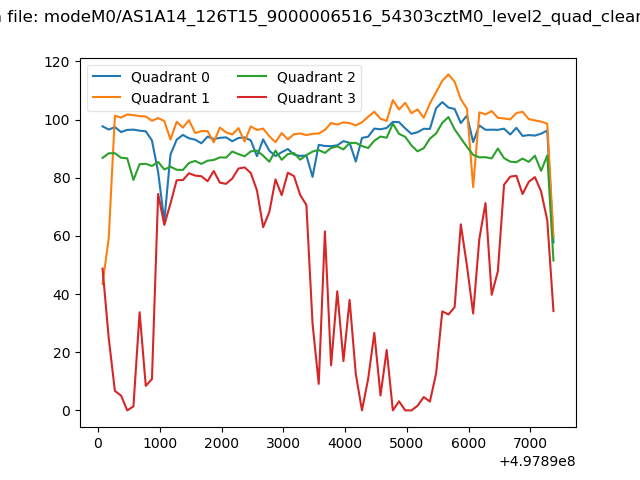 |
|
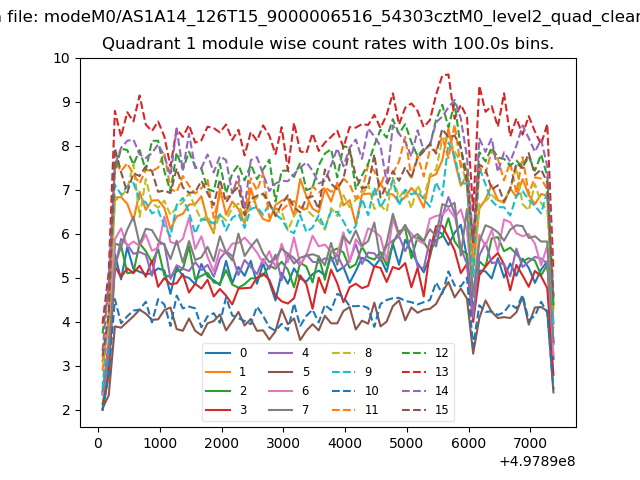
| Module-wise count rates for Quadrant A Data is divided into 100 sec bins |
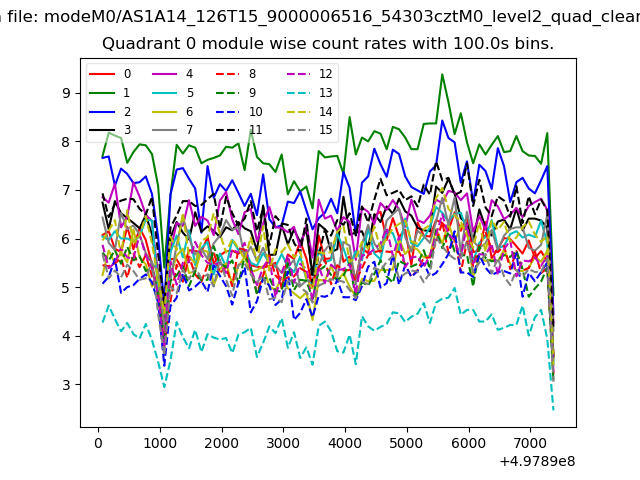 |
 |
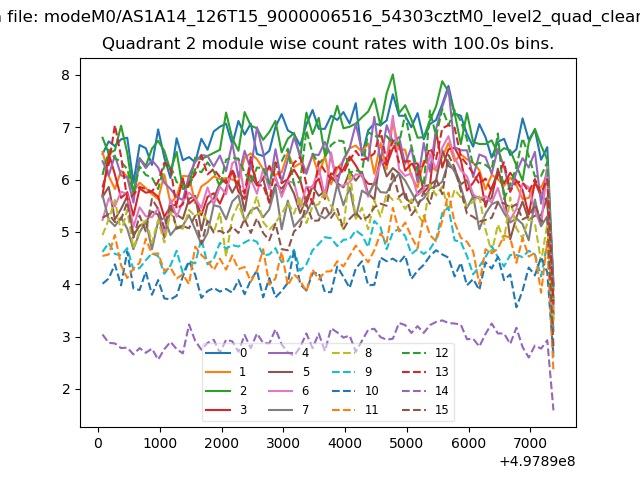
| Module-wise count rates for Quadrant B Data is divided into 100 sec bins |
 |
 |
| Module-wise count rates for Quadrant C Data is divided into 100 sec bins |
 |
 |
| Module-wise count rates for Quadrant D Data is divided into 100 sec bins |
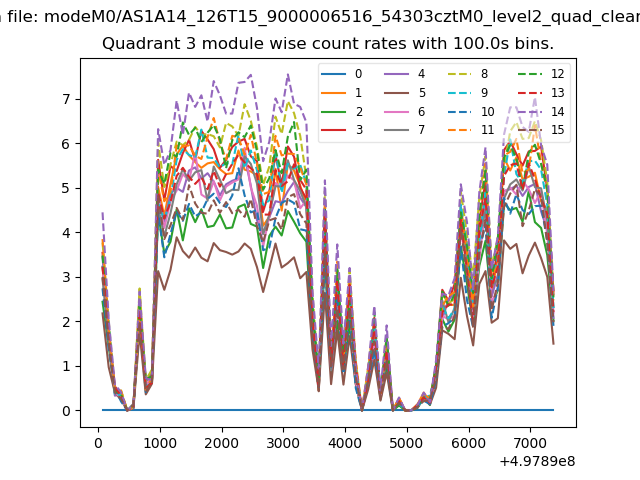 |
 |
| Parameter | Plot |
|---|---|
| CZT HV Monitor | 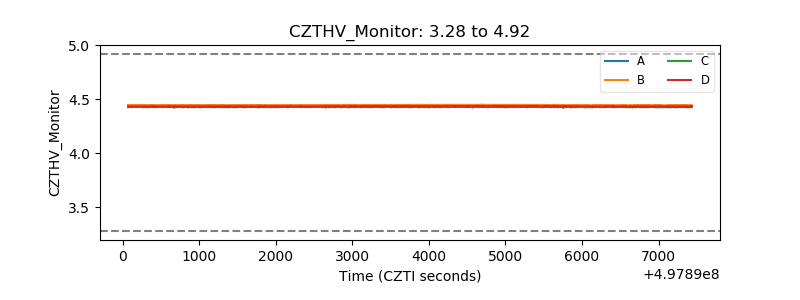 |
| D_VDD | 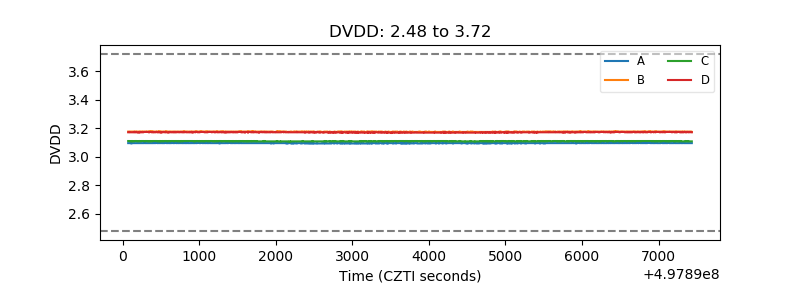 |
| Temperature 1 | 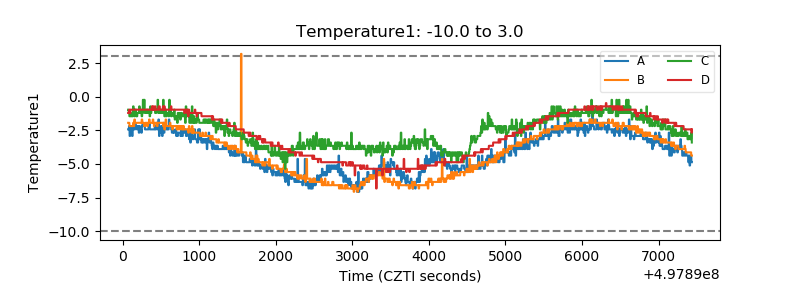 |
| Veto HV Monitor | 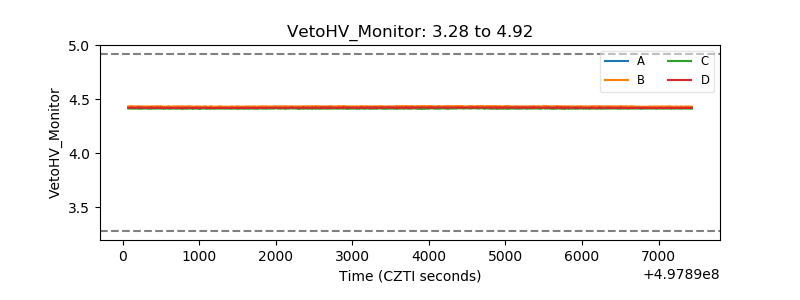 |
| Veto LLD | 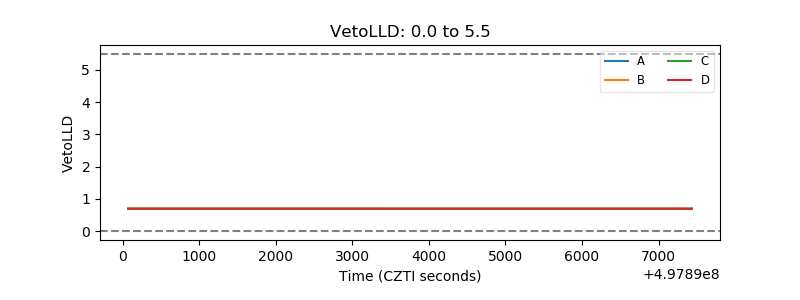 |
| Alpha Counter | 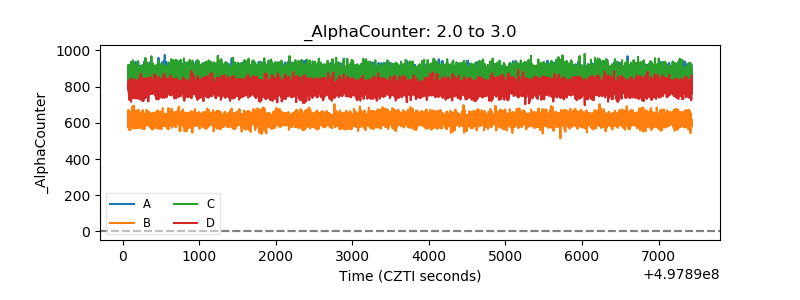 |
| _CPM_Rate | 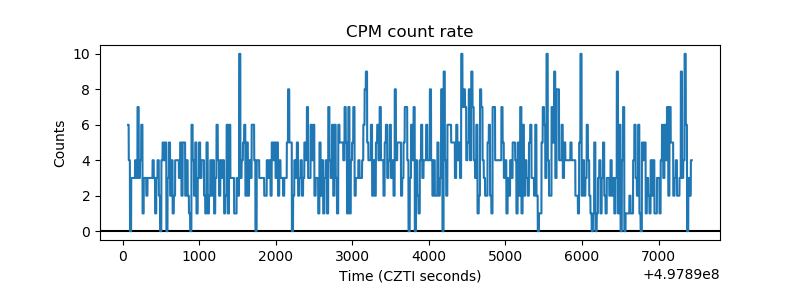 |
| CZT Counter | 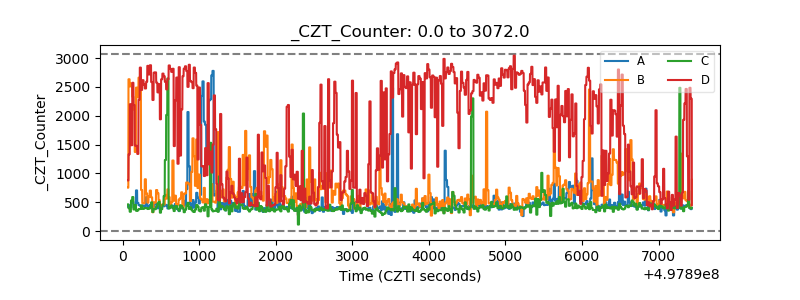 |
| +2.5 Volts monitor | 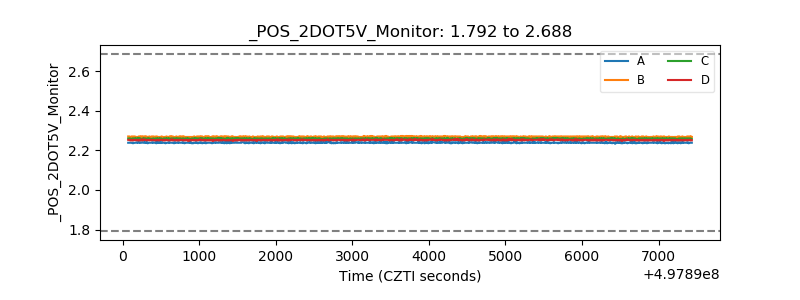 |
| +5 Volts monitor |  |
| _ROLL_ROT | 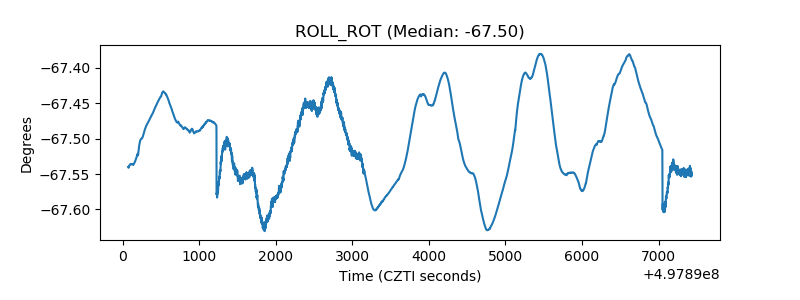 |
| _Roll_DEC | 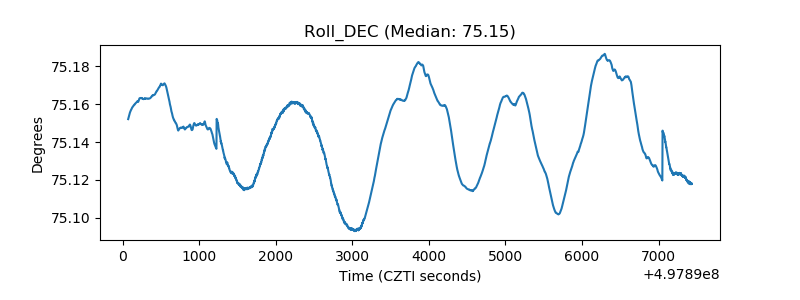 |
| _Roll_RA | 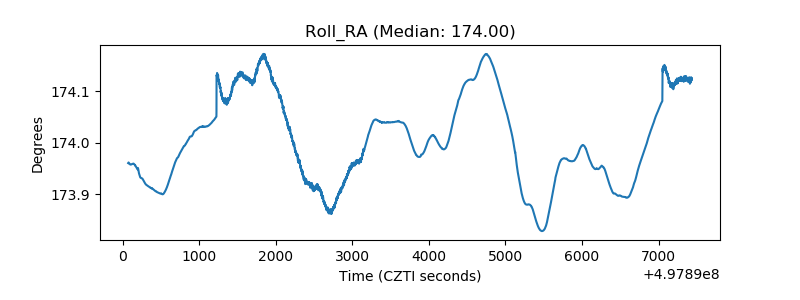 |
| Veto Counter | 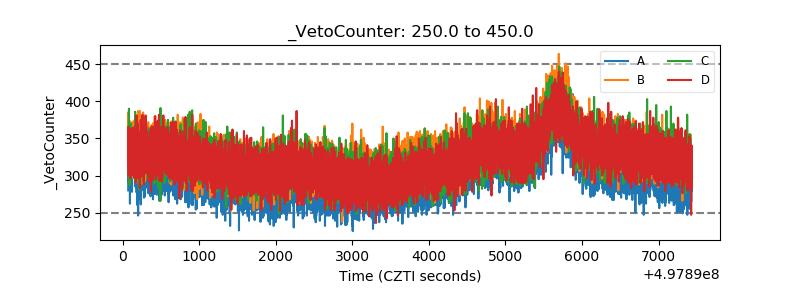 |