| Param | Original file | Final file |
|---|---|---|
| Filename | modeM0/AS1A14_126T15_9000006516_54304cztM0_level2.fits | modeM0/AS1A14_126T15_9000006516_54304cztM0_level2_quad_clean.evt |
| Size (bytes) | 703,753,920 | 96,554,880 |
| Size | 671.2 MB | 92.1 MB |
| Events in quadrant A | 3,833,795 | 684,729 |
| Events in quadrant B | 5,217,196 | 707,323 |
| Events in quadrant C | 7,106,556 | 547,411 |
| Events in quadrant D | 9,327,963 | 475,832 |
| Mode SS | |||
|---|---|---|---|
| Quadrant | BADHDUFLAG | Total packets | Discarded packets |
| A | 0 | 146 | 0 |
| B | 0 | 146 | 0 |
| C | 0 | 146 | 0 |
| D | 0 | 146 | 0 |
| Mode M0 | |||
|---|---|---|---|
| Quadrant | BADHDUFLAG | Total packets | Discarded packets |
| A | 0 | 16699 | 0 |
| B | 0 | 20451 | 0 |
| C | 0 | 26495 | 0 |
| D | 0 | 32774 | 0 |
| Quadrant | Total seconds | Saturated seconds | Saturation percentage |
|---|---|---|---|
| A | 7295 | 117 | 1.603838% |
| B | 7295 | 290 | 3.975326% |
| C | 7295 | 1328 | 18.204249% |
| D | 7295 | 1851 | 25.373544% |
Noise dominated data is calculated using 1-second bins in cleaned event files. If a bin has >2000 counts, and if more than 50% of those come from <1% of pixels, then it is considered to be noise-dominated and hence unusable.
| Quadrant | # 1 sec bins | Bins with >0 counts | Bins with >2000 counts | High rate bins dominated by noise | Noise dominated (total time) | Noise dominated (detector-on time) | Marked lightcurve |
|---|---|---|---|---|---|---|---|
| A | 7295 | 7295 | 78 | 78 | 1.07% | 1.07% | 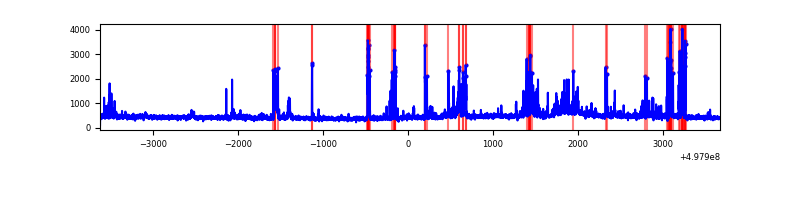 |
| B | 7295 | 7295 | 226 | 226 | 3.10% | 3.10% | 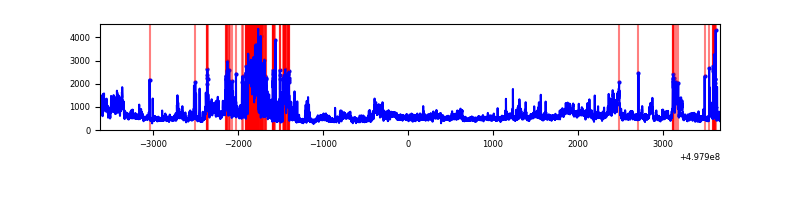 |
| C | 7295 | 7295 | 984 | 984 | 13.49% | 13.49% | 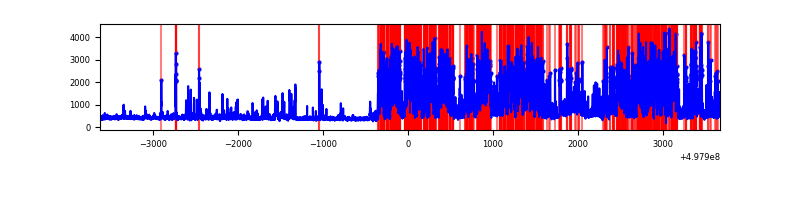 |
| D | 7295 | 7295 | 1619 | 1619 | 22.19% | 22.19% | 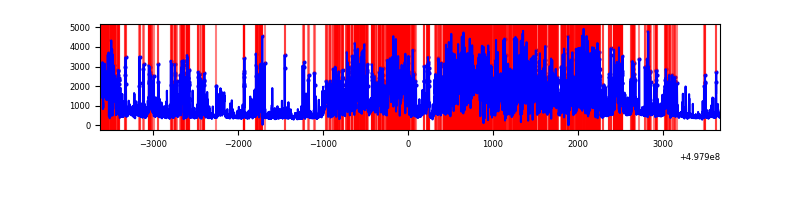 |
Top three noisy pixels from each quadrant. If the there are fewer than three noisy pixels in the level2.evt file, extra rows are filled as -1
| Pixel properties | Quadrant properties | ||||||
|---|---|---|---|---|---|---|---|
| Quadrant | DetID | PixID | Counts | Sigma | Mean | Median | Sigma |
| A | 7 | 29 | 461037 | 2427.36 | 764 | 744 | 189.6 |
| A | 0 | 8 | 161797 | 849.31 | 764 | 744 | 189.6 |
| A | 4 | 3 | 76598 | 400.02 | 764 | 744 | 189.6 |
| B | 7 | 0 | 1366658 | 8478.76 | 745 | 718 | 161.1 |
| B | 5 | 185 | 600912 | 3725.57 | 745 | 718 | 161.1 |
| B | 7 | 252 | 100147 | 617.18 | 745 | 718 | 161.1 |
| C | 15 | 157 | 3946744 | 20831.19 | 688 | 684 | 189.4 |
| C | 14 | 254 | 146025 | 767.25 | 688 | 684 | 189.4 |
| C | 1 | 241 | 108261 | 567.9 | 688 | 684 | 189.4 |
| D | 8 | 176 | 5691530 | 30189.02 | 660 | 628 | 188.5 |
| D | 7 | 70 | 393112 | 2082.04 | 660 | 628 | 188.5 |
| D | 3 | 12 | 263000 | 1391.83 | 660 | 628 | 188.5 |
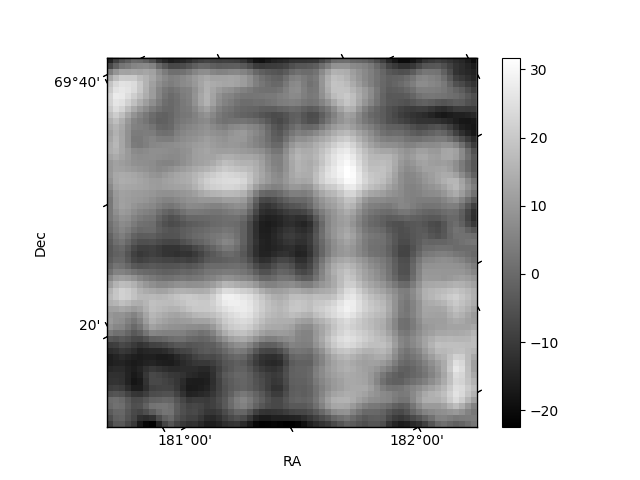
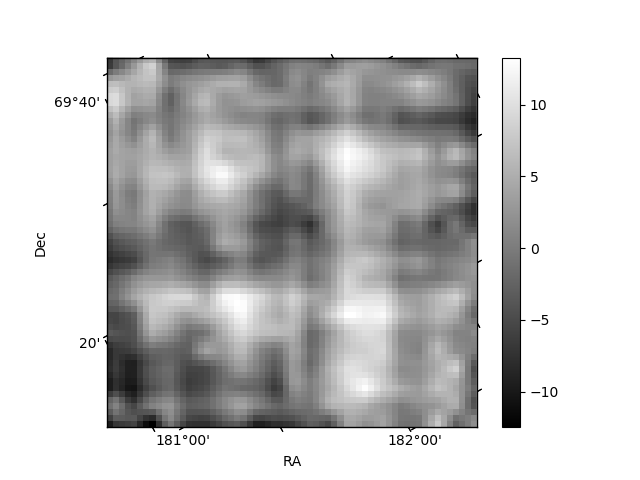
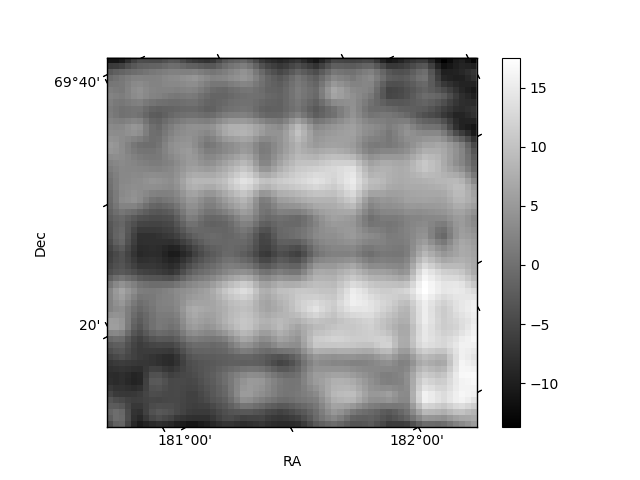
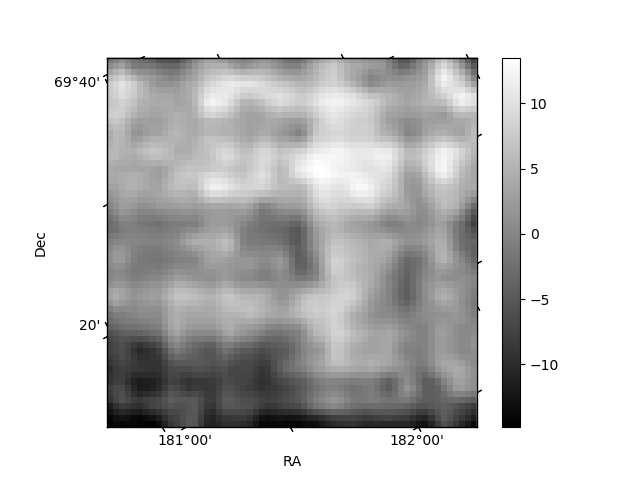
Histogram calculated using DETX and DETY for each event in the final _common_clean file
| Quadrant A | 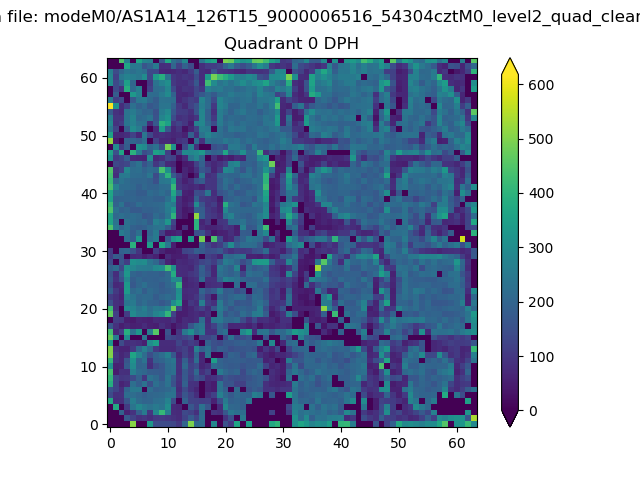 |
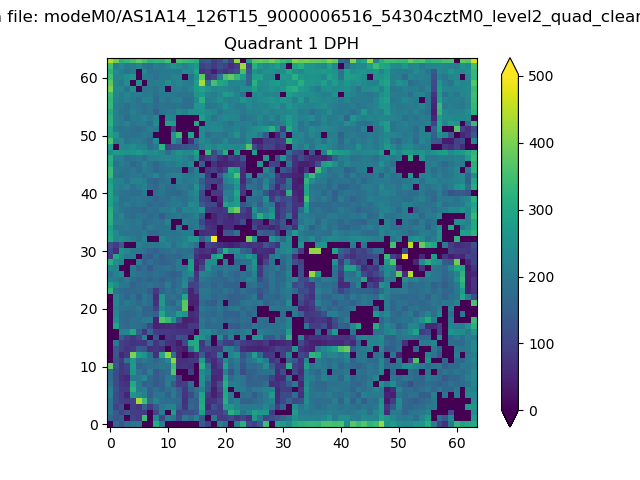 |
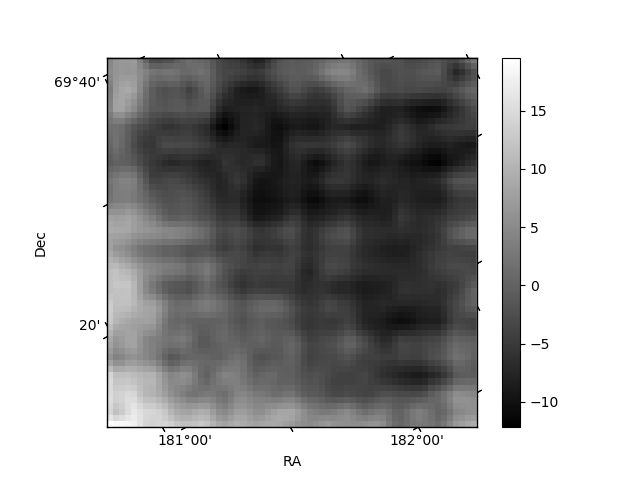
Quadrant B |
|---|---|---|---|
| Quadrant D | 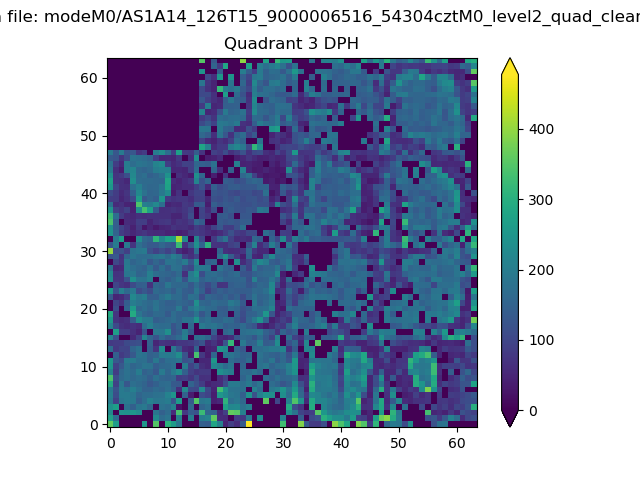 |
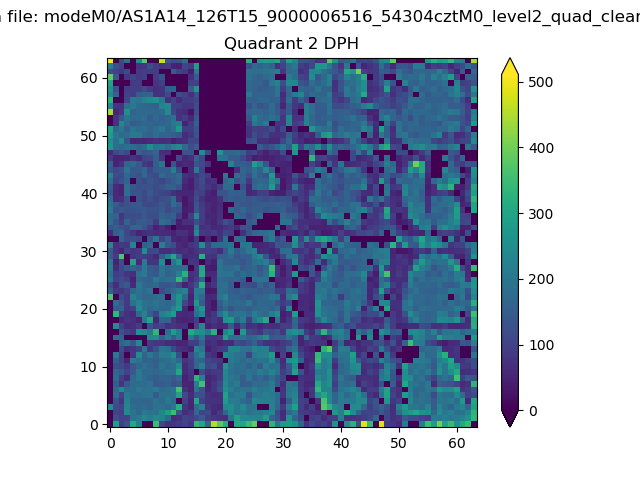 |
Quadrant C |
| Plot type | Count rate plots | Images |
|---|---|---|
| Comparison with Poisson distribution Blue bars denote a histogram of data divided into 1 sec bins. Red curve is a Poisson curve with rate = median count rate of data. |
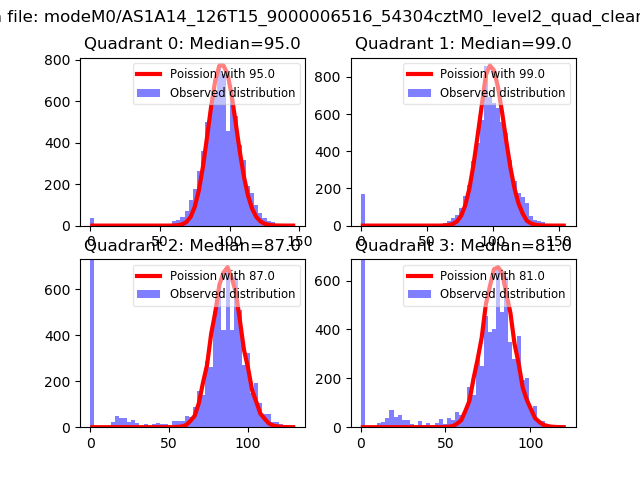 |
 |
| Quadrant-wise count rates Data is divided into 100 sec bins |
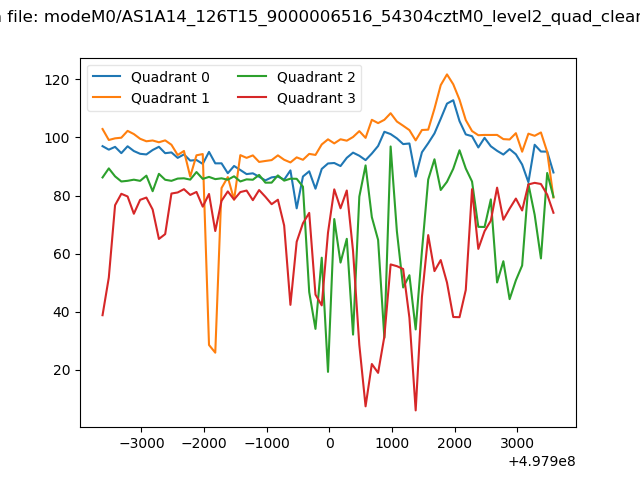 |
|
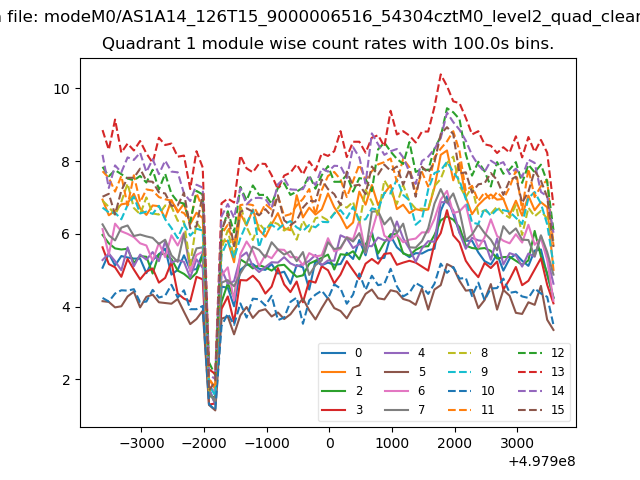
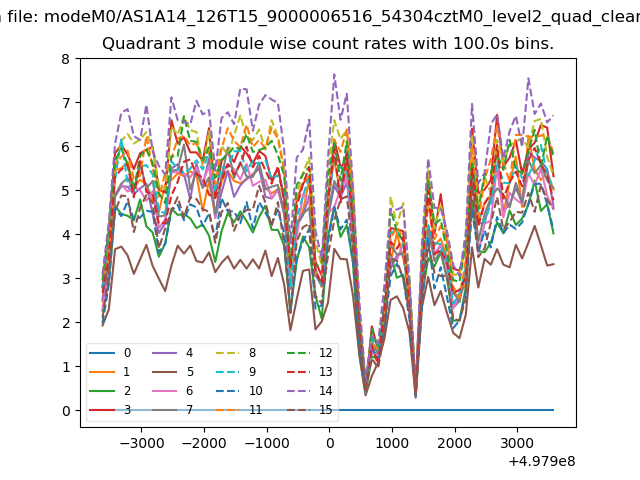
| Module-wise count rates for Quadrant A Data is divided into 100 sec bins |
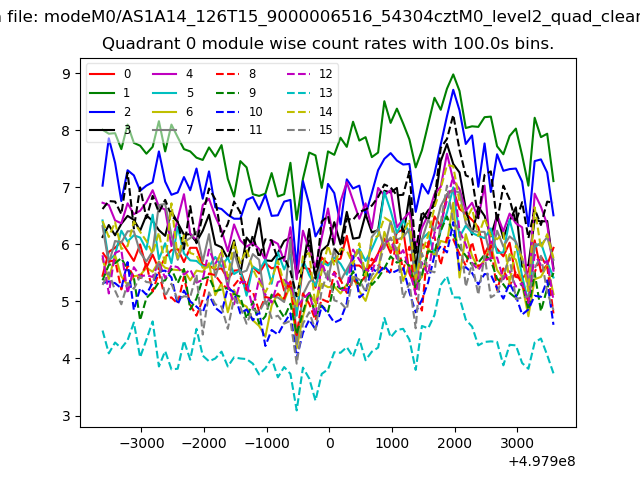 |
 |
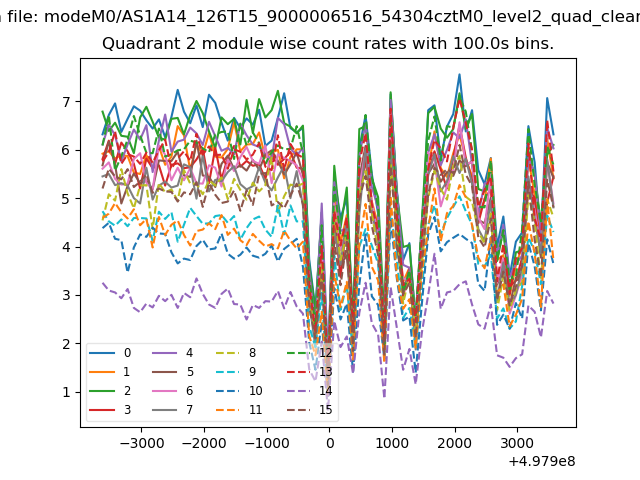
| Module-wise count rates for Quadrant B Data is divided into 100 sec bins |
 |
 |
| Module-wise count rates for Quadrant C Data is divided into 100 sec bins |
 |
 |
| Module-wise count rates for Quadrant D Data is divided into 100 sec bins |
 |
 |
| Parameter | Plot |
|---|---|
| CZT HV Monitor |  |
| D_VDD | 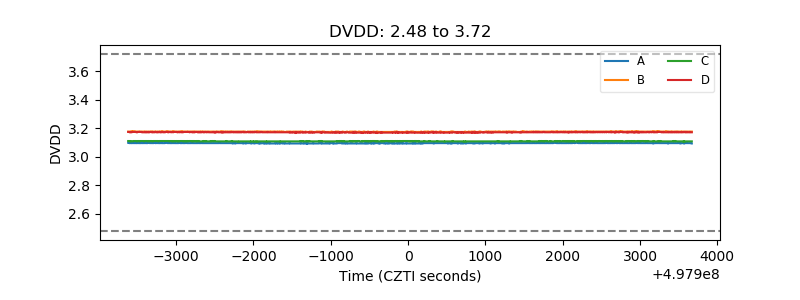 |
| Temperature 1 | 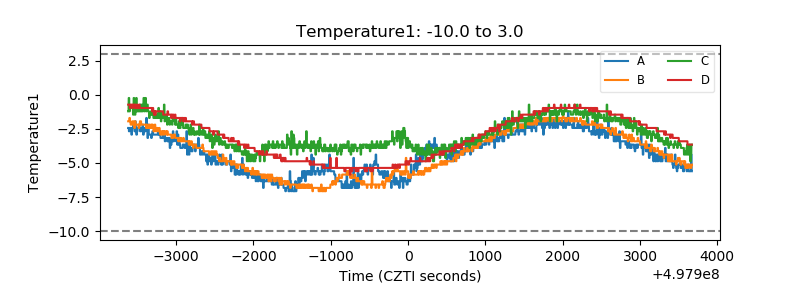 |
| Veto HV Monitor | 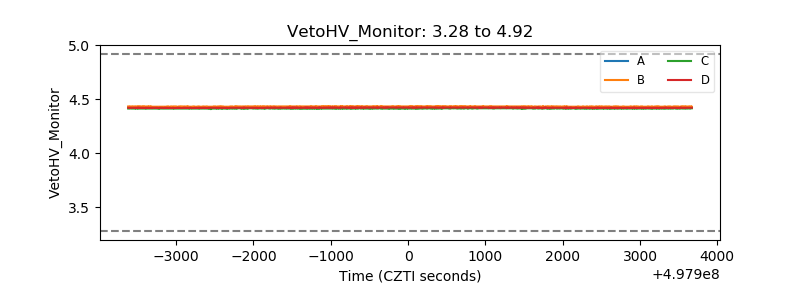 |
| Veto LLD | 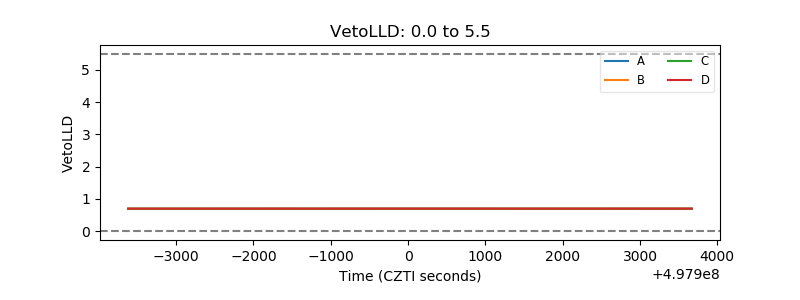 |
| Alpha Counter | 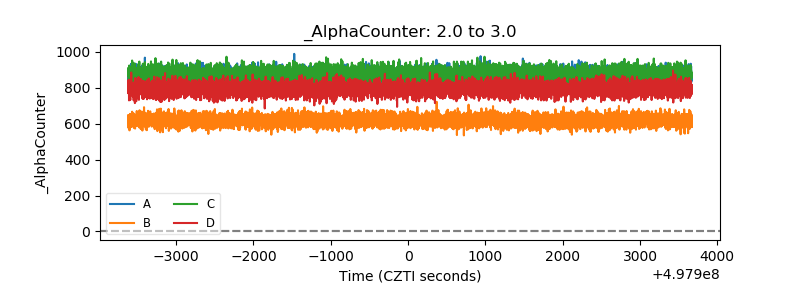 |
| _CPM_Rate | 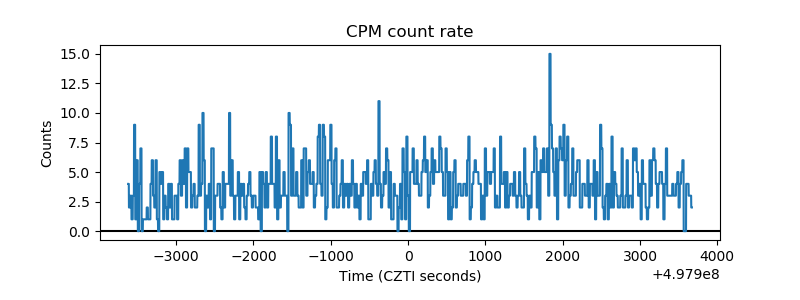 |
| CZT Counter | 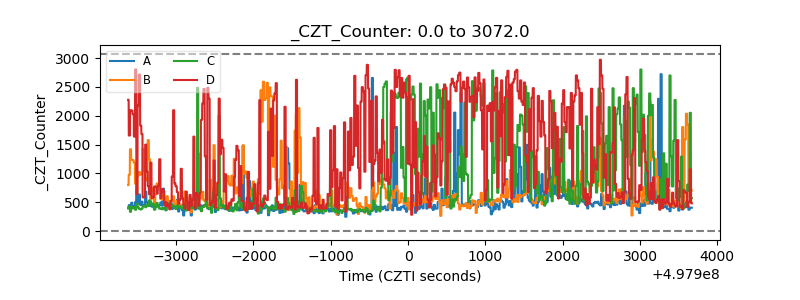 |
| +2.5 Volts monitor |  |
| +5 Volts monitor | 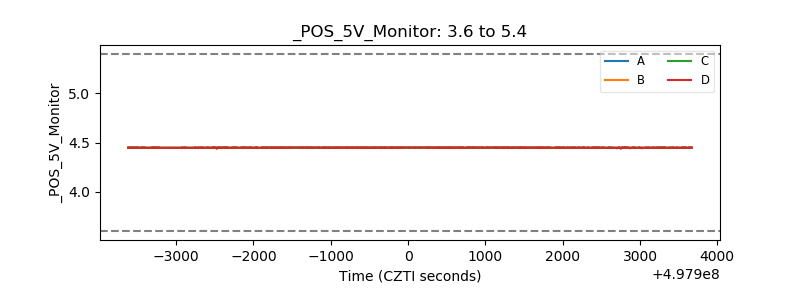 |
| _ROLL_ROT | 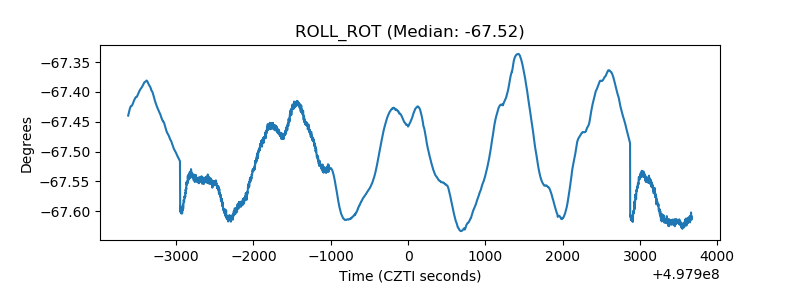 |
| _Roll_DEC | 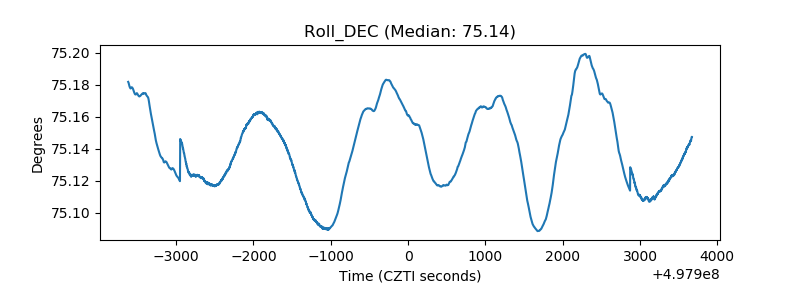 |
| _Roll_RA | 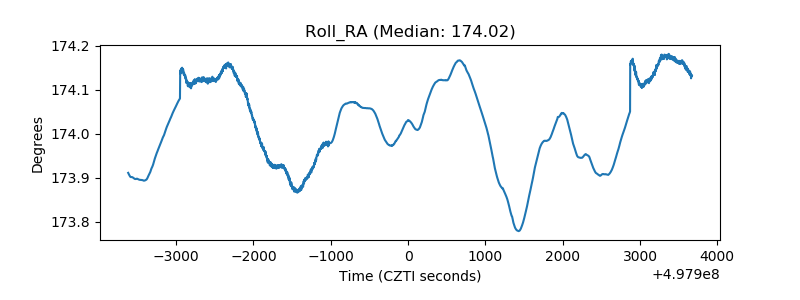 |
| Veto Counter | 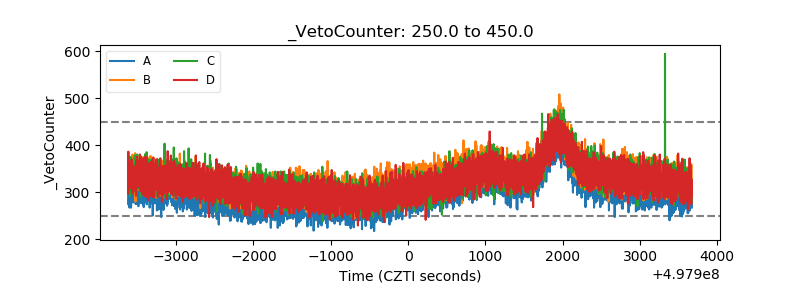 |