| Param | Original file | Final file |
|---|---|---|
| Filename | modeM0/AS1A14_126T15_9000006516_54307cztM0_level2.fits | modeM0/AS1A14_126T15_9000006516_54307cztM0_level2_quad_clean.evt |
| Size (bytes) | 2,049,592,320 | 235,768,320 |
| Size | 1.9 GB | 224.8 MB |
| Events in quadrant A | 10,445,612 | 1,780,839 |
| Events in quadrant B | 12,025,400 | 1,821,120 |
| Events in quadrant C | 21,374,139 | 1,325,912 |
| Events in quadrant D | 30,537,588 | 884,085 |
| Mode SS | |||
|---|---|---|---|
| Quadrant | BADHDUFLAG | Total packets | Discarded packets |
| A | 0 | 390 | 0 |
| B | 0 | 390 | 0 |
| C | 0 | 390 | 0 |
| D | 0 | 390 | 0 |
| Mode M0 | |||
|---|---|---|---|
| Quadrant | BADHDUFLAG | Total packets | Discarded packets |
| A | 0 | 45350 | 4 |
| B | 0 | 49098 | 4 |
| C | 0 | 77207 | 5 |
| D | 0 | 104219 | 4 |
| Mode M9 | |||
|---|---|---|---|
| Quadrant | BADHDUFLAG | Total packets | Discarded packets |
| A | 0 | 15 | 0 |
| B | 0 | 15 | 0 |
| C | 0 | 15 | 0 |
| D | 0 | 15 | 0 |
| Quadrant | Total seconds | Saturated seconds | Saturation percentage |
|---|---|---|---|
| A | 19247 | 539 | 2.800436% |
| B | 19248 | 839 | 4.358894% |
| C | 19247 | 4464 | 23.193225% |
| D | 19247 | 8480 | 44.058814% |
Noise dominated data is calculated using 1-second bins in cleaned event files. If a bin has >2000 counts, and if more than 50% of those come from <1% of pixels, then it is considered to be noise-dominated and hence unusable.
| Quadrant | # 1 sec bins | Bins with >0 counts | Bins with >2000 counts | High rate bins dominated by noise | Noise dominated (total time) | Noise dominated (detector-on time) | Marked lightcurve |
|---|---|---|---|---|---|---|---|
| A | 20593 | 19251 | 356 | 356 | 1.73% | 1.85% | 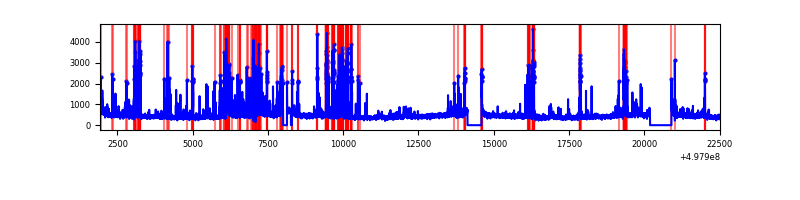 |
| B | 20594 | 19252 | 594 | 594 | 2.88% | 3.09% | 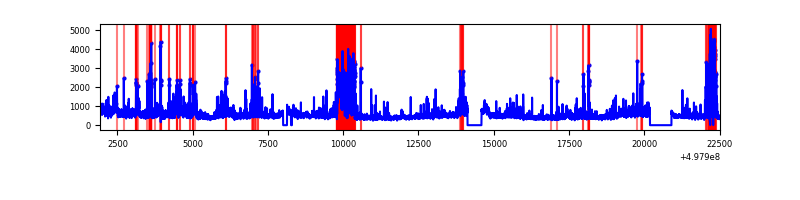 |
| C | 20593 | 19251 | 3820 | 3820 | 18.55% | 19.84% | 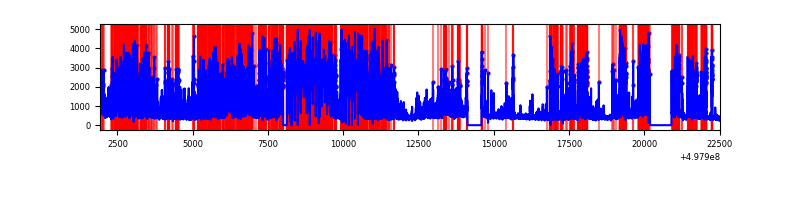 |
| D | 20593 | 19250 | 6898 | 6898 | 33.50% | 35.83% | 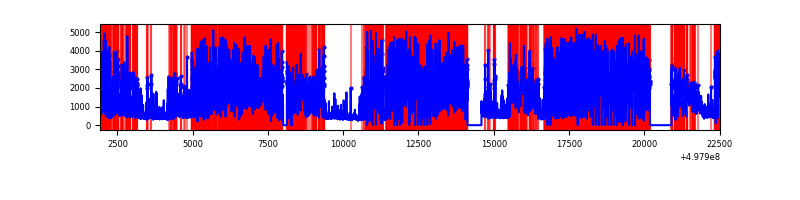 |
Top three noisy pixels from each quadrant. If the there are fewer than three noisy pixels in the level2.evt file, extra rows are filled as -1
| Pixel properties | Quadrant properties | ||||||
|---|---|---|---|---|---|---|---|
| Quadrant | DetID | PixID | Counts | Sigma | Mean | Median | Sigma |
| A | 0 | 8 | 930840 | 1864.96 | 2013 | 1963 | 498.1 |
| A | 3 | 130 | 637308 | 1275.62 | 2013 | 1963 | 498.1 |
| A | 7 | 29 | 412369 | 824.0 | 2013 | 1963 | 498.1 |
| B | 10 | 245 | 1560108 | 3678.77 | 1980 | 1905 | 423.6 |
| B | 7 | 0 | 1413655 | 3333.01 | 1980 | 1905 | 423.6 |
| B | 10 | 247 | 212924 | 498.2 | 1980 | 1905 | 423.6 |
| C | 1 | 241 | 7315624 | 15604.7 | 1711 | 1698 | 468.7 |
| C | 15 | 157 | 6265547 | 13364.3 | 1711 | 1698 | 468.7 |
| C | 14 | 254 | 518189 | 1101.96 | 1711 | 1698 | 468.7 |
| D | 8 | 176 | 19392052 | 46415.9 | 1464 | 1396 | 417.8 |
| D | 2 | 172 | 2634789 | 6303.62 | 1464 | 1396 | 417.8 |
| D | 2 | 62 | 1131947 | 2706.23 | 1464 | 1396 | 417.8 |
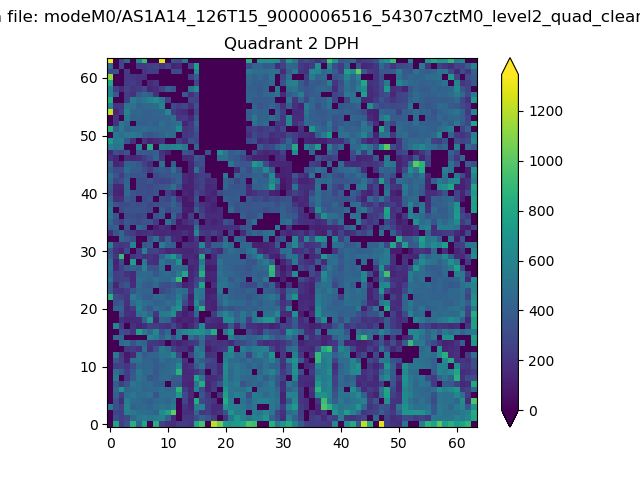
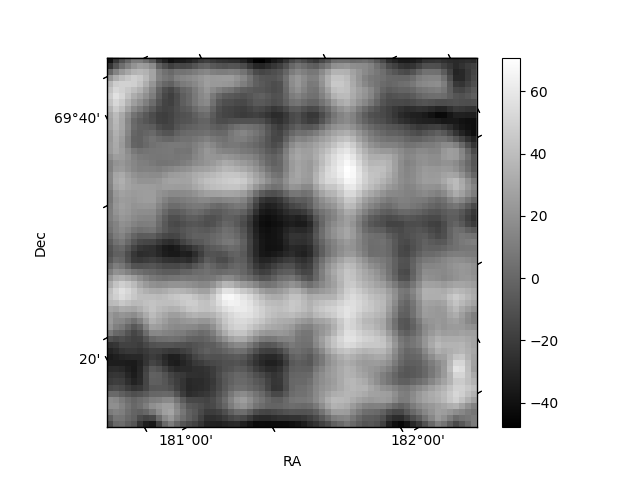
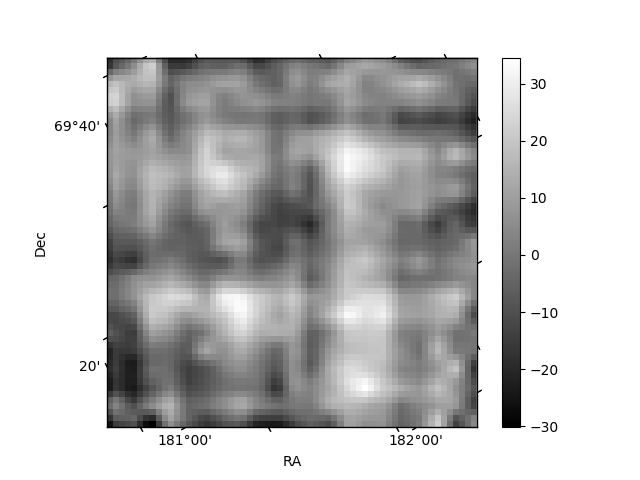
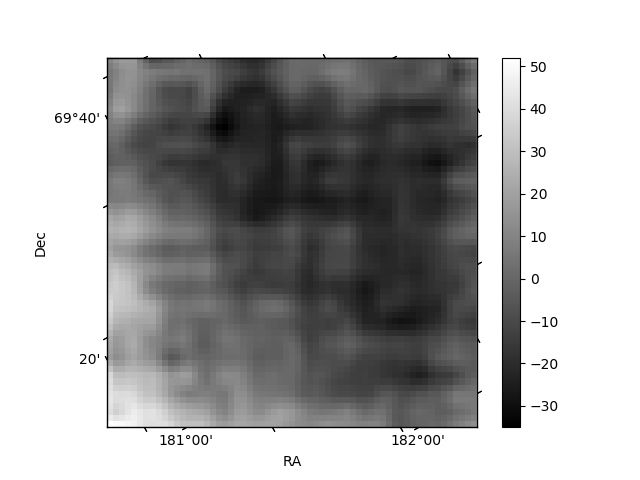
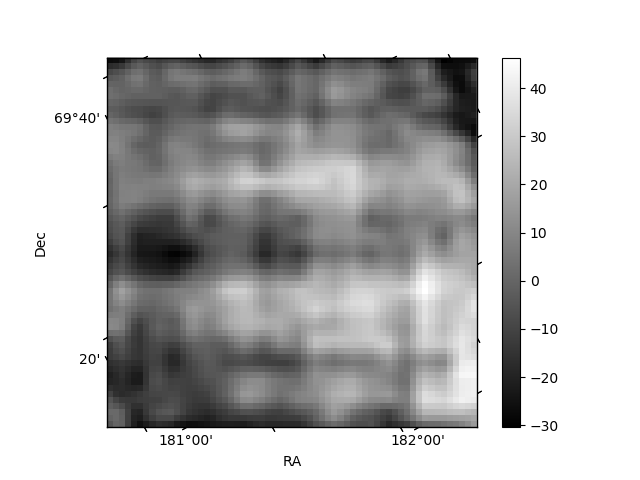
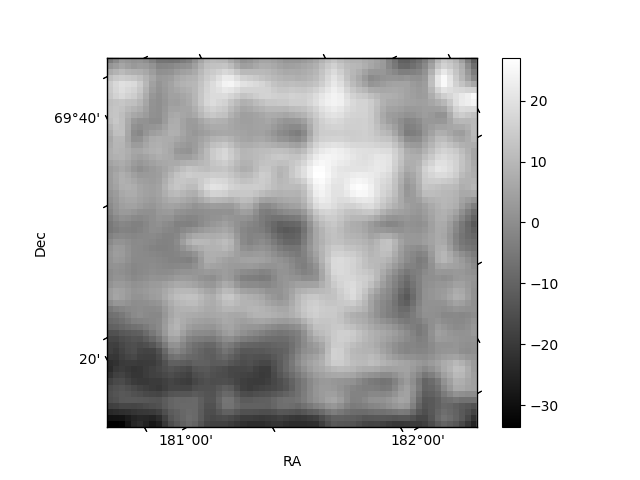
Histogram calculated using DETX and DETY for each event in the final _common_clean file
| Quadrant A | 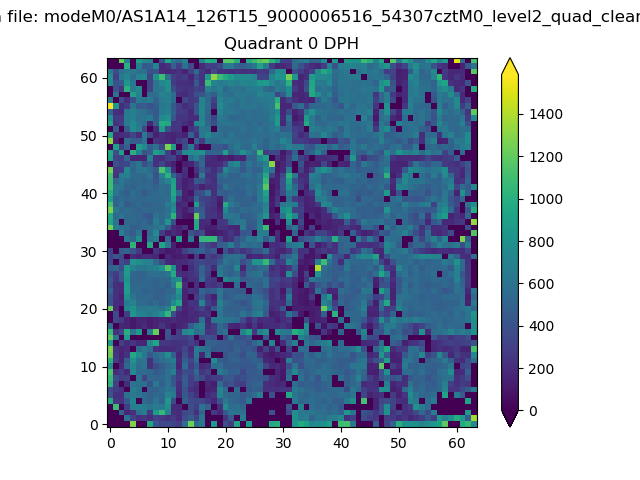 |
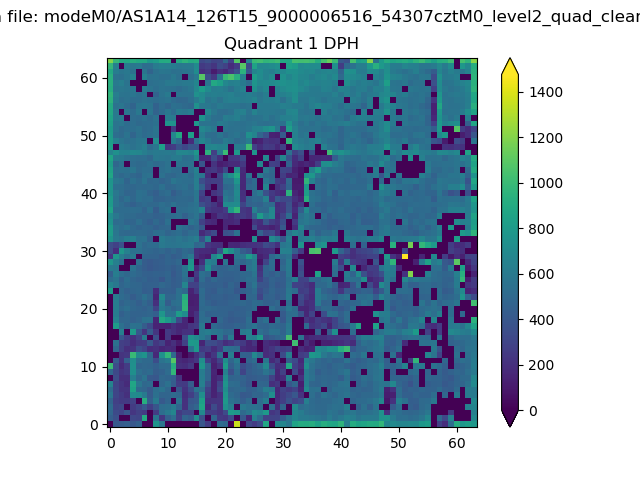 |
Quadrant B |
|---|---|---|---|
| Quadrant D | 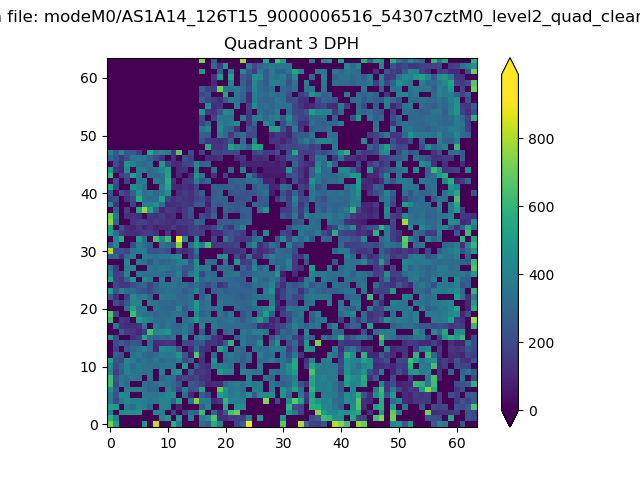 |
 |
Quadrant C |
| Plot type | Count rate plots | Images |
|---|---|---|
| Comparison with Poisson distribution Blue bars denote a histogram of data divided into 1 sec bins. Red curve is a Poisson curve with rate = median count rate of data. |
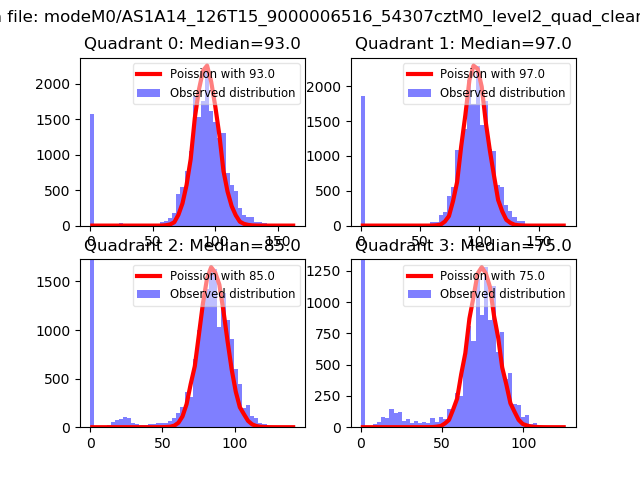 |
 |
| Quadrant-wise count rates Data is divided into 100 sec bins |
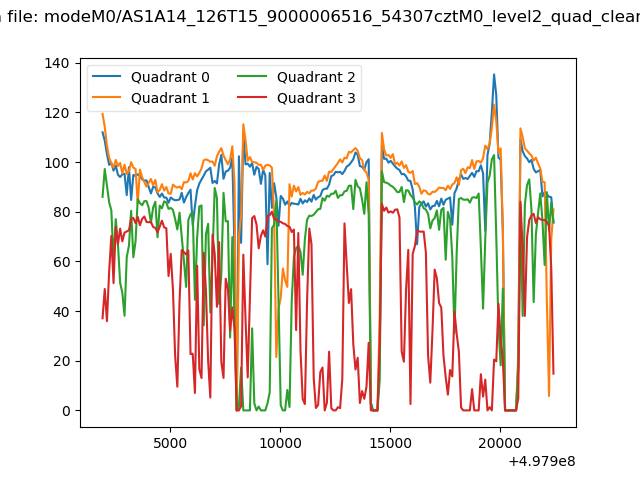 |
|
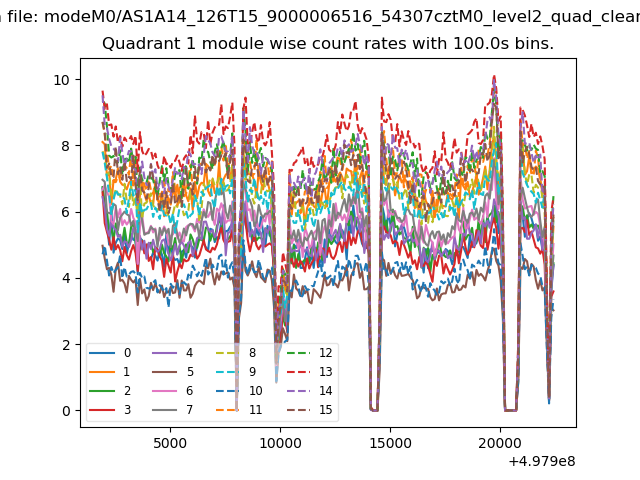
| Module-wise count rates for Quadrant A Data is divided into 100 sec bins |
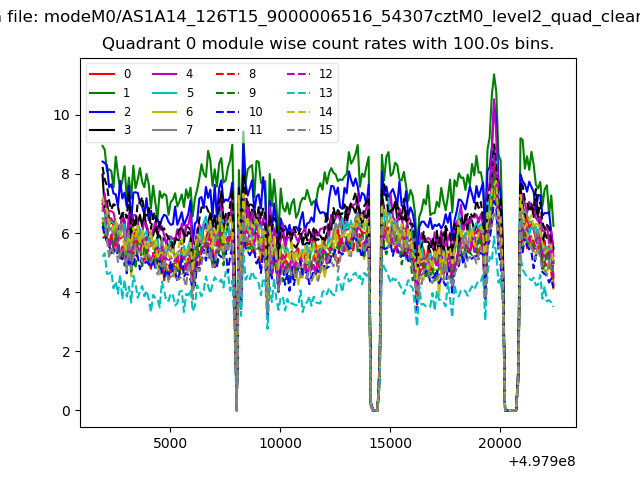 |
 |
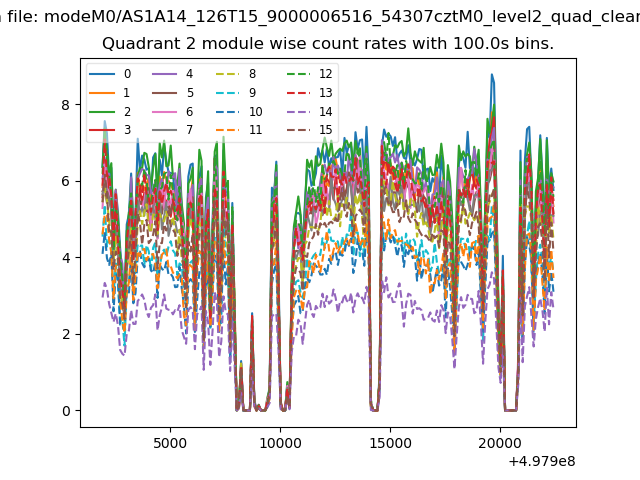
| Module-wise count rates for Quadrant B Data is divided into 100 sec bins |
 |
 |
| Module-wise count rates for Quadrant C Data is divided into 100 sec bins |
 |
 |
| Module-wise count rates for Quadrant D Data is divided into 100 sec bins |
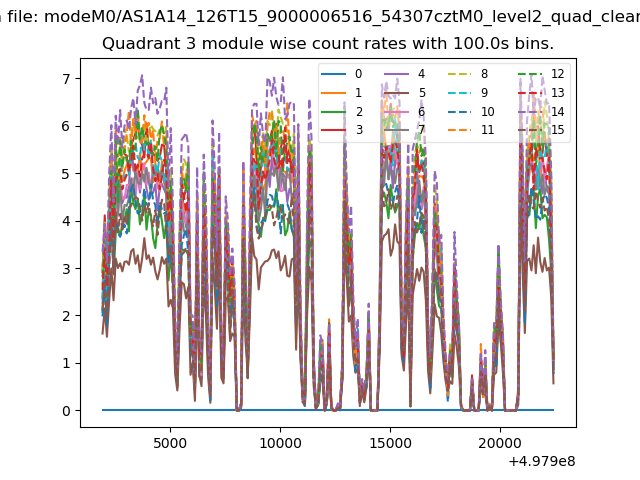 |
 |
| Parameter | Plot |
|---|---|
| CZT HV Monitor | 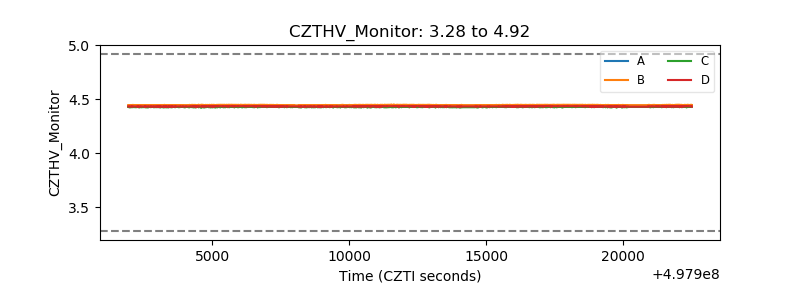 |
| D_VDD | 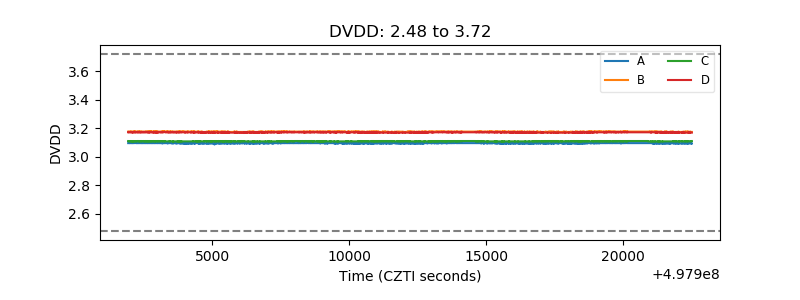 |
| Temperature 1 | 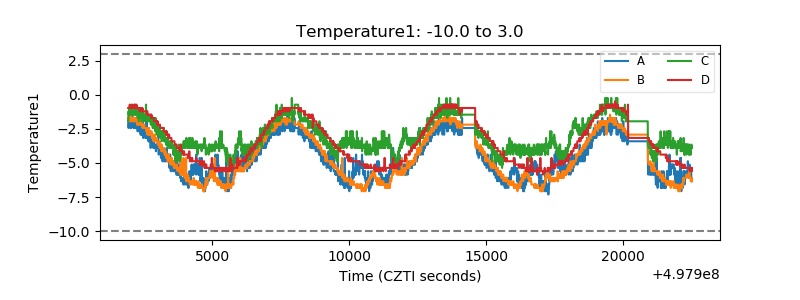 |
| Veto HV Monitor | 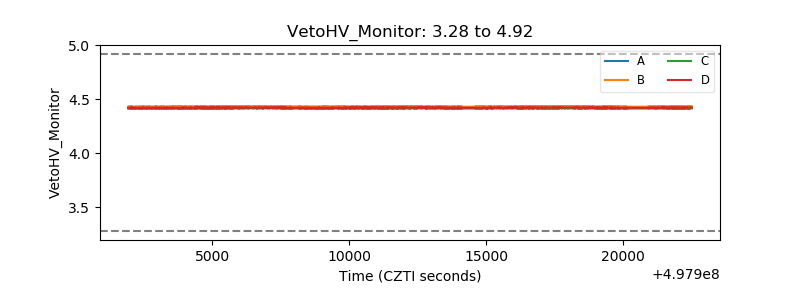 |
| Veto LLD | 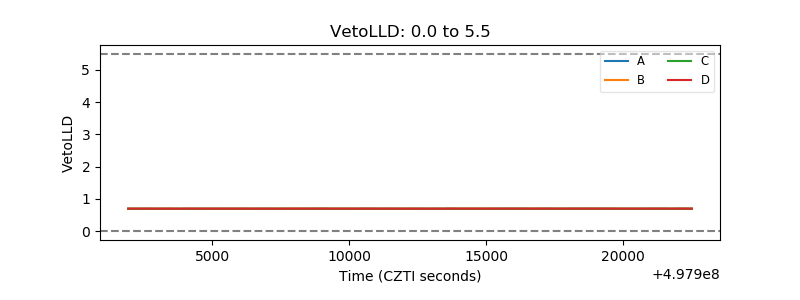 |
| Alpha Counter | 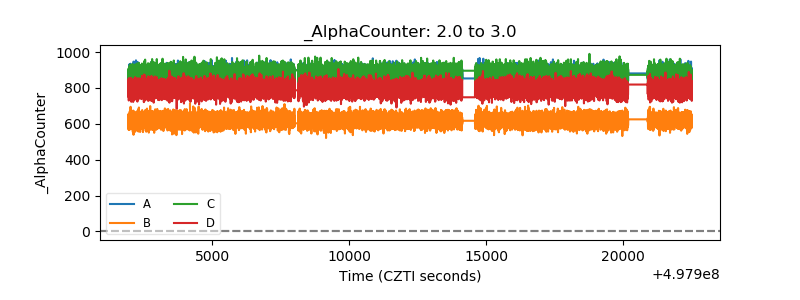 |
| _CPM_Rate | 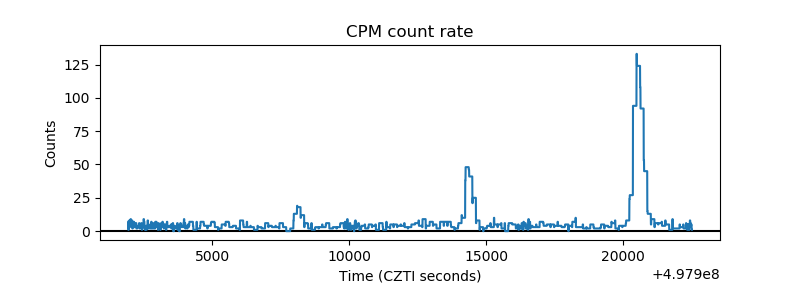 |
| CZT Counter | 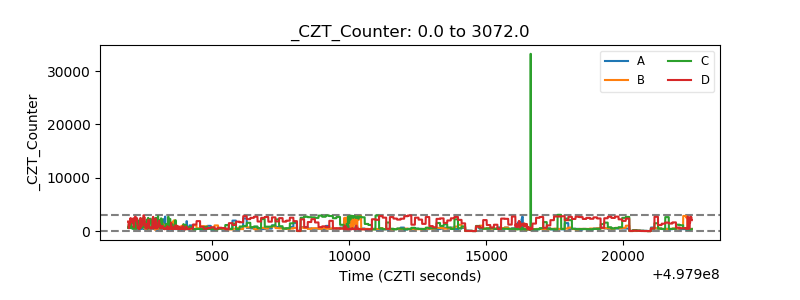 |
| +2.5 Volts monitor | 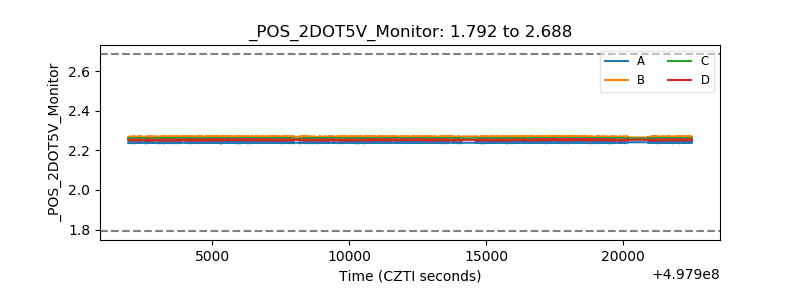 |
| +5 Volts monitor | 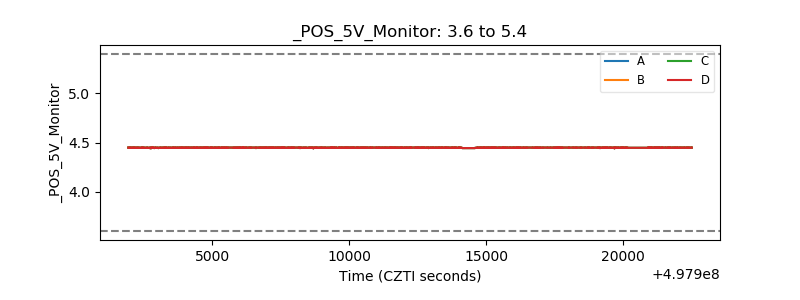 |
| _ROLL_ROT | 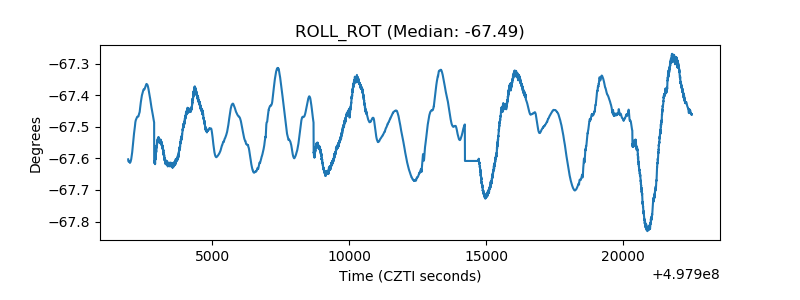 |
| _Roll_DEC | 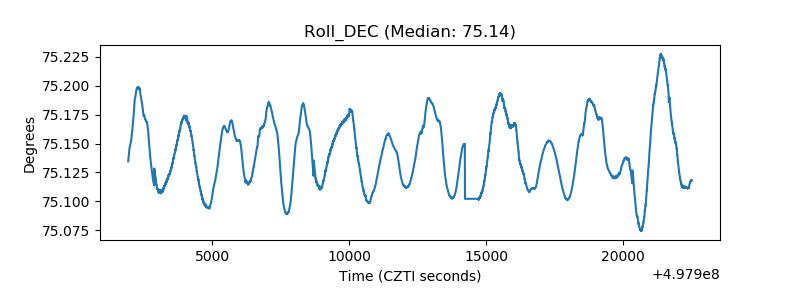 |
| _Roll_RA | 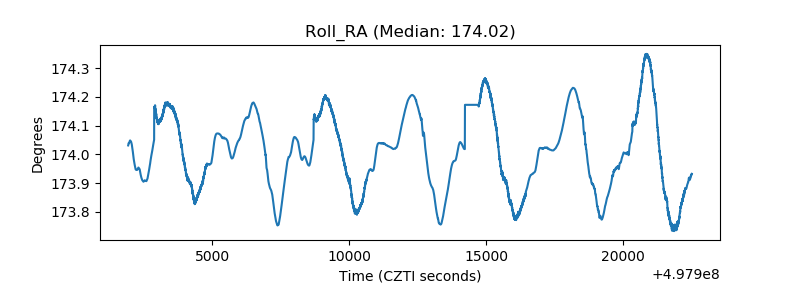 |
| Veto Counter | 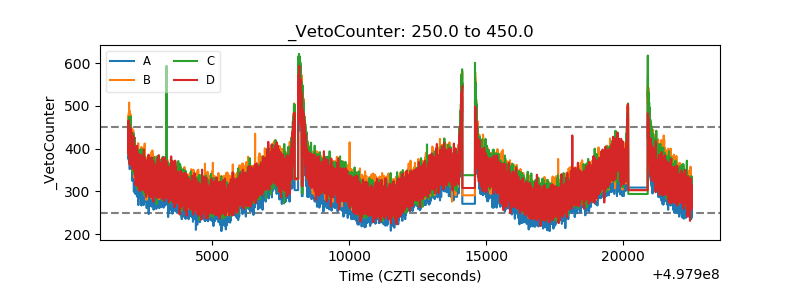 |