| Param | Original file | Final file |
|---|---|---|
| Filename | modeM0/AS1A14_126T15_9000006516_54308cztM0_level2.fits | modeM0/AS1A14_126T15_9000006516_54308cztM0_level2_quad_clean.evt |
| Size (bytes) | 673,580,160 | 85,152,960 |
| Size | 642.4 MB | 81.2 MB |
| Events in quadrant A | 3,172,240 | 630,242 |
| Events in quadrant B | 3,985,639 | 652,981 |
| Events in quadrant C | 4,168,500 | 575,041 |
| Events in quadrant D | 13,080,606 | 247,403 |
| Mode SS | |||
|---|---|---|---|
| Quadrant | BADHDUFLAG | Total packets | Discarded packets |
| A | 0 | 138 | 0 |
| B | 0 | 138 | 0 |
| C | 0 | 138 | 0 |
| D | 0 | 138 | 0 |
| Mode M0 | |||
|---|---|---|---|
| Quadrant | BADHDUFLAG | Total packets | Discarded packets |
| A | 0 | 14444 | 1 |
| B | 0 | 16518 | 1 |
| C | 0 | 17557 | 1 |
| D | 0 | 43463 | 1 |
| Mode M9 | |||
|---|---|---|---|
| Quadrant | BADHDUFLAG | Total packets | Discarded packets |
| A | 0 | 8 | 0 |
| B | 0 | 8 | 0 |
| C | 0 | 8 | 0 |
| D | 0 | 8 | 0 |
| Quadrant | Total seconds | Saturated seconds | Saturation percentage |
|---|---|---|---|
| A | 6777 | 61 | 0.900103% |
| B | 6777 | 281 | 4.146377% |
| C | 6778 | 432 | 6.373562% |
| D | 6778 | 4108 | 60.607849% |
Noise dominated data is calculated using 1-second bins in cleaned event files. If a bin has >2000 counts, and if more than 50% of those come from <1% of pixels, then it is considered to be noise-dominated and hence unusable.
| Quadrant | # 1 sec bins | Bins with >0 counts | Bins with >2000 counts | High rate bins dominated by noise | Noise dominated (total time) | Noise dominated (detector-on time) | Marked lightcurve |
|---|---|---|---|---|---|---|---|
| A | 7662 | 6778 | 40 | 40 | 0.52% | 0.59% | 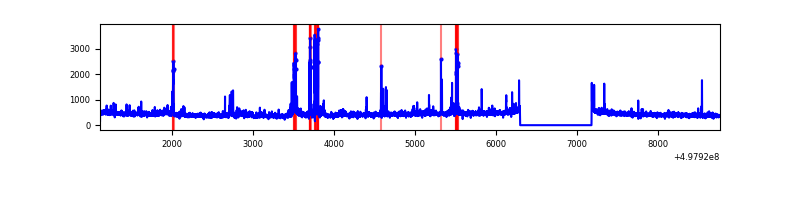 |
| B | 7662 | 6778 | 207 | 207 | 2.70% | 3.05% | 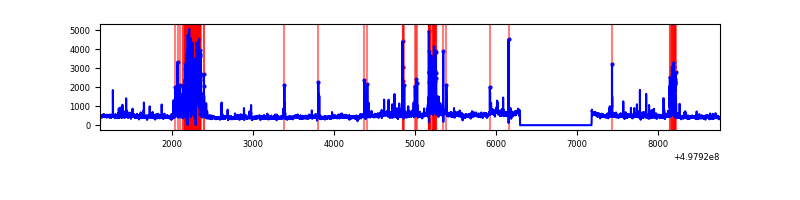 |
| C | 7663 | 6779 | 373 | 373 | 4.87% | 5.50% | 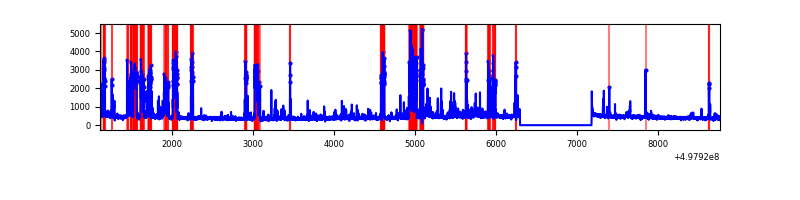 |
| D | 7663 | 6778 | 3586 | 3586 | 46.80% | 52.91% | 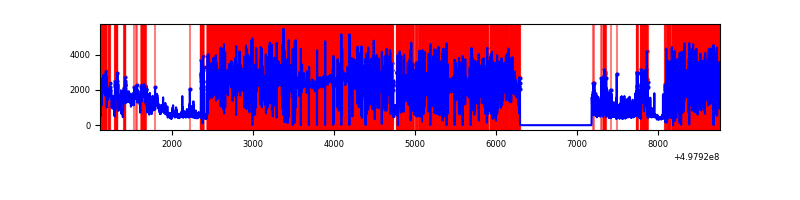 |
Top three noisy pixels from each quadrant. If the there are fewer than three noisy pixels in the level2.evt file, extra rows are filled as -1
| Pixel properties | Quadrant properties | ||||||
|---|---|---|---|---|---|---|---|
| Quadrant | DetID | PixID | Counts | Sigma | Mean | Median | Sigma |
| A | 7 | 29 | 182946 | 1063.81 | 697 | 681 | 171.3 |
| A | 4 | 78 | 103162 | 598.14 | 697 | 681 | 171.3 |
| A | 15 | 174 | 79206 | 458.32 | 697 | 681 | 171.3 |
| B | 10 | 245 | 595847 | 4039.19 | 680 | 655 | 147.4 |
| B | 7 | 0 | 296175 | 2005.51 | 680 | 655 | 147.4 |
| B | 5 | 185 | 126112 | 851.4 | 680 | 655 | 147.4 |
| C | 1 | 241 | 1102324 | 5983.8 | 664 | 656 | 184.1 |
| C | 1 | 29 | 117500 | 634.65 | 664 | 656 | 184.1 |
| C | 15 | 157 | 112386 | 606.87 | 664 | 656 | 184.1 |
| D | 8 | 176 | 9432205 | 76525.13 | 425 | 404 | 123.3 |
| D | 2 | 172 | 1549757 | 12570.71 | 425 | 404 | 123.3 |
| D | 3 | 12 | 200041 | 1619.76 | 425 | 404 | 123.3 |
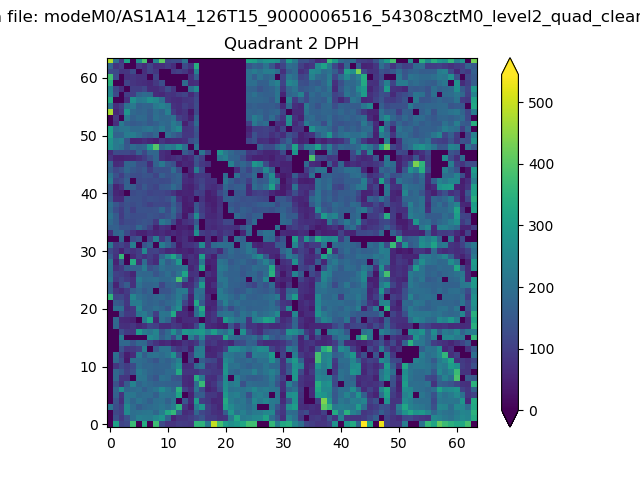
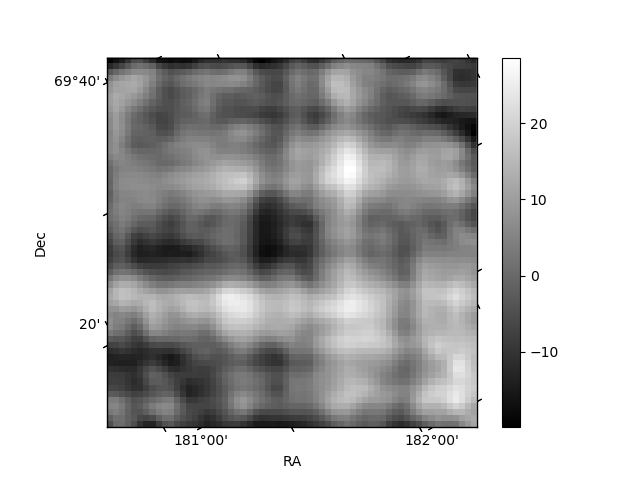
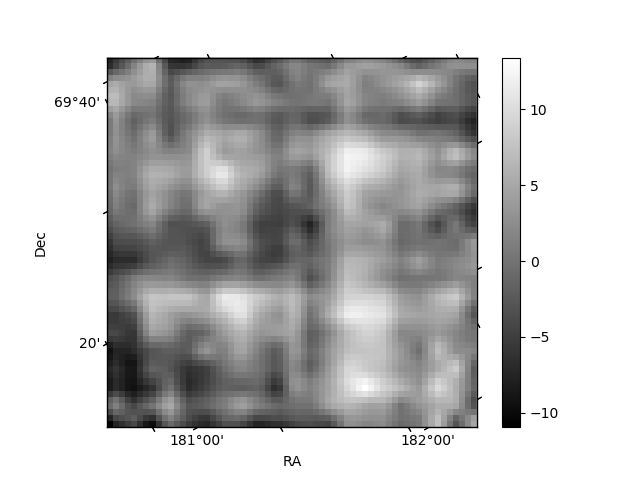
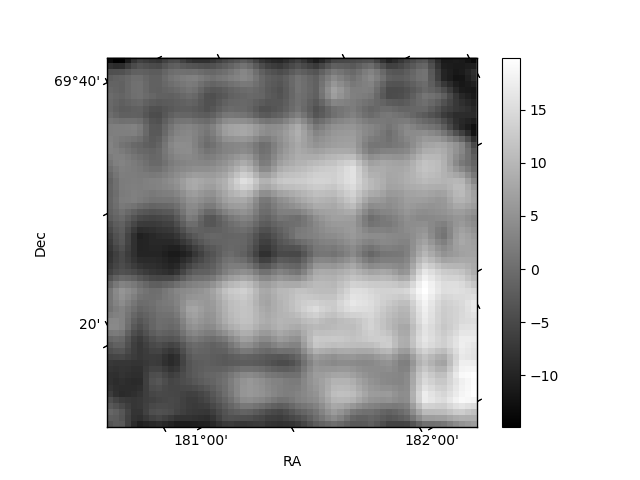
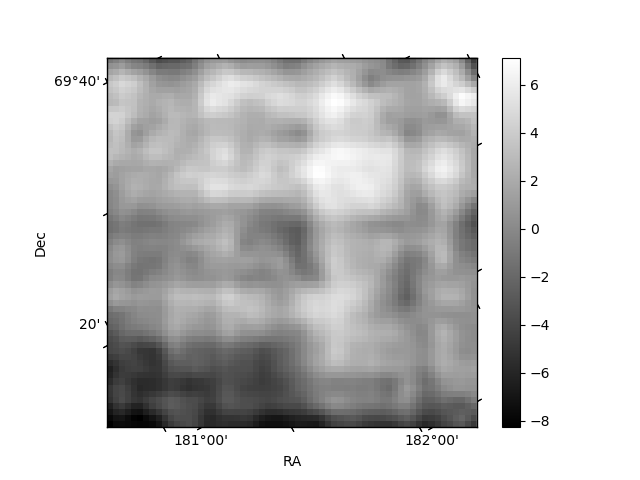
Histogram calculated using DETX and DETY for each event in the final _common_clean file
| Quadrant A | 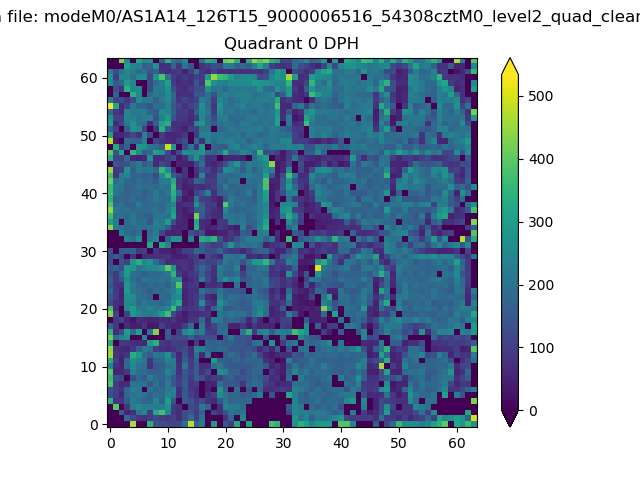 |
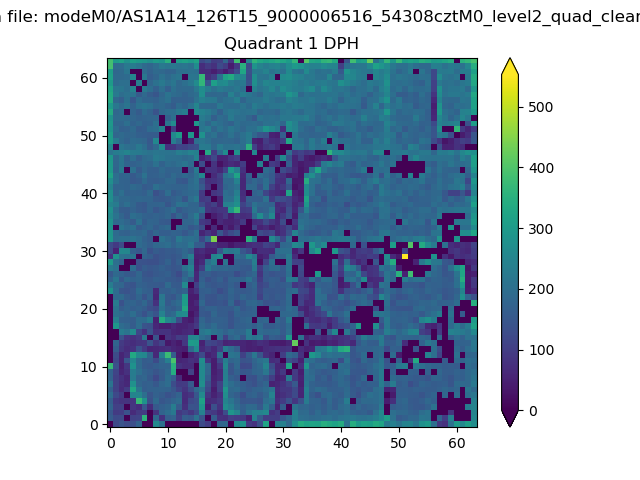 |
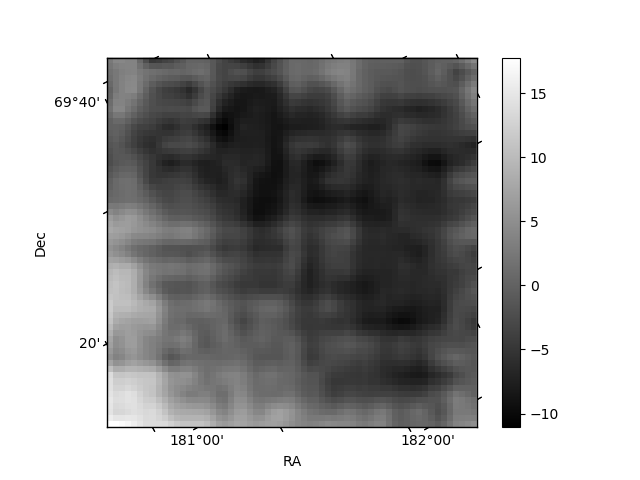
Quadrant B |
|---|---|---|---|
| Quadrant D | 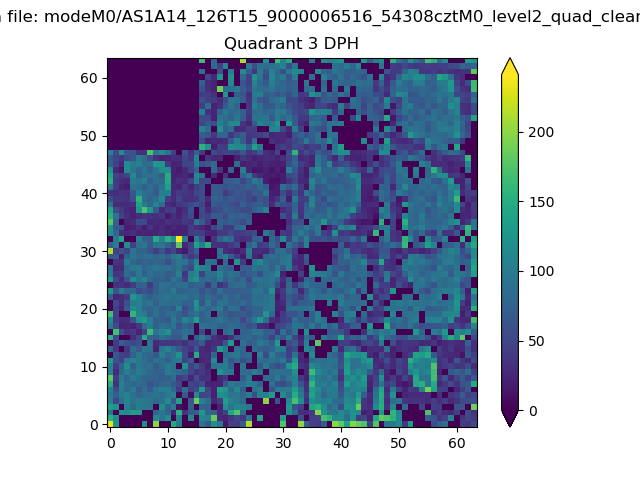 |
 |
Quadrant C |
| Plot type | Count rate plots | Images |
|---|---|---|
| Comparison with Poisson distribution Blue bars denote a histogram of data divided into 1 sec bins. Red curve is a Poisson curve with rate = median count rate of data. |
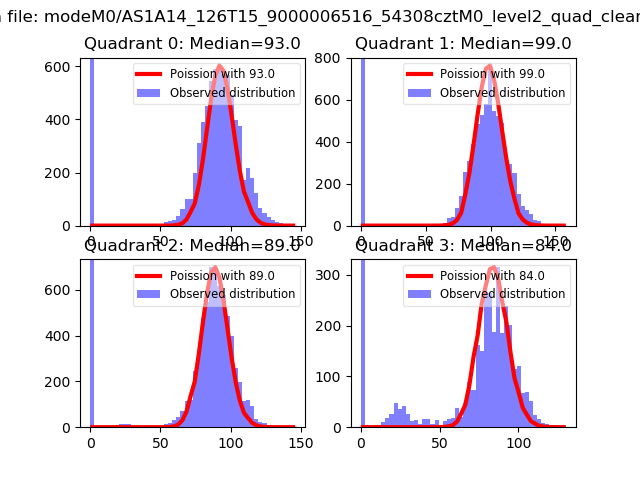 |
 |
| Quadrant-wise count rates Data is divided into 100 sec bins |
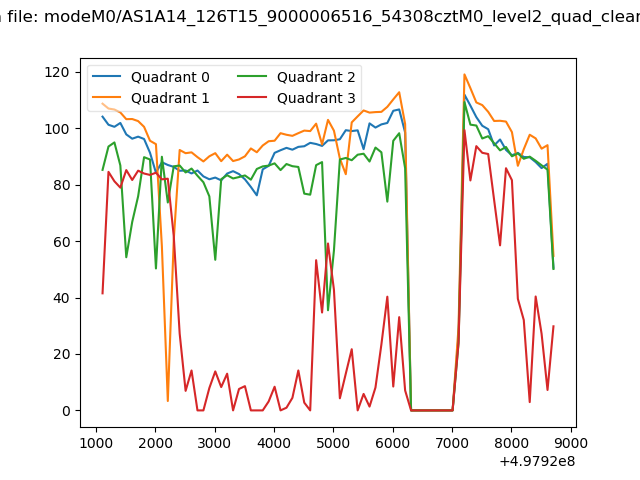 |
|
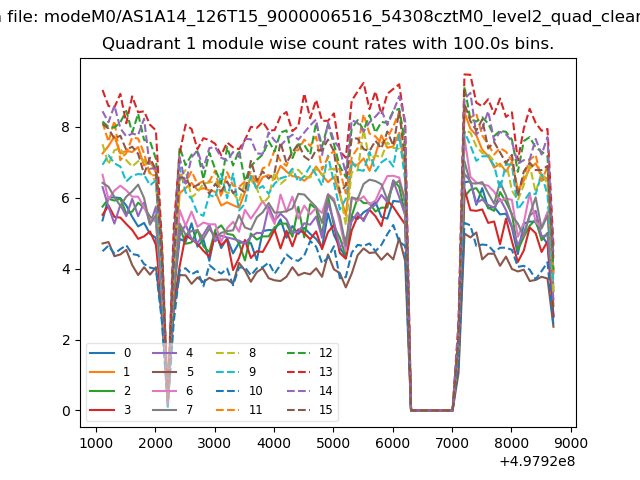
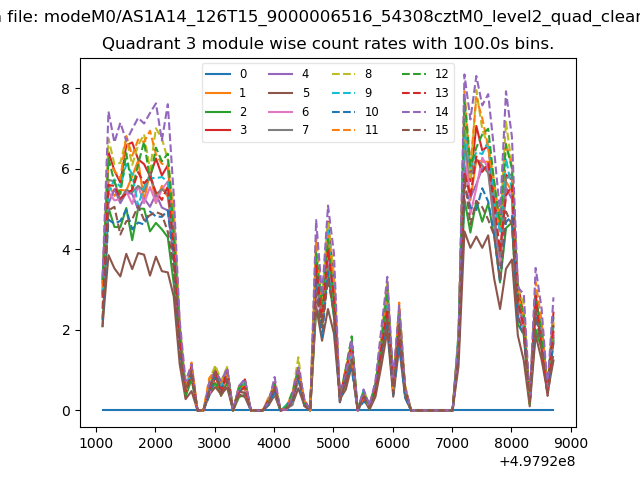
| Module-wise count rates for Quadrant A Data is divided into 100 sec bins |
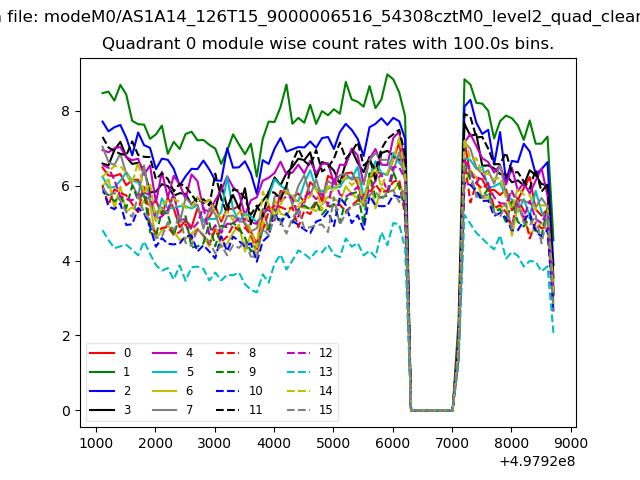 |
 |
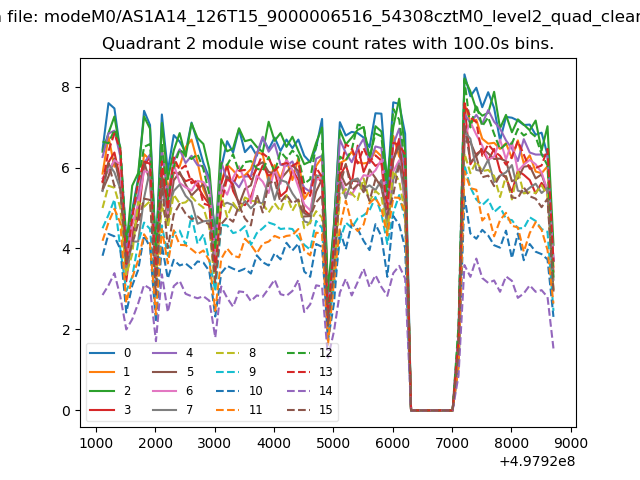
| Module-wise count rates for Quadrant B Data is divided into 100 sec bins |
 |
 |
| Module-wise count rates for Quadrant C Data is divided into 100 sec bins |
 |
 |
| Module-wise count rates for Quadrant D Data is divided into 100 sec bins |
 |
 |
| Parameter | Plot |
|---|---|
| CZT HV Monitor | 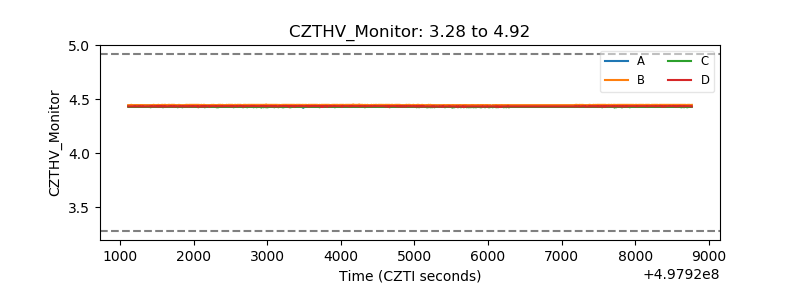 |
| D_VDD | 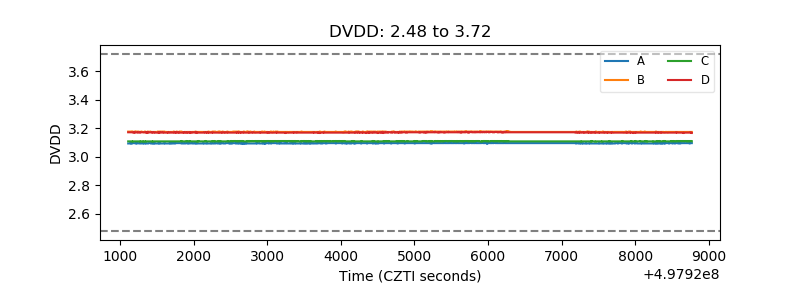 |
| Temperature 1 | 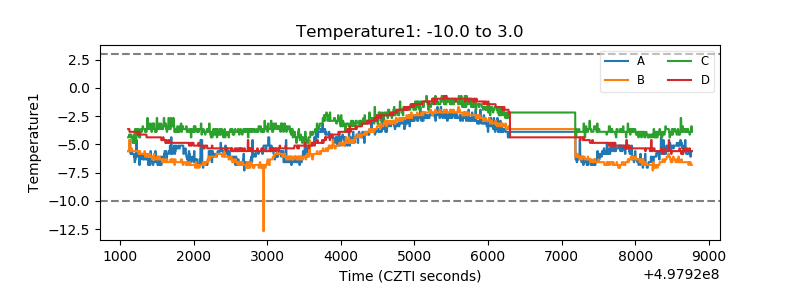 |
| Veto HV Monitor | 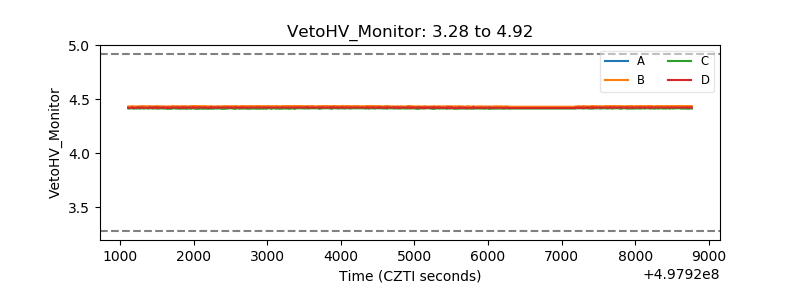 |
| Veto LLD | 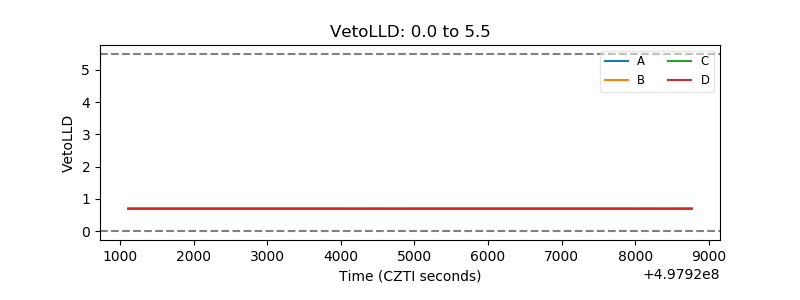 |
| Alpha Counter | 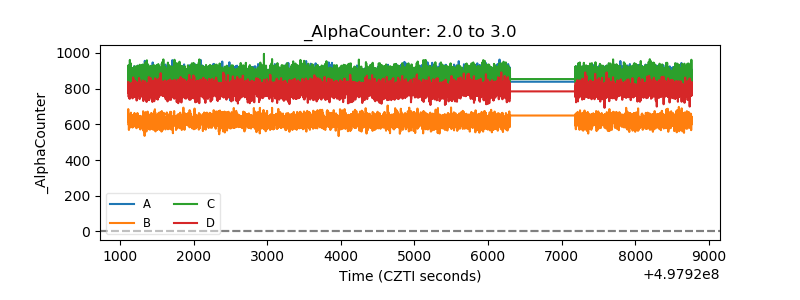 |
| _CPM_Rate | 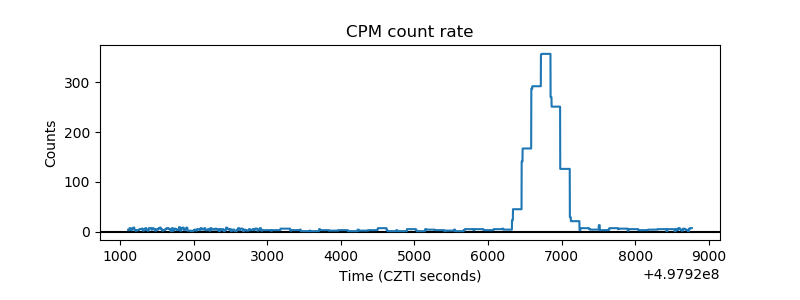 |
| CZT Counter | 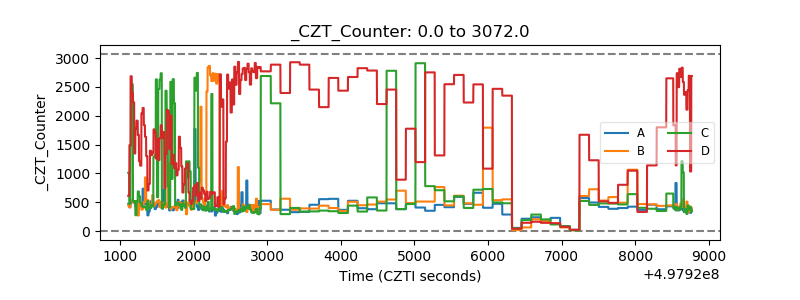 |
| +2.5 Volts monitor |  |
| +5 Volts monitor |  |
| _ROLL_ROT | 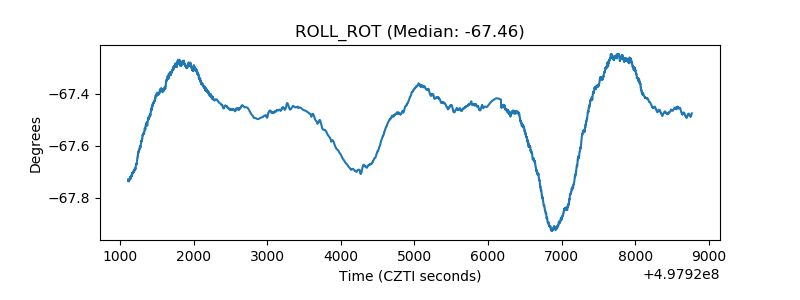 |
| _Roll_DEC | 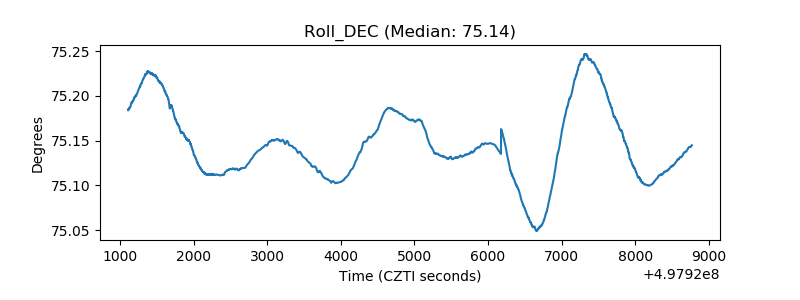 |
| _Roll_RA | 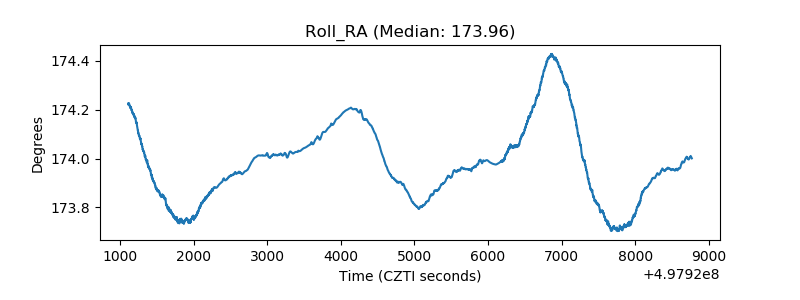 |
| Veto Counter | 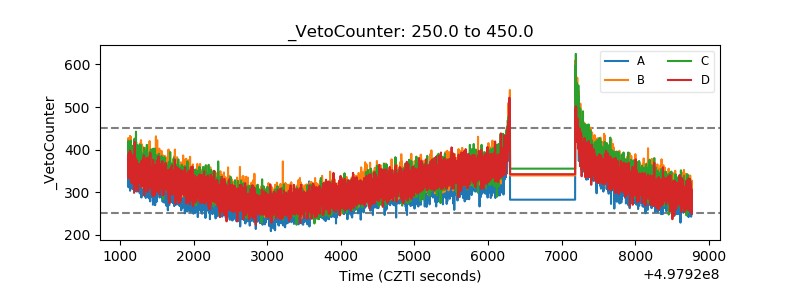 |