| Param | Original file | Final file |
|---|---|---|
| Filename | modeM0/AS1A14_126T15_9000006516_54310cztM0_level2.fits | modeM0/AS1A14_126T15_9000006516_54310cztM0_level2_quad_clean.evt |
| Size (bytes) | 601,208,640 | 92,833,920 |
| Size | 573.4 MB | 88.5 MB |
| Events in quadrant A | 3,537,844 | 647,848 |
| Events in quadrant B | 3,696,495 | 706,858 |
| Events in quadrant C | 3,237,081 | 634,801 |
| Events in quadrant D | 11,242,518 | 336,686 |
| Mode SS | |||
|---|---|---|---|
| Quadrant | BADHDUFLAG | Total packets | Discarded packets |
| A | 0 | 144 | 0 |
| B | 0 | 144 | 0 |
| C | 0 | 144 | 0 |
| D | 0 | 144 | 0 |
| Mode M0 | |||
|---|---|---|---|
| Quadrant | BADHDUFLAG | Total packets | Discarded packets |
| A | 0 | 15815 | 2 |
| B | 0 | 15742 | 2 |
| C | 0 | 14906 | 2 |
| D | 0 | 38194 | 2 |
| Mode M9 | |||
|---|---|---|---|
| Quadrant | BADHDUFLAG | Total packets | Discarded packets |
| A | 0 | 18 | 0 |
| B | 0 | 18 | 0 |
| C | 0 | 18 | 0 |
| D | 0 | 18 | 0 |
| Quadrant | Total seconds | Saturated seconds | Saturation percentage |
|---|---|---|---|
| A | 6954 | 165 | 2.372735% |
| B | 6955 | 87 | 1.250899% |
| C | 6955 | 45 | 0.647017% |
| D | 6955 | 3358 | 48.281812% |
Noise dominated data is calculated using 1-second bins in cleaned event files. If a bin has >2000 counts, and if more than 50% of those come from <1% of pixels, then it is considered to be noise-dominated and hence unusable.
| Quadrant | # 1 sec bins | Bins with >0 counts | Bins with >2000 counts | High rate bins dominated by noise | Noise dominated (total time) | Noise dominated (detector-on time) | Marked lightcurve |
|---|---|---|---|---|---|---|---|
| A | 8844 | 6956 | 126 | 126 | 1.42% | 1.81% | 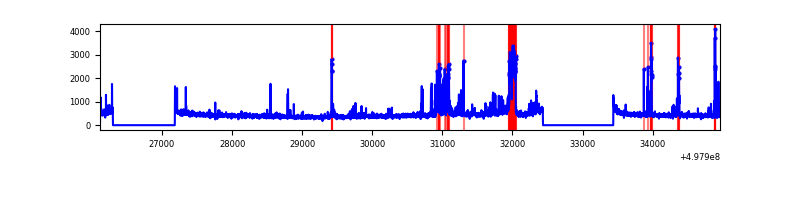 |
| B | 8845 | 6957 | 31 | 31 | 0.35% | 0.45% | 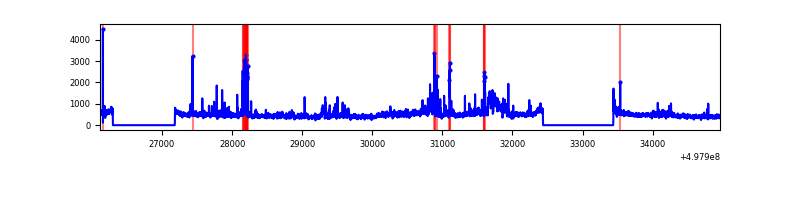 |
| C | 8845 | 6957 | 23 | 23 | 0.26% | 0.33% | 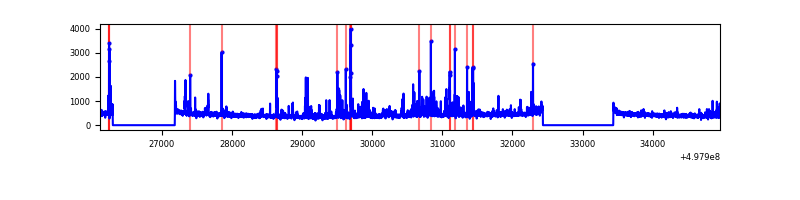 |
| D | 8845 | 6956 | 2849 | 2849 | 32.21% | 40.96% | 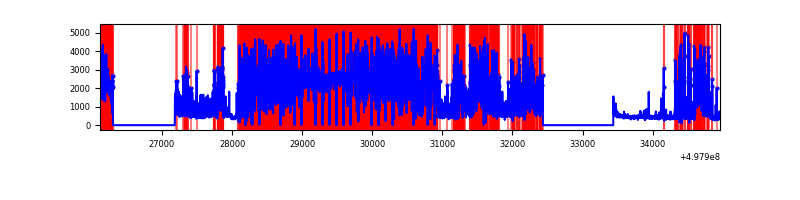 |
Top three noisy pixels from each quadrant. If the there are fewer than three noisy pixels in the level2.evt file, extra rows are filled as -1
| Pixel properties | Quadrant properties | ||||||
|---|---|---|---|---|---|---|---|
| Quadrant | DetID | PixID | Counts | Sigma | Mean | Median | Sigma |
| A | 7 | 29 | 355103 | 1986.21 | 722 | 706 | 178.4 |
| A | 15 | 174 | 265531 | 1484.2 | 722 | 706 | 178.4 |
| A | 0 | 8 | 29200 | 159.69 | 722 | 706 | 178.4 |
| B | 7 | 0 | 355639 | 2272.21 | 723 | 697 | 156.2 |
| B | 0 | 213 | 210953 | 1345.98 | 723 | 697 | 156.2 |
| B | 5 | 185 | 112554 | 716.07 | 723 | 697 | 156.2 |
| C | 15 | 157 | 201635 | 1011.15 | 712 | 702 | 198.7 |
| C | 14 | 254 | 82634 | 412.31 | 712 | 702 | 198.7 |
| C | 12 | 252 | 61179 | 304.34 | 712 | 702 | 198.7 |
| D | 8 | 176 | 8641844 | 59781.78 | 504 | 481 | 144.5 |
| D | 2 | 172 | 283189 | 1955.8 | 504 | 481 | 144.5 |
| D | 3 | 12 | 150954 | 1040.99 | 504 | 481 | 144.5 |
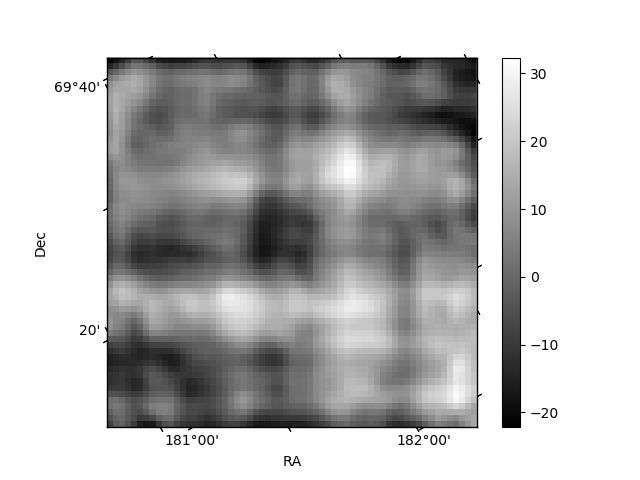
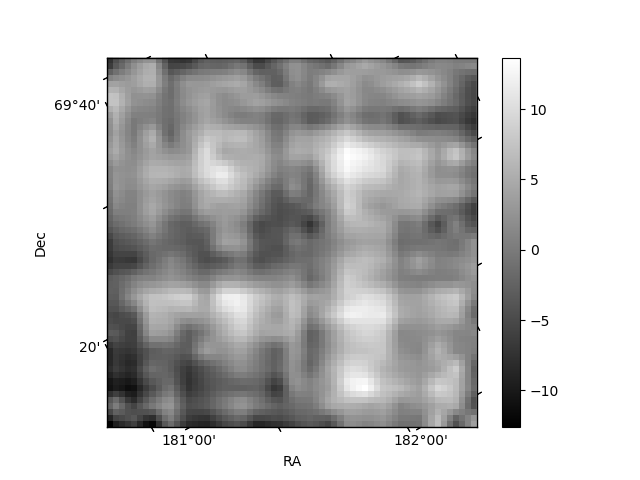
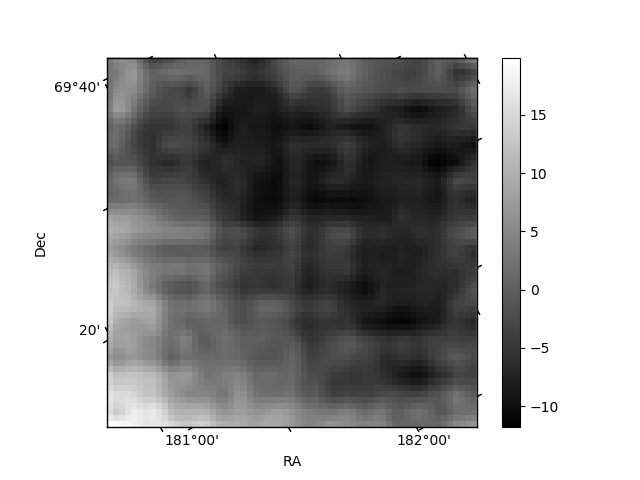
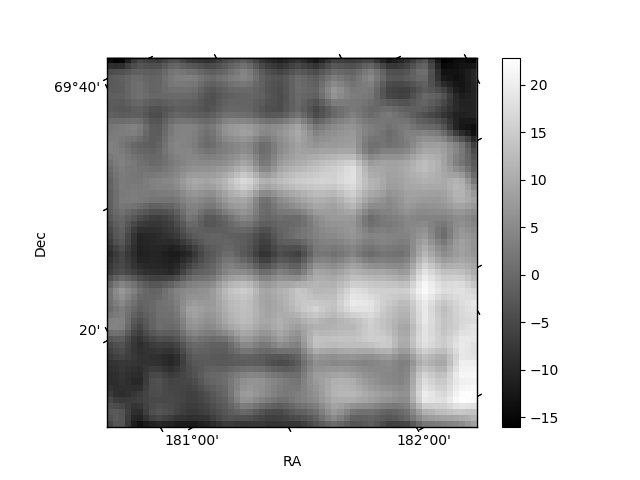
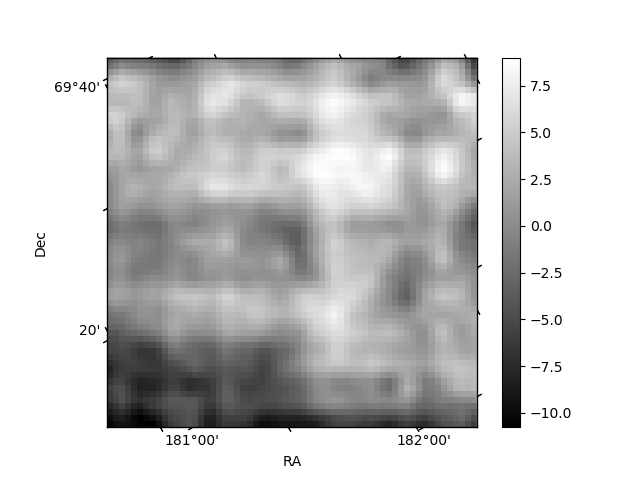
Histogram calculated using DETX and DETY for each event in the final _common_clean file
| Quadrant A | 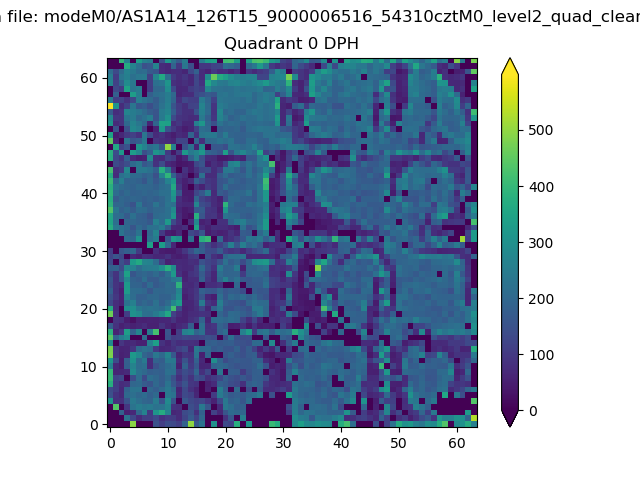 |
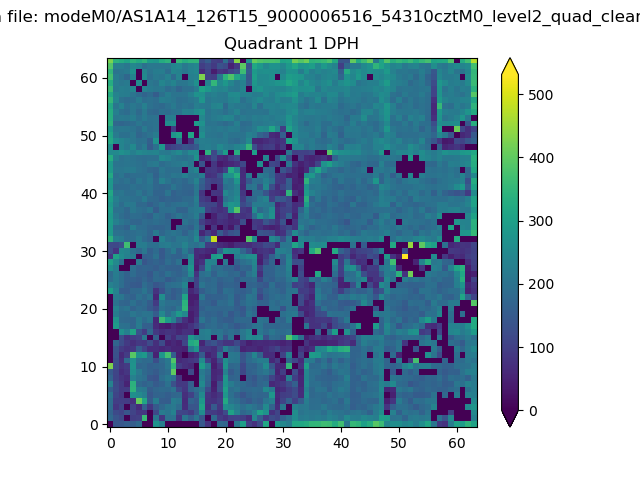 |
Quadrant B |
|---|---|---|---|
| Quadrant D | 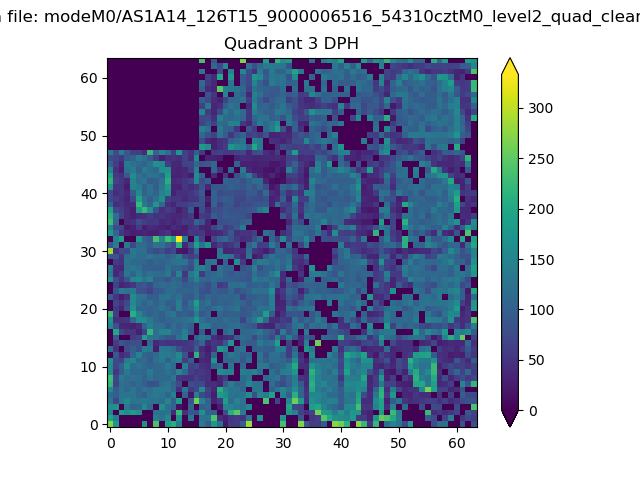 |
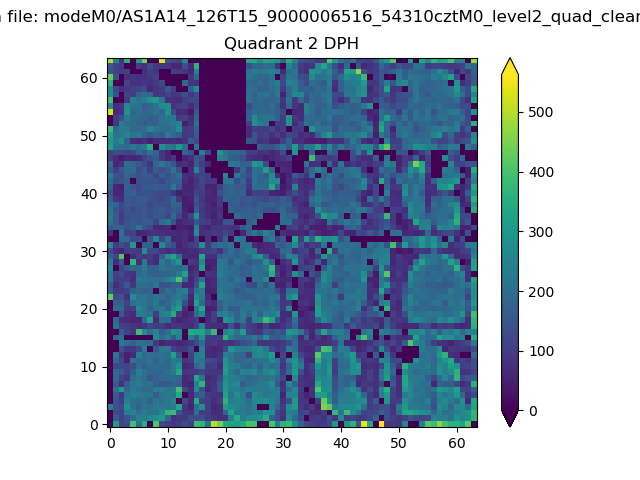 |
Quadrant C |
| Plot type | Count rate plots | Images |
|---|---|---|
| Comparison with Poisson distribution Blue bars denote a histogram of data divided into 1 sec bins. Red curve is a Poisson curve with rate = median count rate of data. |
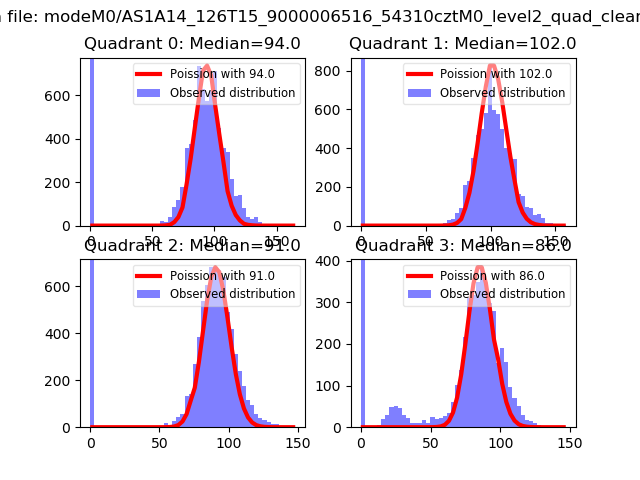 |
 |
| Quadrant-wise count rates Data is divided into 100 sec bins |
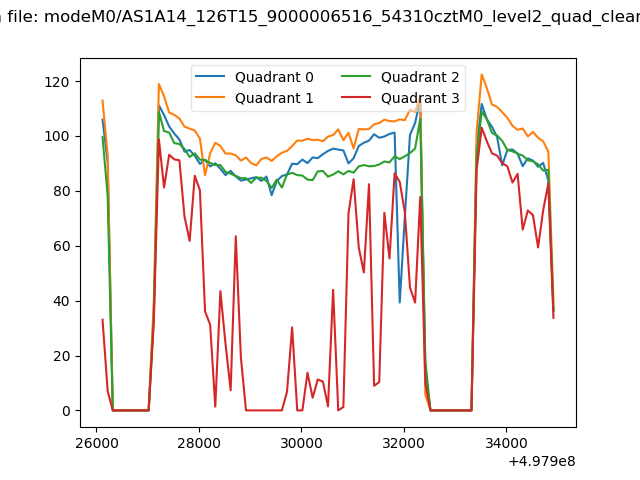 |
|
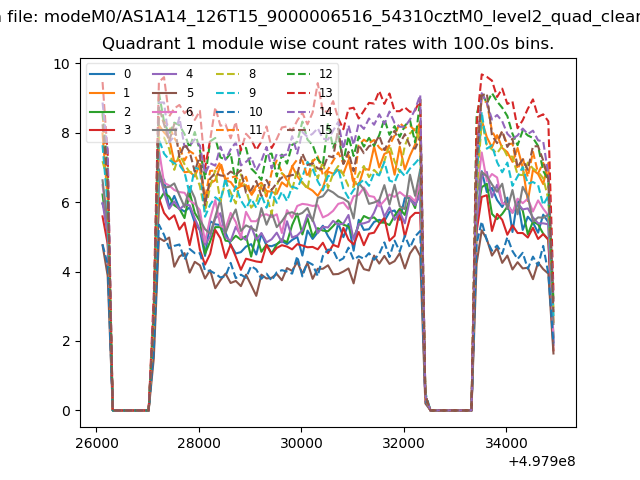
| Module-wise count rates for Quadrant A Data is divided into 100 sec bins |
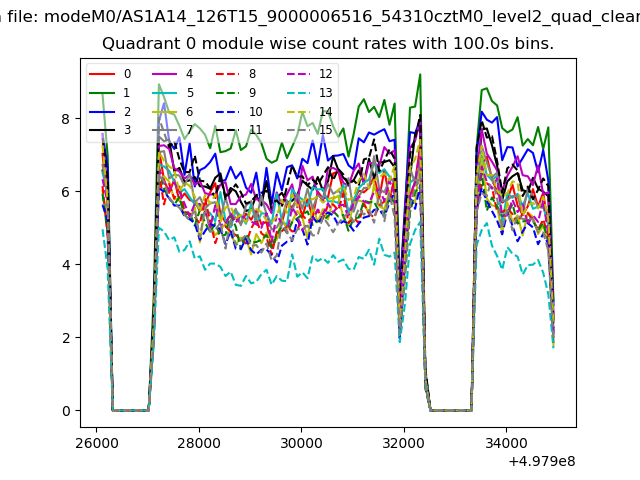 |
 |
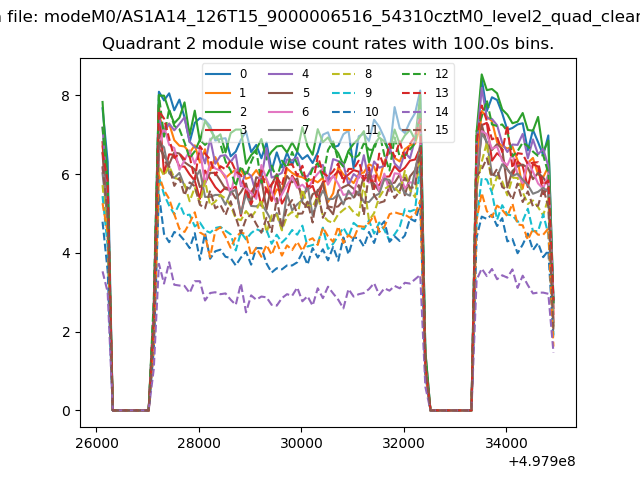
| Module-wise count rates for Quadrant B Data is divided into 100 sec bins |
 |
 |
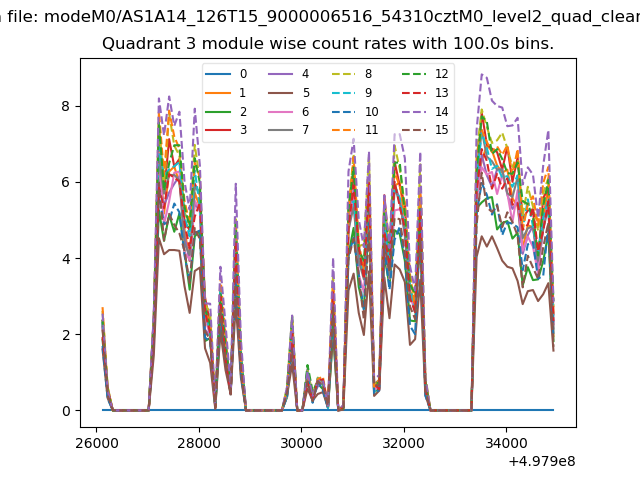
| Module-wise count rates for Quadrant C Data is divided into 100 sec bins |
 |
 |
| Module-wise count rates for Quadrant D Data is divided into 100 sec bins |
 |
 |
| Parameter | Plot |
|---|---|
| CZT HV Monitor | 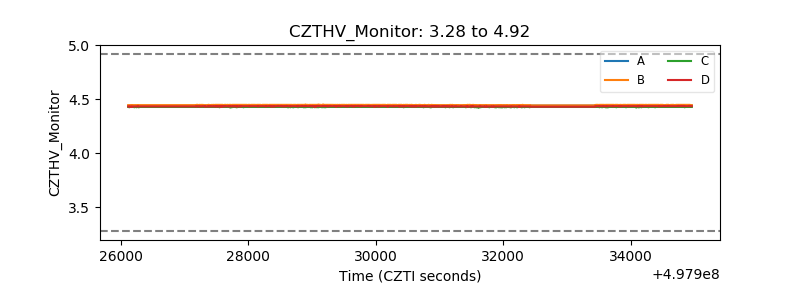 |
| D_VDD | 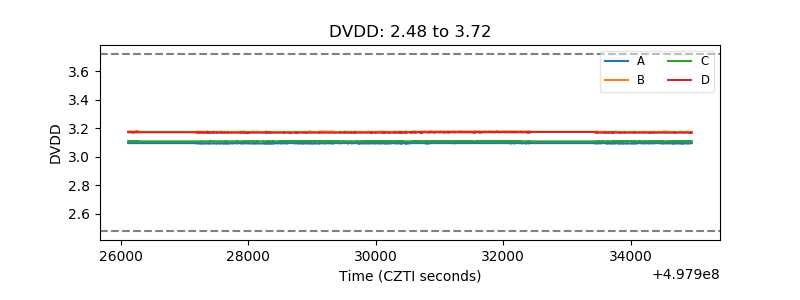 |
| Temperature 1 | 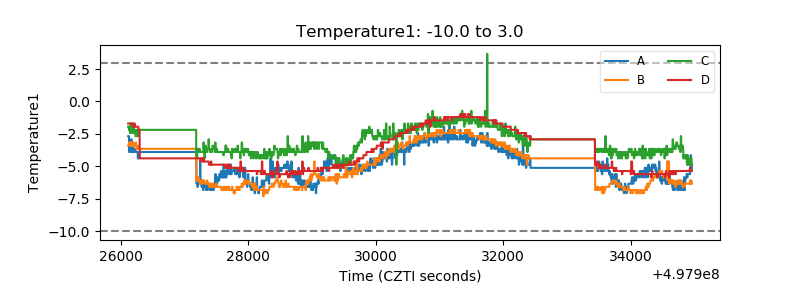 |
| Veto HV Monitor | 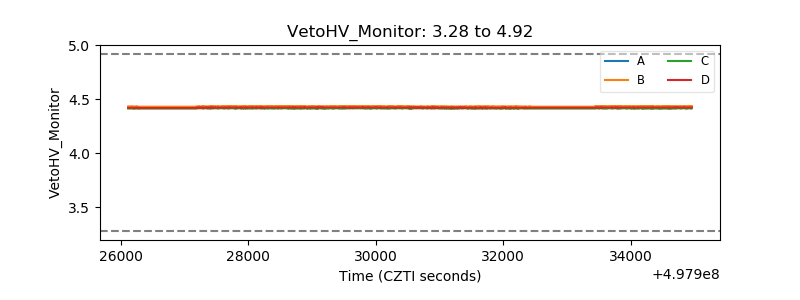 |
| Veto LLD | 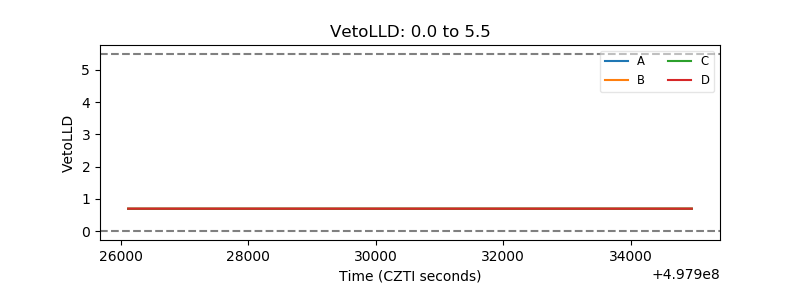 |
| Alpha Counter | 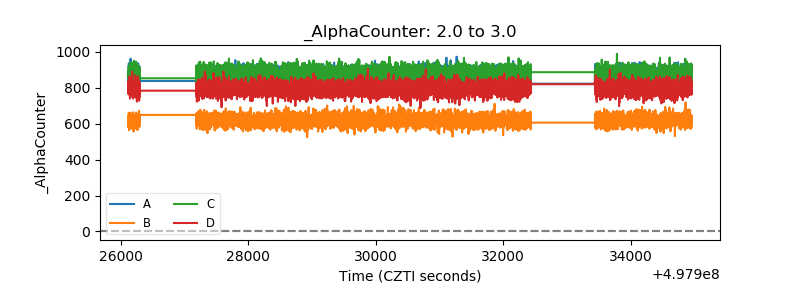 |
| _CPM_Rate | 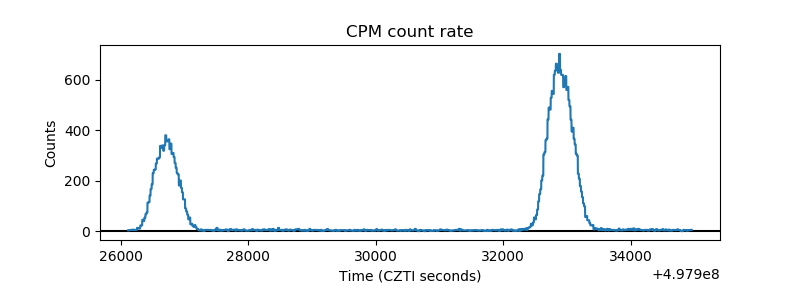 |
| CZT Counter | 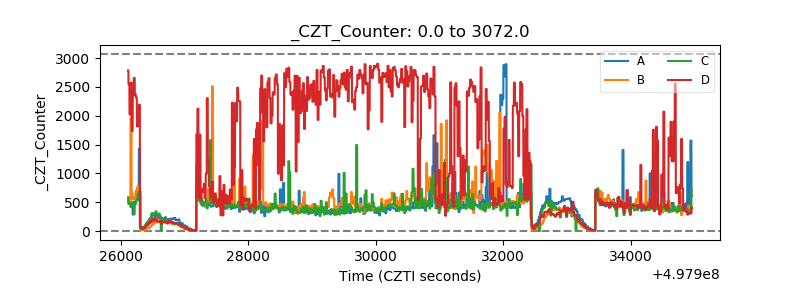 |
| +2.5 Volts monitor |  |
| +5 Volts monitor | 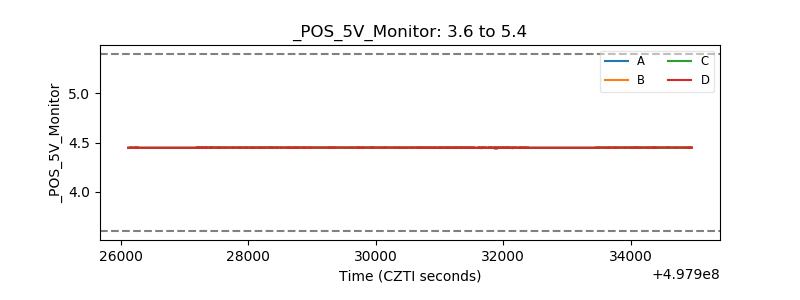 |
| _ROLL_ROT | 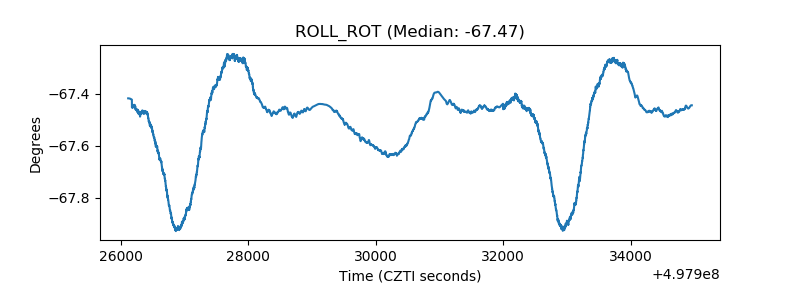 |
| _Roll_DEC | 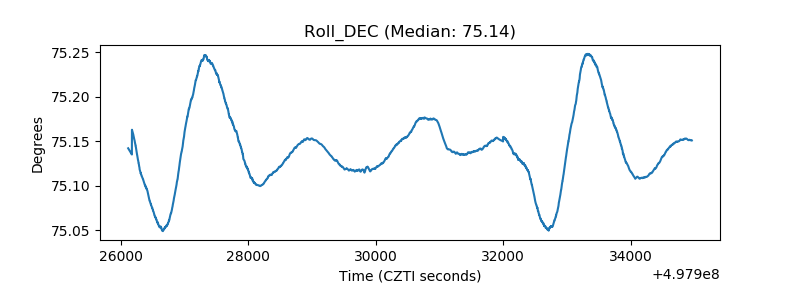 |
| _Roll_RA | 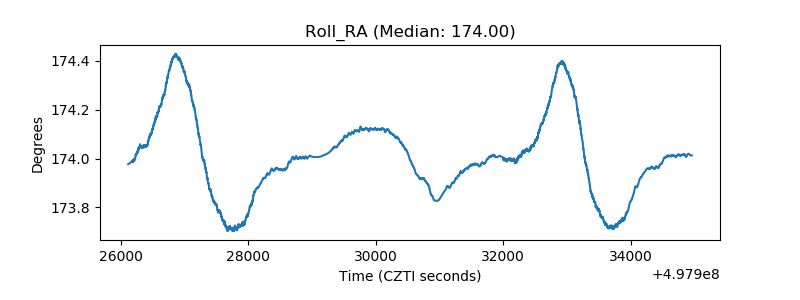 |
| Veto Counter | 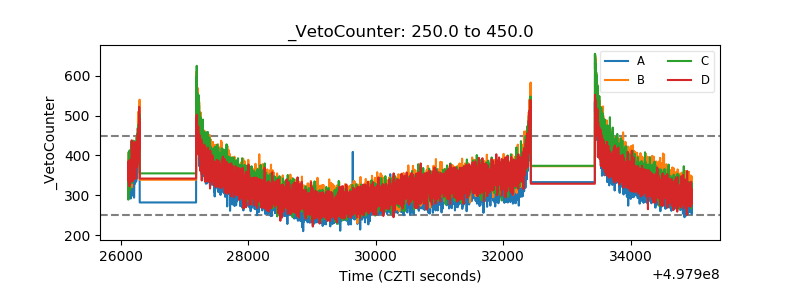 |