| Param | Original file | Final file |
|---|---|---|
| Filename | modeM0/AS1A14_126T15_9000006516_54312cztM0_level2.fits | modeM0/AS1A14_126T15_9000006516_54312cztM0_level2_quad_clean.evt |
| Size (bytes) | 669,519,360 | 86,866,560 |
| Size | 638.5 MB | 82.8 MB |
| Events in quadrant A | 3,682,060 | 640,065 |
| Events in quadrant B | 3,040,869 | 710,569 |
| Events in quadrant C | 4,890,486 | 585,449 |
| Events in quadrant D | 12,657,328 | 233,990 |
| Mode SS | |||
|---|---|---|---|
| Quadrant | BADHDUFLAG | Total packets | Discarded packets |
| A | 0 | 136 | 0 |
| B | 0 | 136 | 0 |
| C | 0 | 136 | 0 |
| D | 0 | 136 | 0 |
| Mode M0 | |||
|---|---|---|---|
| Quadrant | BADHDUFLAG | Total packets | Discarded packets |
| A | 0 | 15852 | 2 |
| B | 0 | 13895 | 2 |
| C | 0 | 19301 | 2 |
| D | 0 | 42140 | 2 |
| Mode M9 | |||
|---|---|---|---|
| Quadrant | BADHDUFLAG | Total packets | Discarded packets |
| A | 0 | 14 | 0 |
| B | 0 | 15 | 0 |
| C | 0 | 15 | 0 |
| D | 0 | 15 | 0 |
| Quadrant | Total seconds | Saturated seconds | Saturation percentage |
|---|---|---|---|
| A | 6591 | 303 | 4.597178% |
| B | 6591 | 57 | 0.864816% |
| C | 6591 | 553 | 8.390229% |
| D | 6591 | 4241 | 64.345319% |
Noise dominated data is calculated using 1-second bins in cleaned event files. If a bin has >2000 counts, and if more than 50% of those come from <1% of pixels, then it is considered to be noise-dominated and hence unusable.
| Quadrant | # 1 sec bins | Bins with >0 counts | Bins with >2000 counts | High rate bins dominated by noise | Noise dominated (total time) | Noise dominated (detector-on time) | Marked lightcurve |
|---|---|---|---|---|---|---|---|
| A | 7746 | 6592 | 205 | 205 | 2.65% | 3.11% | 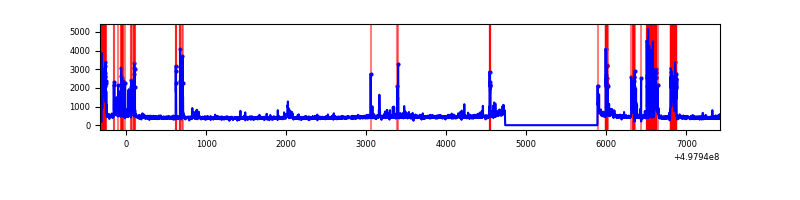 |
| B | 7746 | 6592 | 11 | 11 | 0.14% | 0.17% | 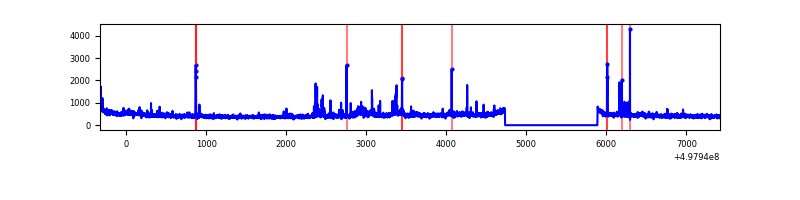 |
| C | 7746 | 6592 | 495 | 495 | 6.39% | 7.51% | 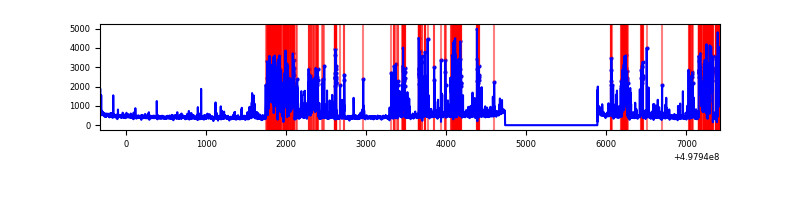 |
| D | 7745 | 6591 | 3375 | 3375 | 43.58% | 51.21% | 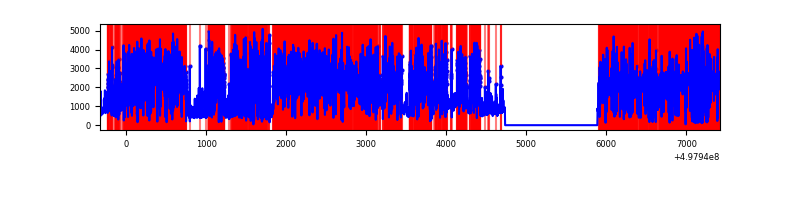 |
Top three noisy pixels from each quadrant. If the there are fewer than three noisy pixels in the level2.evt file, extra rows are filled as -1
| Pixel properties | Quadrant properties | ||||||
|---|---|---|---|---|---|---|---|
| Quadrant | DetID | PixID | Counts | Sigma | Mean | Median | Sigma |
| A | 7 | 29 | 861423 | 5042.18 | 693 | 677 | 170.7 |
| A | 4 | 3 | 41993 | 242.03 | 693 | 677 | 170.7 |
| A | 3 | 110 | 36408 | 209.31 | 693 | 677 | 170.7 |
| B | 7 | 0 | 109657 | 730.66 | 700 | 676 | 149.2 |
| B | 0 | 213 | 53160 | 351.88 | 700 | 676 | 149.2 |
| B | 10 | 247 | 44400 | 293.15 | 700 | 676 | 149.2 |
| C | 14 | 254 | 1428010 | 7890.8 | 656 | 649 | 180.9 |
| C | 1 | 241 | 531089 | 2932.4 | 656 | 649 | 180.9 |
| C | 15 | 198 | 106186 | 583.43 | 656 | 649 | 180.9 |
| D | 8 | 176 | 10554139 | 90629.18 | 405 | 385 | 116.4 |
| D | 3 | 12 | 241858 | 2073.62 | 405 | 385 | 116.4 |
| D | 2 | 120 | 66705 | 569.52 | 405 | 385 | 116.4 |
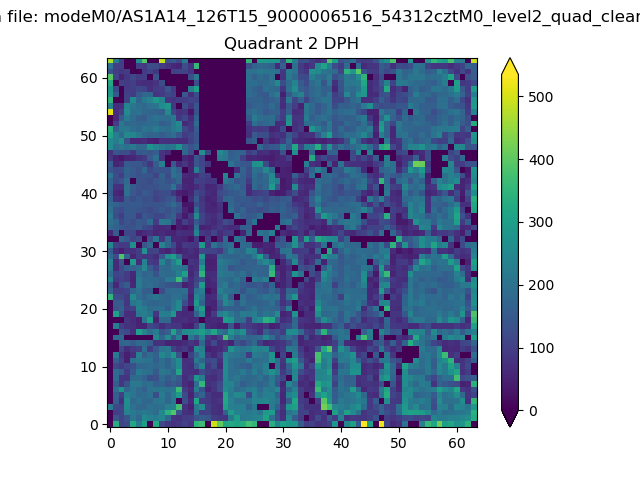
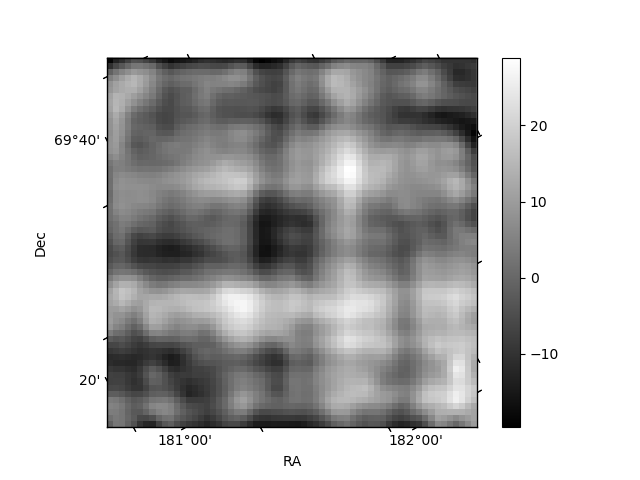
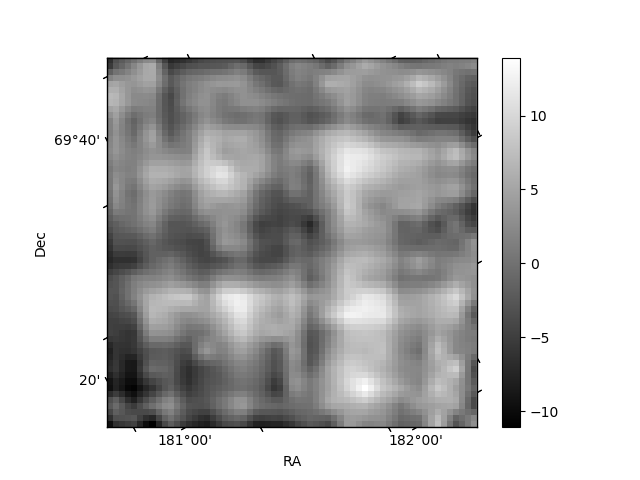
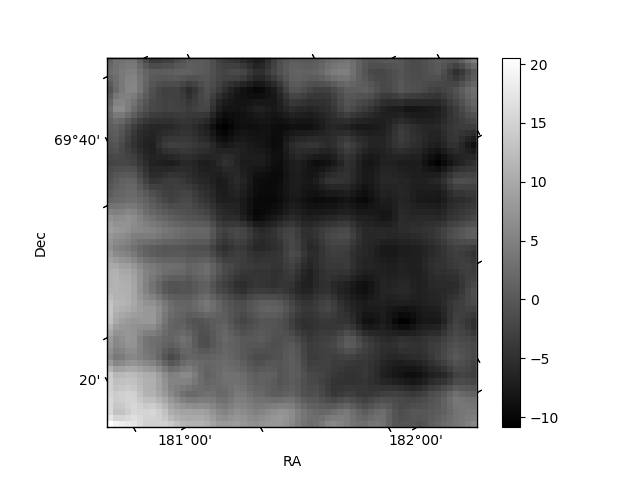
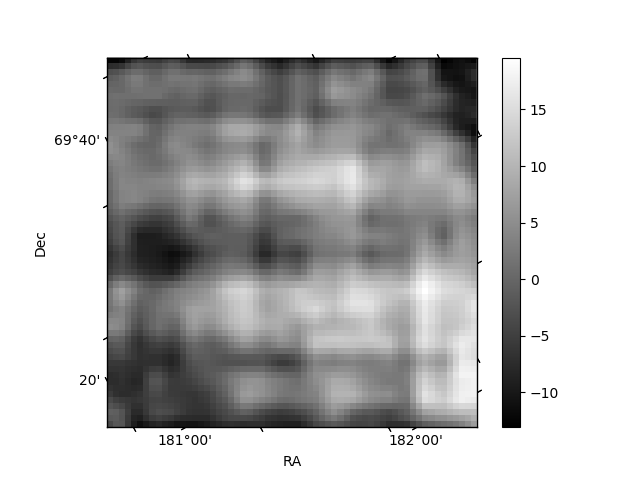
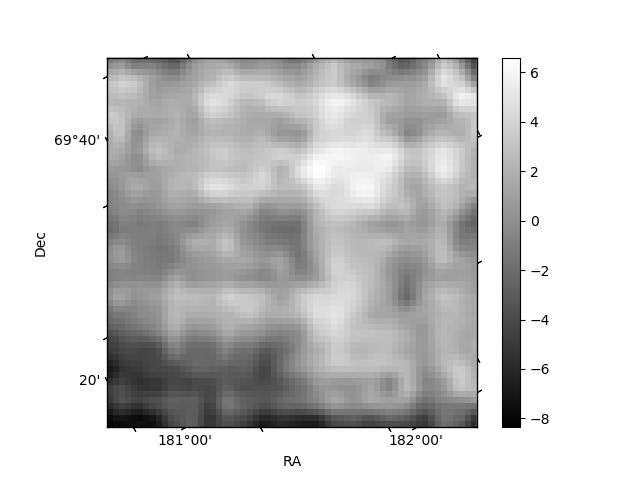
Histogram calculated using DETX and DETY for each event in the final _common_clean file
| Quadrant A | 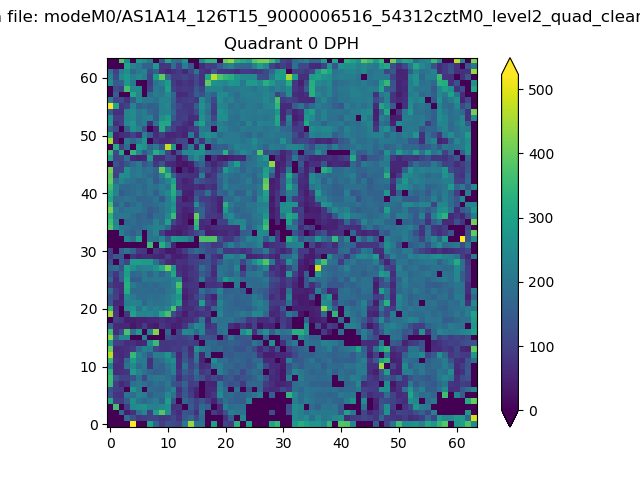 |
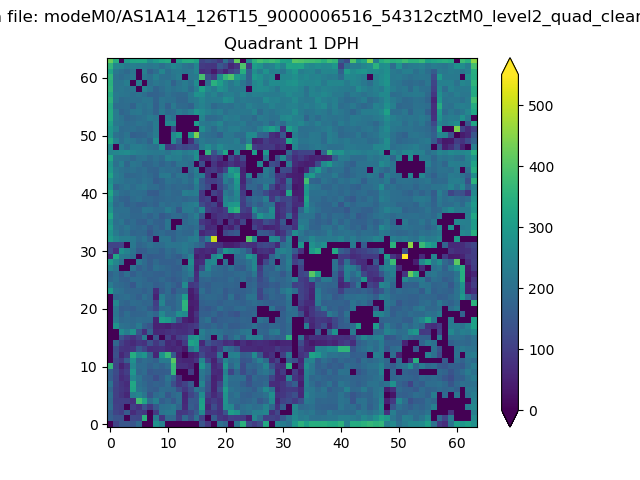 |
Quadrant B |
|---|---|---|---|
| Quadrant D | 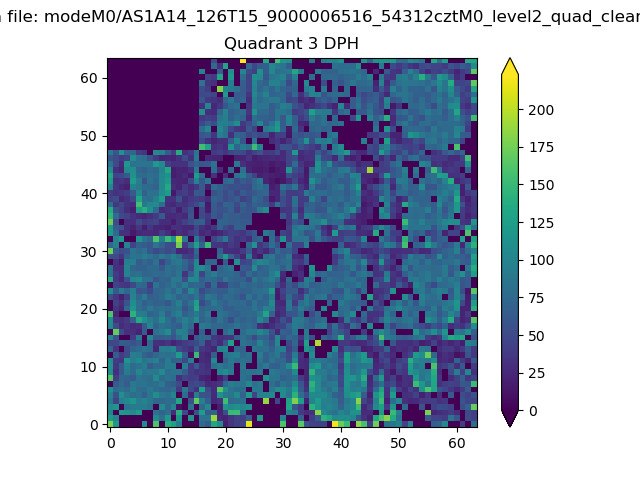 |
 |
Quadrant C |
| Plot type | Count rate plots | Images |
|---|---|---|
| Comparison with Poisson distribution Blue bars denote a histogram of data divided into 1 sec bins. Red curve is a Poisson curve with rate = median count rate of data. |
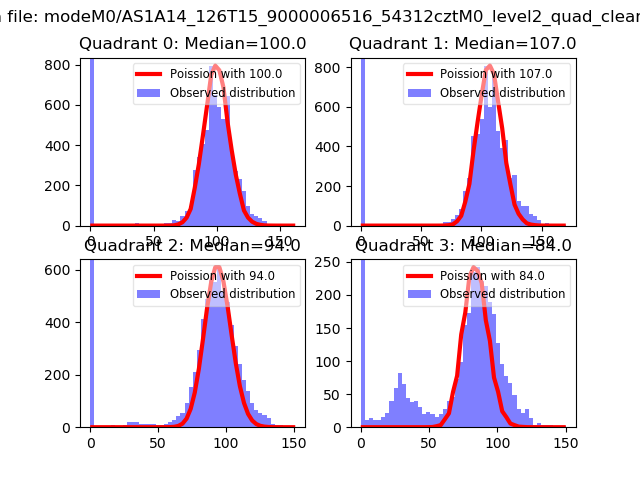 |
 |
| Quadrant-wise count rates Data is divided into 100 sec bins |
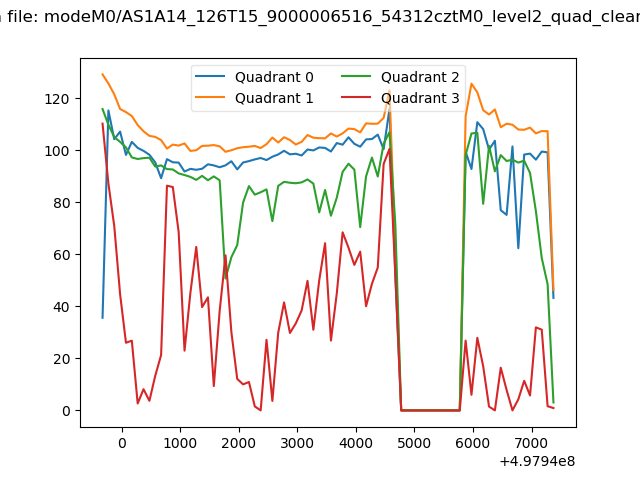 |
|
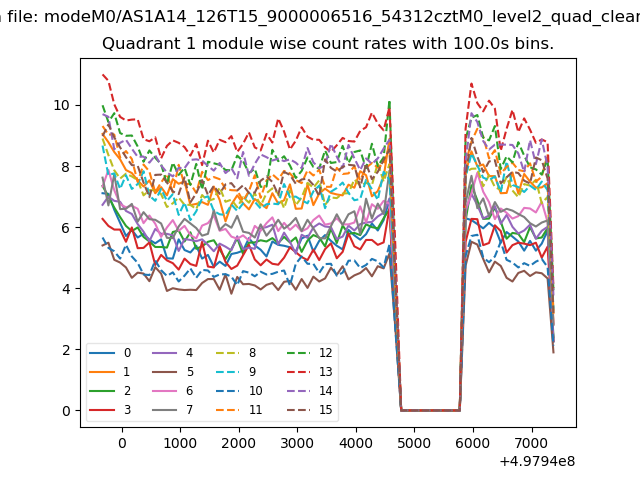
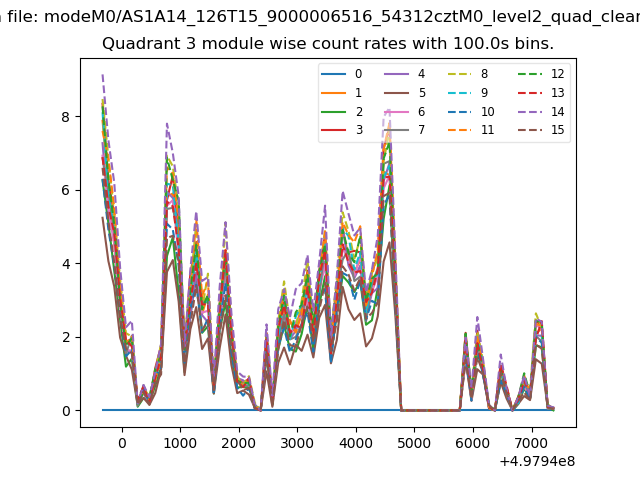
| Module-wise count rates for Quadrant A Data is divided into 100 sec bins |
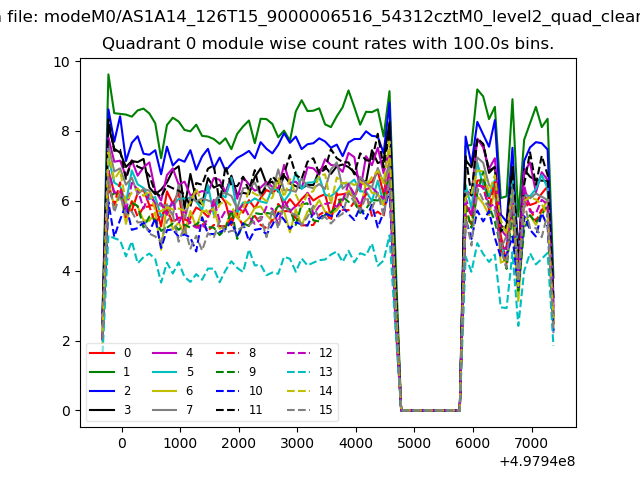 |
 |
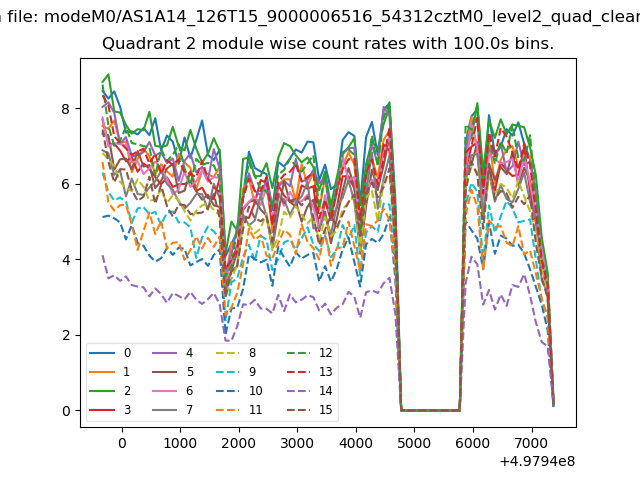
| Module-wise count rates for Quadrant B Data is divided into 100 sec bins |
 |
 |
| Module-wise count rates for Quadrant C Data is divided into 100 sec bins |
 |
 |
| Module-wise count rates for Quadrant D Data is divided into 100 sec bins |
 |
 |
| Parameter | Plot |
|---|---|
| CZT HV Monitor | 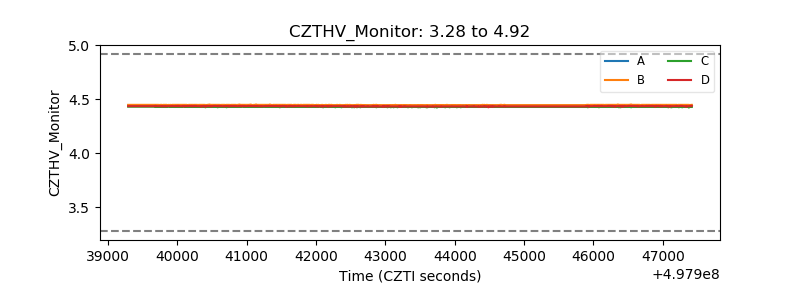 |
| D_VDD | 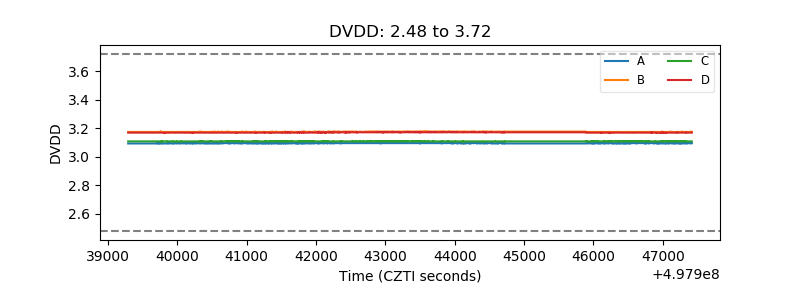 |
| Temperature 1 | 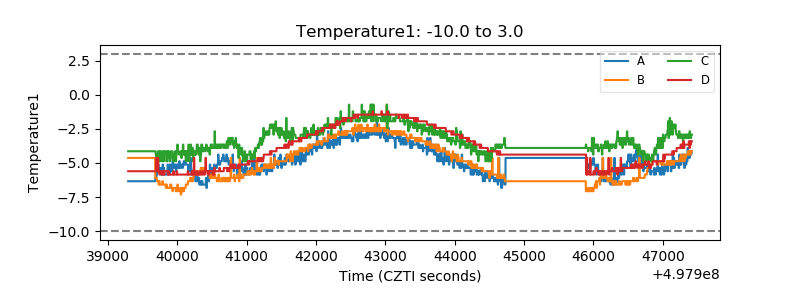 |
| Veto HV Monitor | 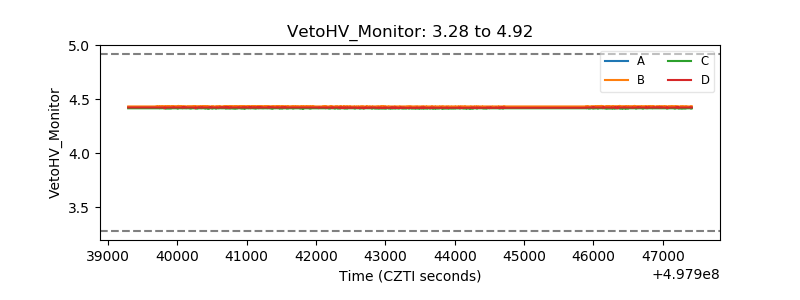 |
| Veto LLD | 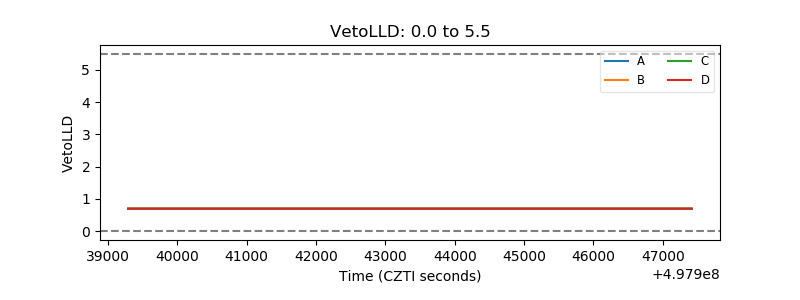 |
| Alpha Counter | 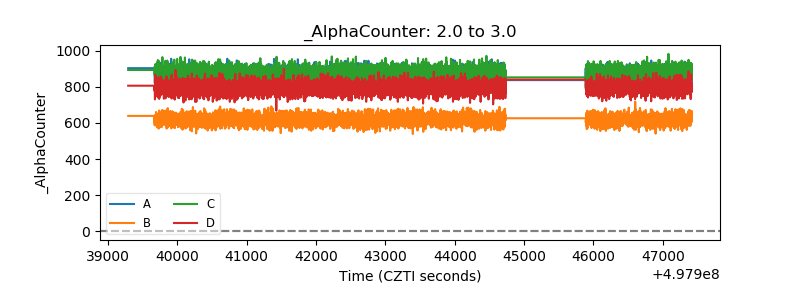 |
| _CPM_Rate | 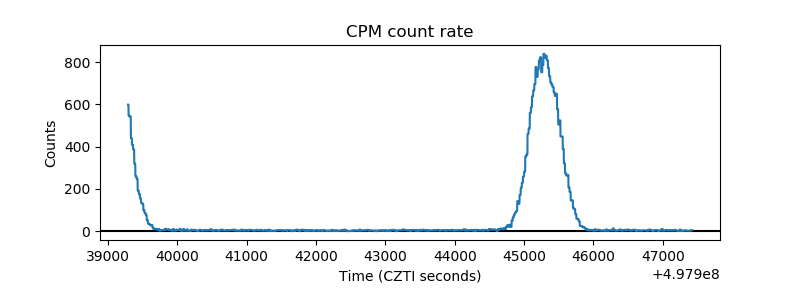 |
| CZT Counter | 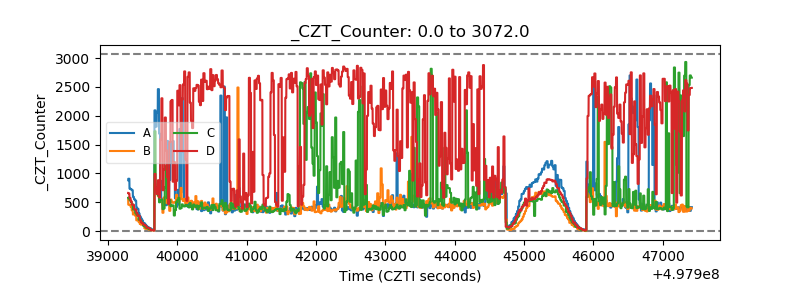 |
| +2.5 Volts monitor |  |
| +5 Volts monitor | 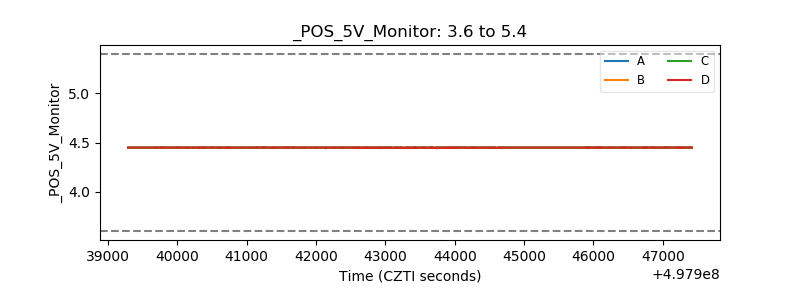 |
| _ROLL_ROT | 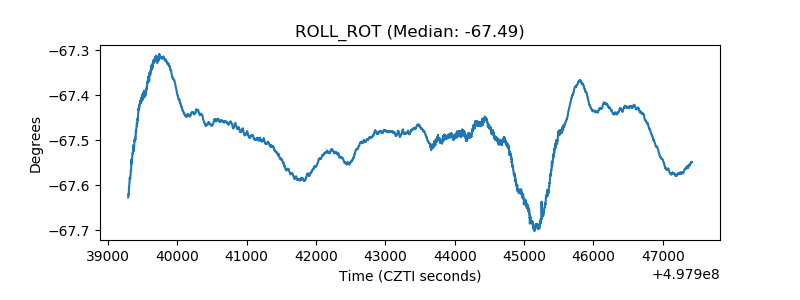 |
| _Roll_DEC | 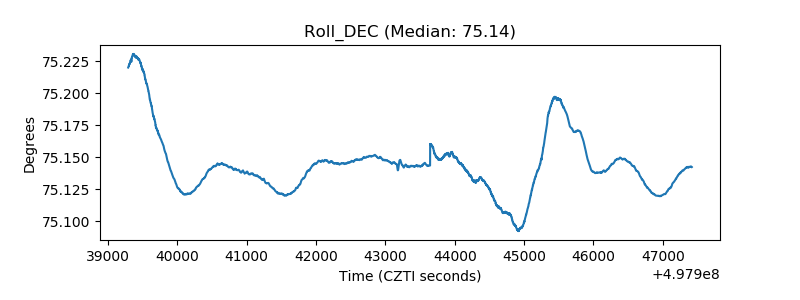 |
| _Roll_RA | 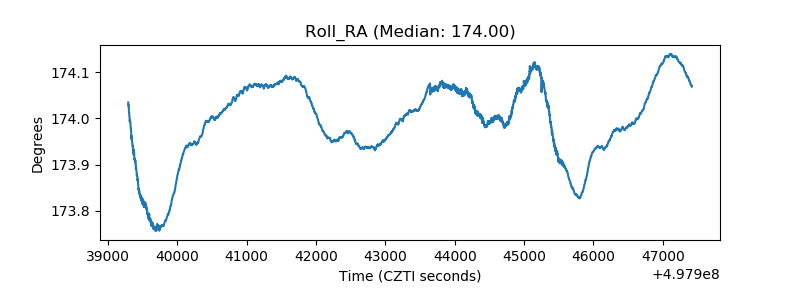 |
| Veto Counter | 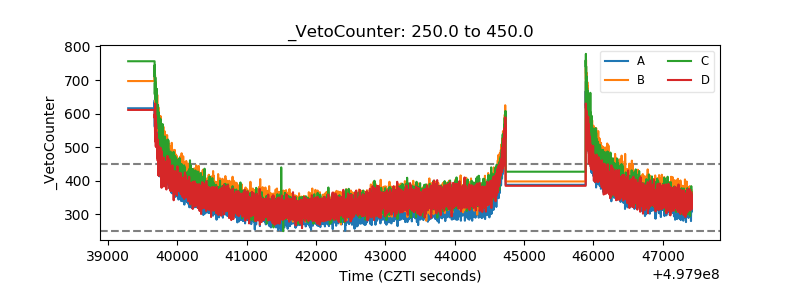 |