| Param | Original file | Final file |
|---|---|---|
| Filename | modeM0/AS1A14_126T15_9000006516_54313cztM0_level2.fits | modeM0/AS1A14_126T15_9000006516_54313cztM0_level2_quad_clean.evt |
| Size (bytes) | 585,590,400 | 71,737,920 |
| Size | 558.5 MB | 68.4 MB |
| Events in quadrant A | 3,226,293 | 541,182 |
| Events in quadrant B | 2,556,219 | 604,604 |
| Events in quadrant C | 3,571,105 | 513,524 |
| Events in quadrant D | 11,882,644 | 117,518 |
| Mode SS | |||
|---|---|---|---|
| Quadrant | BADHDUFLAG | Total packets | Discarded packets |
| A | 0 | 116 | 0 |
| B | 0 | 116 | 0 |
| C | 0 | 116 | 0 |
| D | 0 | 116 | 0 |
| Mode M0 | |||
|---|---|---|---|
| Quadrant | BADHDUFLAG | Total packets | Discarded packets |
| A | 0 | 13797 | 1 |
| B | 0 | 11873 | 1 |
| C | 0 | 14721 | 1 |
| D | 0 | 39159 | 3 |
| Mode M9 | |||
|---|---|---|---|
| Quadrant | BADHDUFLAG | Total packets | Discarded packets |
| A | 0 | 11 | 0 |
| B | 0 | 11 | 0 |
| C | 0 | 11 | 0 |
| D | 0 | 11 | 0 |
| Quadrant | Total seconds | Saturated seconds | Saturation percentage |
|---|---|---|---|
| A | 5648 | 335 | 5.931303% |
| B | 5648 | 71 | 1.257082% |
| C | 5649 | 255 | 4.514073% |
| D | 5648 | 4517 | 79.975212% |
Noise dominated data is calculated using 1-second bins in cleaned event files. If a bin has >2000 counts, and if more than 50% of those come from <1% of pixels, then it is considered to be noise-dominated and hence unusable.
| Quadrant | # 1 sec bins | Bins with >0 counts | Bins with >2000 counts | High rate bins dominated by noise | Noise dominated (total time) | Noise dominated (detector-on time) | Marked lightcurve |
|---|---|---|---|---|---|---|---|
| A | 6773 | 5649 | 205 | 205 | 3.03% | 3.63% | 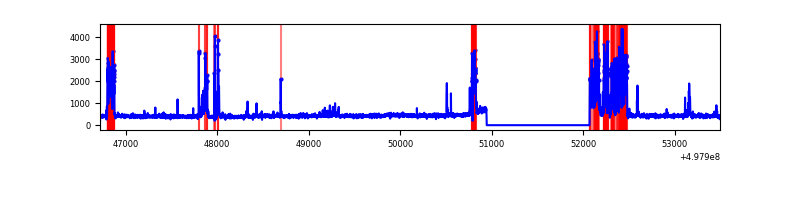 |
| B | 6773 | 5649 | 15 | 15 | 0.22% | 0.27% | 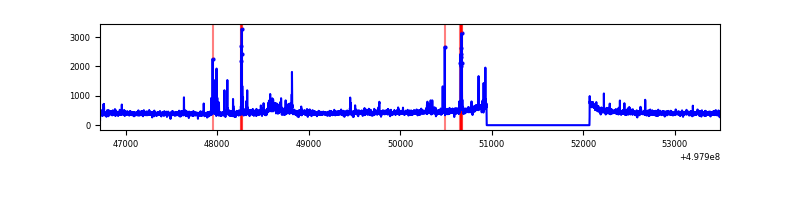 |
| C | 6774 | 5650 | 217 | 217 | 3.20% | 3.84% | 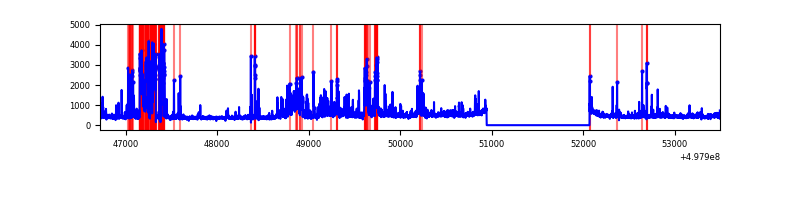 |
| D | 6773 | 5649 | 3690 | 3690 | 54.48% | 65.32% | 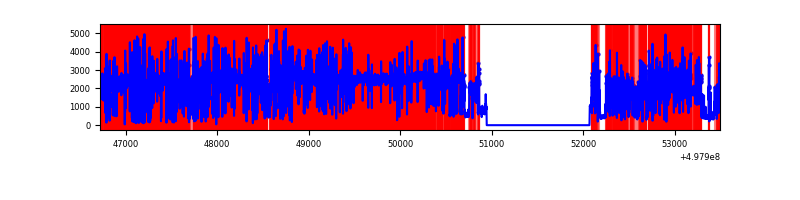 |
Top three noisy pixels from each quadrant. If the there are fewer than three noisy pixels in the level2.evt file, extra rows are filled as -1
| Pixel properties | Quadrant properties | ||||||
|---|---|---|---|---|---|---|---|
| Quadrant | DetID | PixID | Counts | Sigma | Mean | Median | Sigma |
| A | 7 | 29 | 852134 | 5773.27 | 592 | 578 | 147.5 |
| A | 4 | 3 | 37968 | 253.49 | 592 | 578 | 147.5 |
| A | 8 | 249 | 15656 | 102.22 | 592 | 578 | 147.5 |
| B | 0 | 213 | 70214 | 548.83 | 594 | 574 | 126.9 |
| B | 7 | 0 | 61035 | 476.49 | 594 | 574 | 126.9 |
| B | 9 | 251 | 25610 | 197.31 | 594 | 574 | 126.9 |
| C | 1 | 241 | 806733 | 5196.37 | 567 | 562 | 155.1 |
| C | 14 | 254 | 161180 | 1035.3 | 567 | 562 | 155.1 |
| C | 1 | 16 | 114701 | 735.71 | 567 | 562 | 155.1 |
| D | 8 | 176 | 10705092 | 162906.7 | 227 | 216 | 65.7 |
| D | 14 | 52 | 75885 | 1151.53 | 227 | 216 | 65.7 |
| D | 3 | 12 | 72943 | 1106.76 | 227 | 216 | 65.7 |
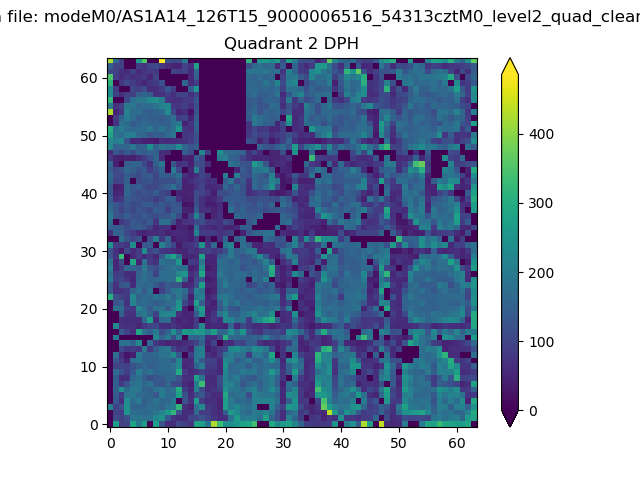
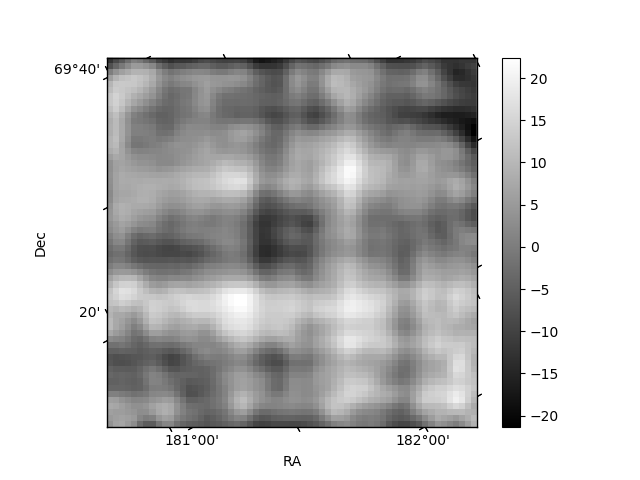
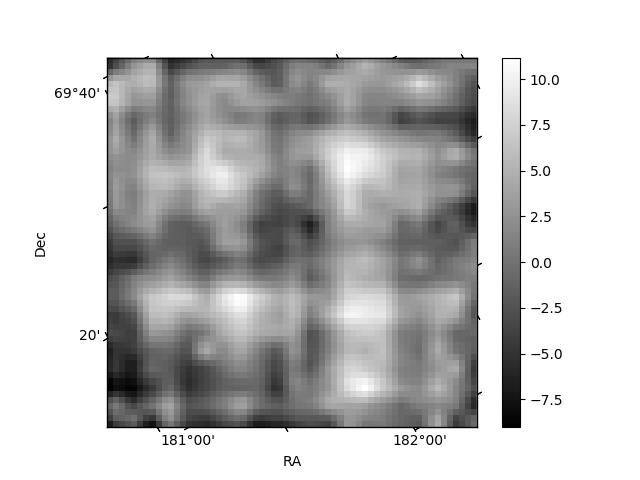
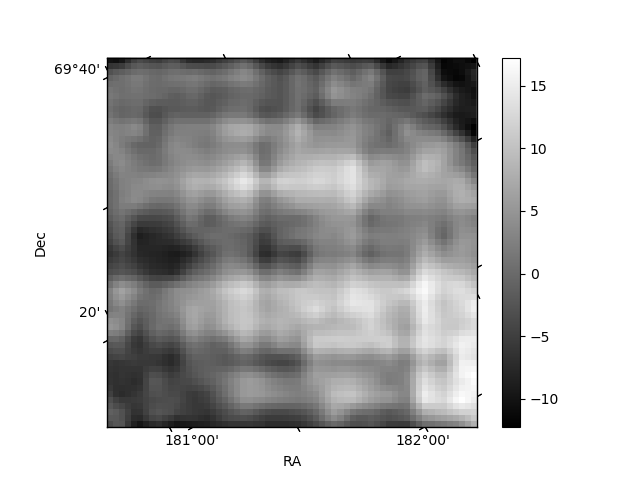
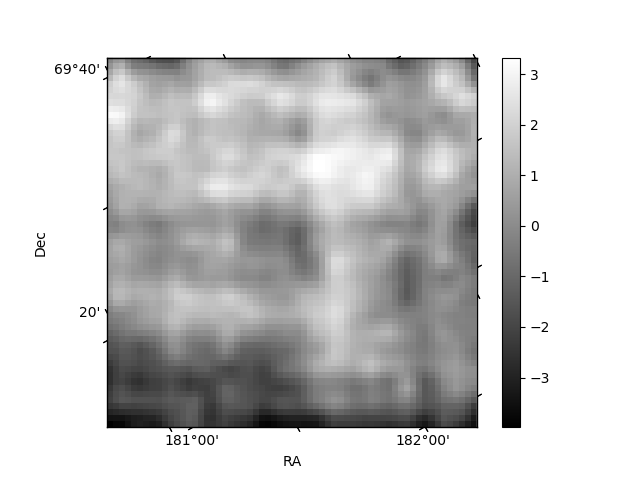
Histogram calculated using DETX and DETY for each event in the final _common_clean file
| Quadrant A | 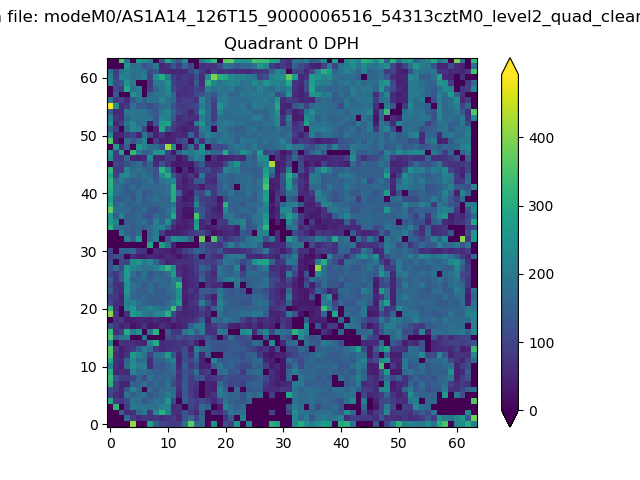 |
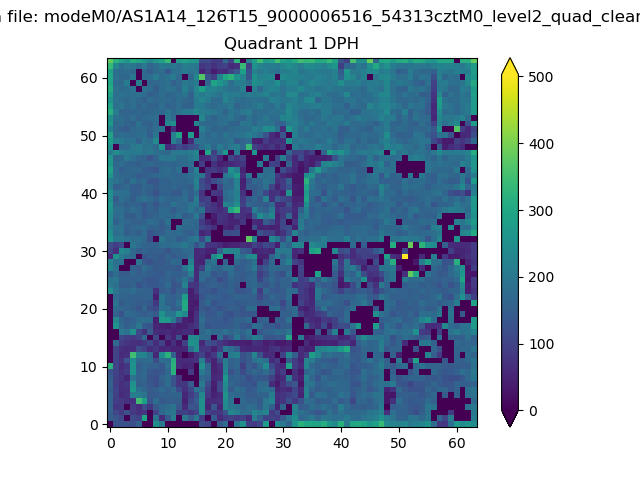 |
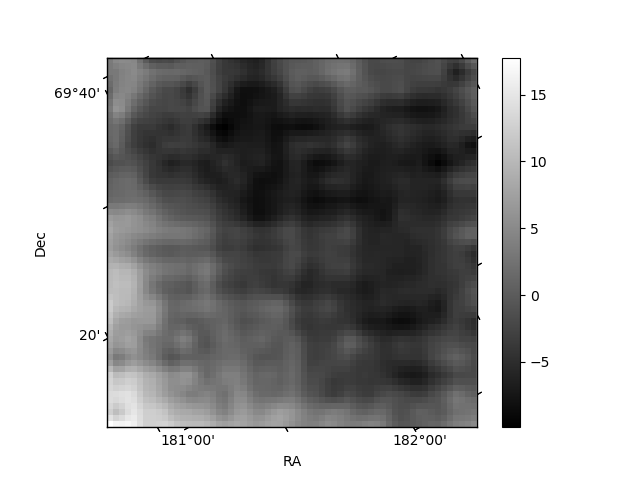
Quadrant B |
|---|---|---|---|
| Quadrant D | 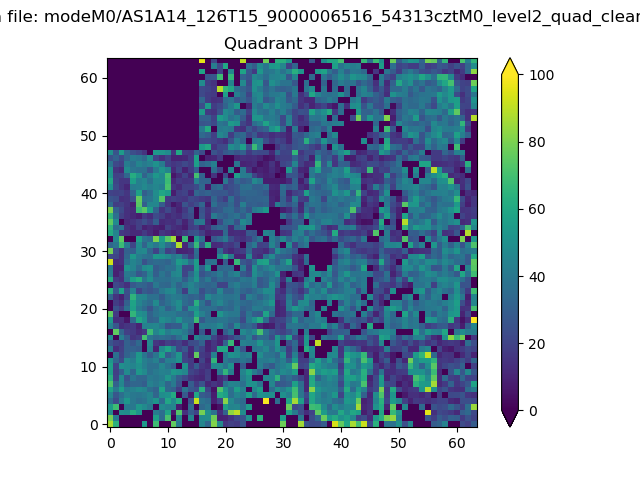 |
 |
Quadrant C |
| Plot type | Count rate plots | Images |
|---|---|---|
| Comparison with Poisson distribution Blue bars denote a histogram of data divided into 1 sec bins. Red curve is a Poisson curve with rate = median count rate of data. |
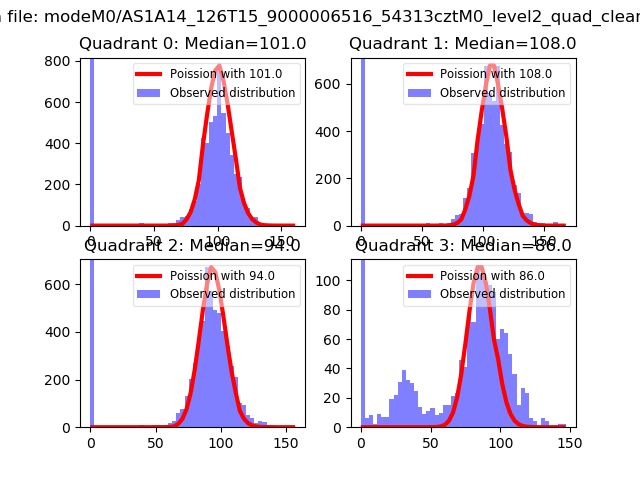 |
 |
| Quadrant-wise count rates Data is divided into 100 sec bins |
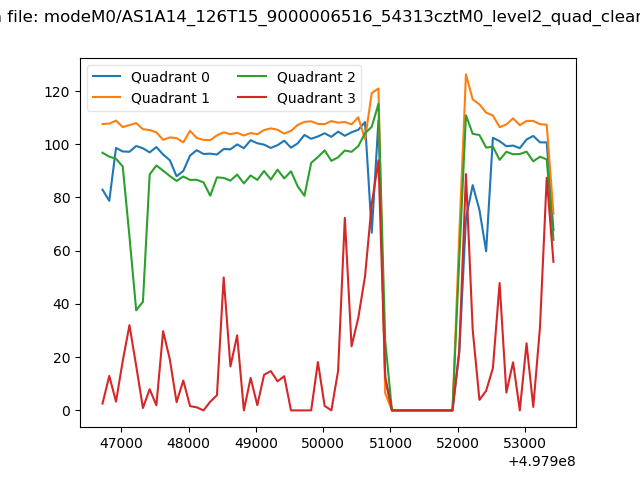 |
|
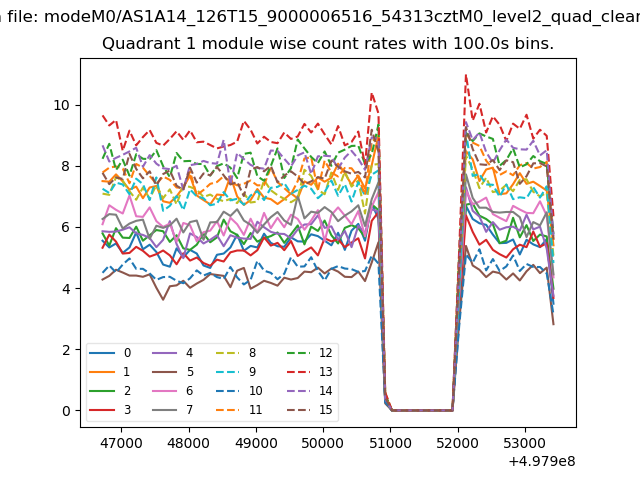
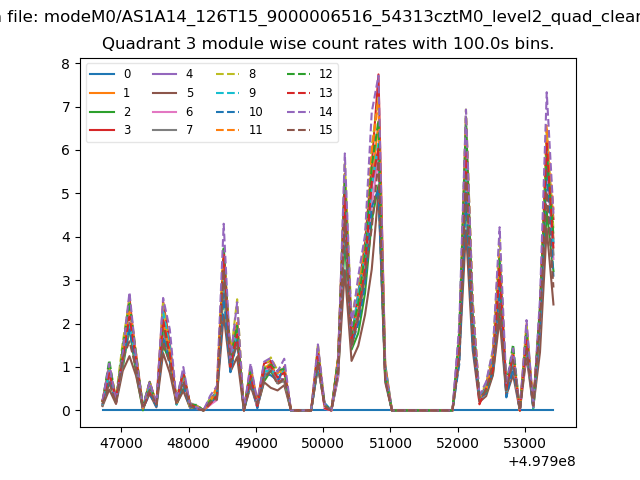
| Module-wise count rates for Quadrant A Data is divided into 100 sec bins |
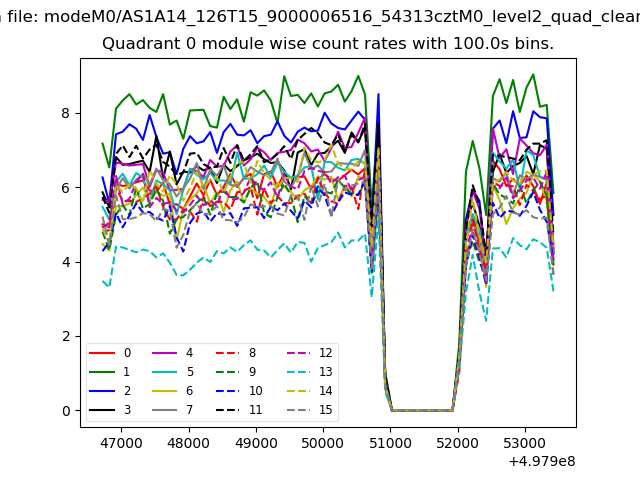 |
 |
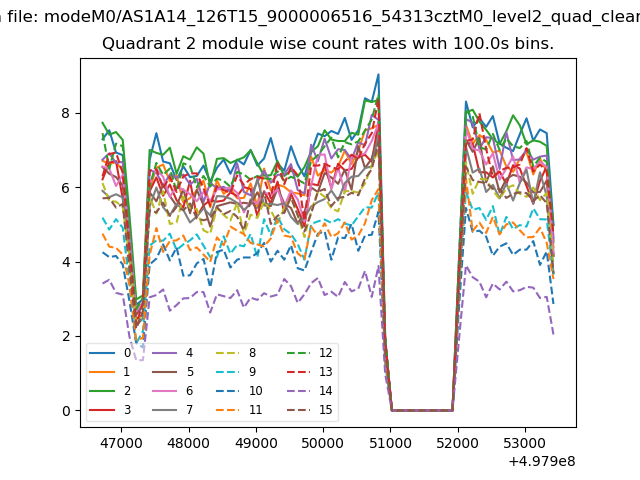
| Module-wise count rates for Quadrant B Data is divided into 100 sec bins |
 |
 |
| Module-wise count rates for Quadrant C Data is divided into 100 sec bins |
 |
 |
| Module-wise count rates for Quadrant D Data is divided into 100 sec bins |
 |
 |
| Parameter | Plot |
|---|---|
| CZT HV Monitor | 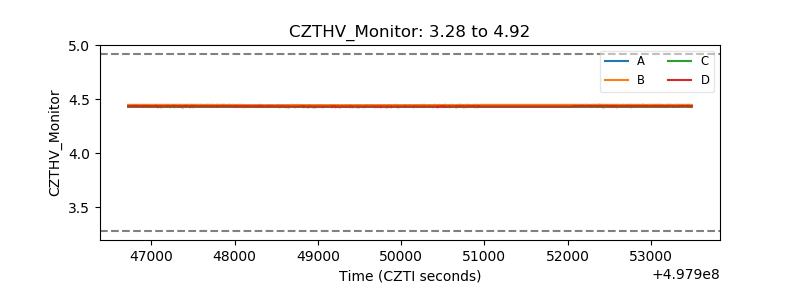 |
| D_VDD | 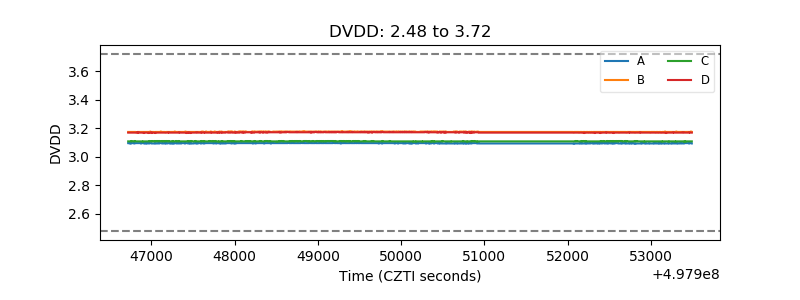 |
| Temperature 1 | 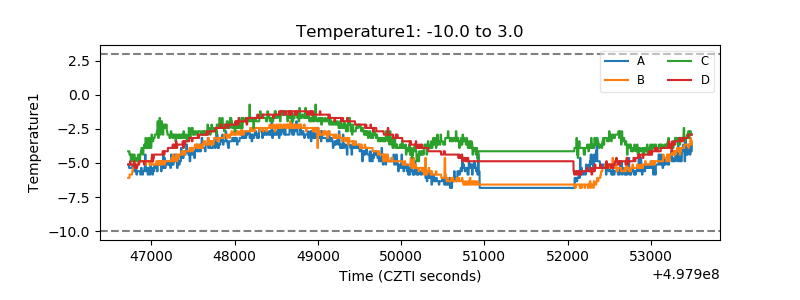 |
| Veto HV Monitor | 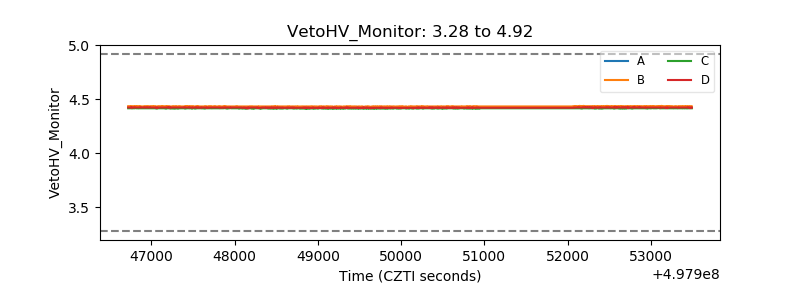 |
| Veto LLD | 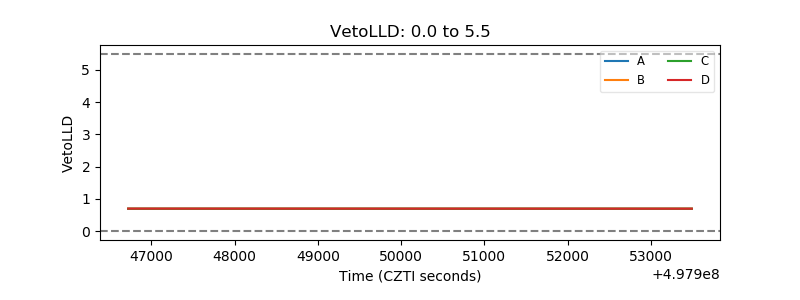 |
| Alpha Counter | 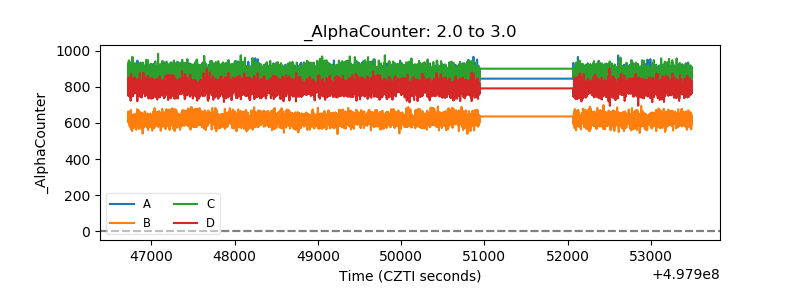 |
| _CPM_Rate | 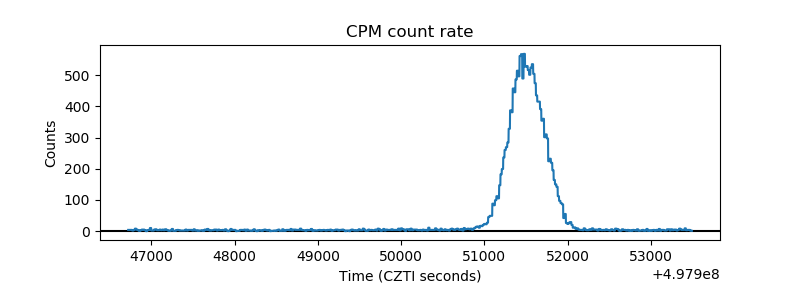 |
| CZT Counter | 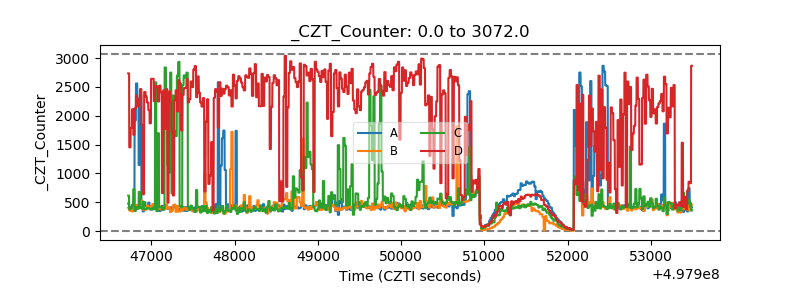 |
| +2.5 Volts monitor |  |
| +5 Volts monitor | 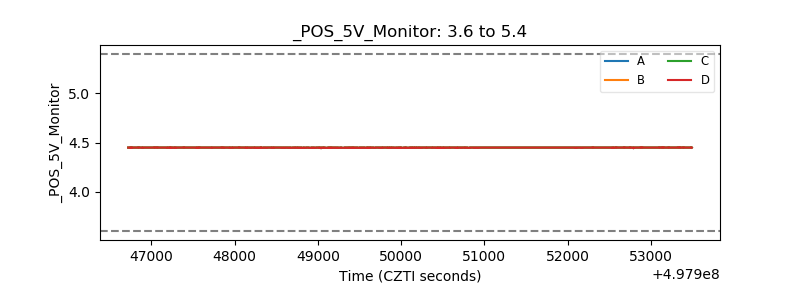 |
| _ROLL_ROT | 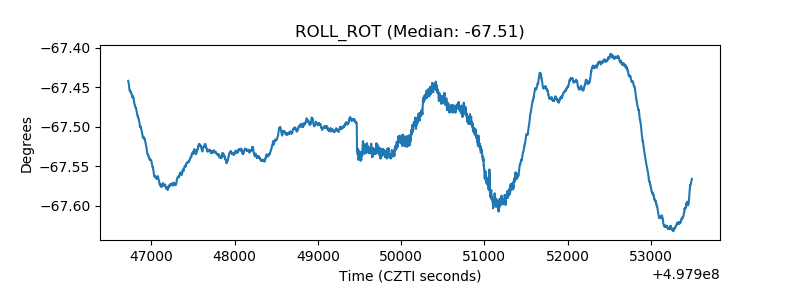 |
| _Roll_DEC | 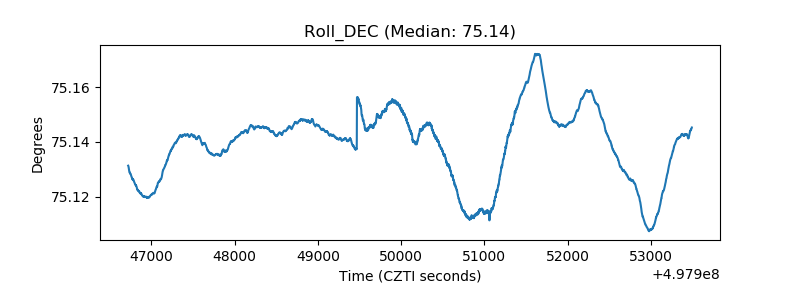 |
| _Roll_RA | 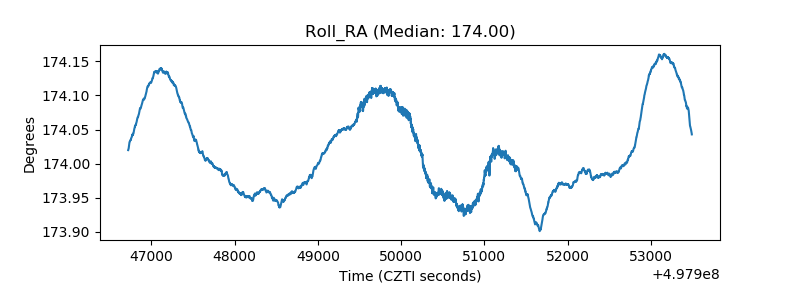 |
| Veto Counter | 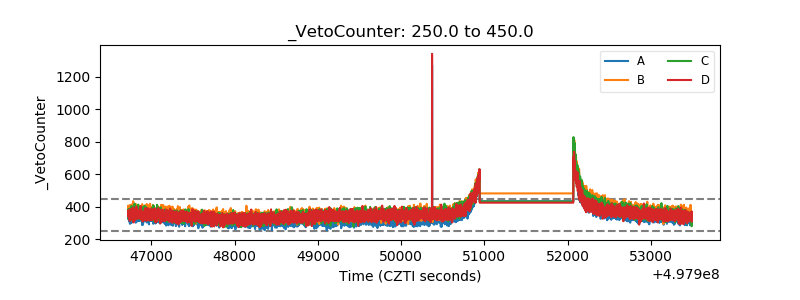 |