| Param | Original file | Final file |
|---|---|---|
| Filename | modeM0/AS1A14_126T15_9000006516_54314cztM0_level2.fits | modeM0/AS1A14_126T15_9000006516_54314cztM0_level2_quad_clean.evt |
| Size (bytes) | 550,748,160 | 86,451,840 |
| Size | 525.2 MB | 82.4 MB |
| Events in quadrant A | 4,649,523 | 559,472 |
| Events in quadrant B | 2,772,579 | 673,752 |
| Events in quadrant C | 3,575,994 | 575,985 |
| Events in quadrant D | 8,892,182 | 362,846 |
| Mode SS | |||
|---|---|---|---|
| Quadrant | BADHDUFLAG | Total packets | Discarded packets |
| A | 0 | 132 | 0 |
| B | 0 | 132 | 0 |
| C | 0 | 132 | 0 |
| D | 0 | 132 | 0 |
| Mode M0 | |||
|---|---|---|---|
| Quadrant | BADHDUFLAG | Total packets | Discarded packets |
| A | 0 | 18394 | 1 |
| B | 0 | 13110 | 1 |
| C | 0 | 15337 | 1 |
| D | 0 | 30838 | 2 |
| Mode M9 | |||
|---|---|---|---|
| Quadrant | BADHDUFLAG | Total packets | Discarded packets |
| A | 0 | 10 | 0 |
| B | 0 | 10 | 0 |
| C | 0 | 10 | 0 |
| D | 0 | 10 | 0 |
| Quadrant | Total seconds | Saturated seconds | Saturation percentage |
|---|---|---|---|
| A | 6380 | 865 | 13.557994% |
| B | 6381 | 64 | 1.002978% |
| C | 6381 | 223 | 3.494750% |
| D | 6380 | 2426 | 38.025078% |
Noise dominated data is calculated using 1-second bins in cleaned event files. If a bin has >2000 counts, and if more than 50% of those come from <1% of pixels, then it is considered to be noise-dominated and hence unusable.
| Quadrant | # 1 sec bins | Bins with >0 counts | Bins with >2000 counts | High rate bins dominated by noise | Noise dominated (total time) | Noise dominated (detector-on time) | Marked lightcurve |
|---|---|---|---|---|---|---|---|
| A | 7425 | 6381 | 569 | 569 | 7.66% | 8.92% | 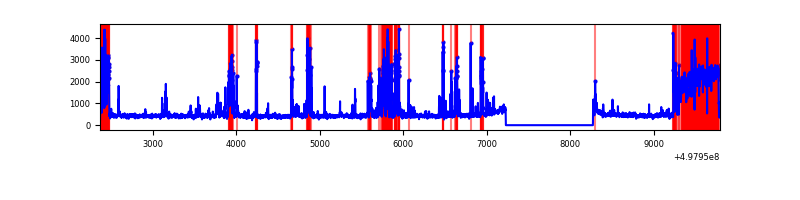 |
| B | 7426 | 6382 | 6 | 6 | 0.08% | 0.09% | 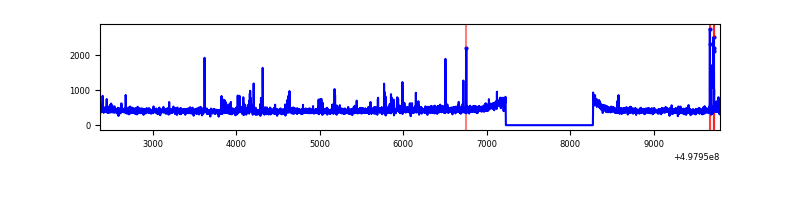 |
| C | 7426 | 6382 | 187 | 187 | 2.52% | 2.93% | 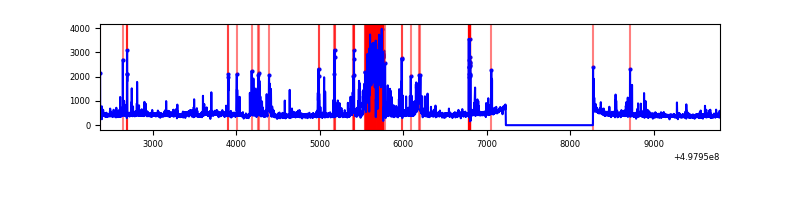 |
| D | 7425 | 6381 | 1890 | 1890 | 25.45% | 29.62% | 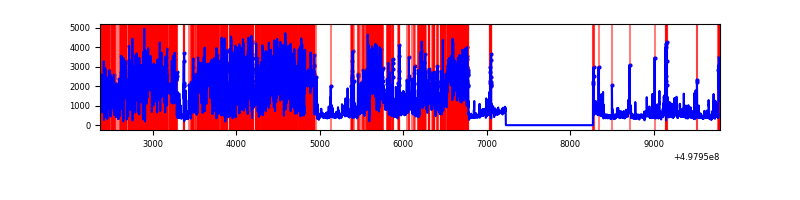 |
Top three noisy pixels from each quadrant. If the there are fewer than three noisy pixels in the level2.evt file, extra rows are filled as -1
| Pixel properties | Quadrant properties | ||||||
|---|---|---|---|---|---|---|---|
| Quadrant | DetID | PixID | Counts | Sigma | Mean | Median | Sigma |
| A | 7 | 29 | 1583255 | 10288.72 | 624 | 609 | 153.8 |
| A | 0 | 8 | 495141 | 3214.93 | 624 | 609 | 153.8 |
| A | 4 | 3 | 32243 | 205.65 | 624 | 609 | 153.8 |
| B | 0 | 213 | 52096 | 359.82 | 669 | 644 | 143.0 |
| B | 10 | 247 | 32046 | 219.6 | 669 | 644 | 143.0 |
| B | 12 | 111 | 16824 | 113.15 | 669 | 644 | 143.0 |
| C | 1 | 241 | 499067 | 2812.45 | 641 | 632 | 177.2 |
| C | 14 | 254 | 178640 | 1004.42 | 641 | 632 | 177.2 |
| C | 1 | 16 | 156187 | 877.73 | 641 | 632 | 177.2 |
| D | 8 | 176 | 5905833 | 40035.83 | 514 | 490 | 147.5 |
| D | 3 | 12 | 403851 | 2734.62 | 514 | 490 | 147.5 |
| D | 14 | 52 | 319497 | 2162.74 | 514 | 490 | 147.5 |
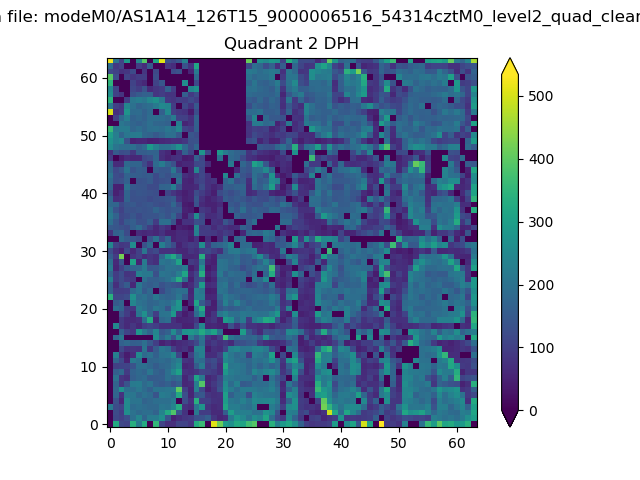
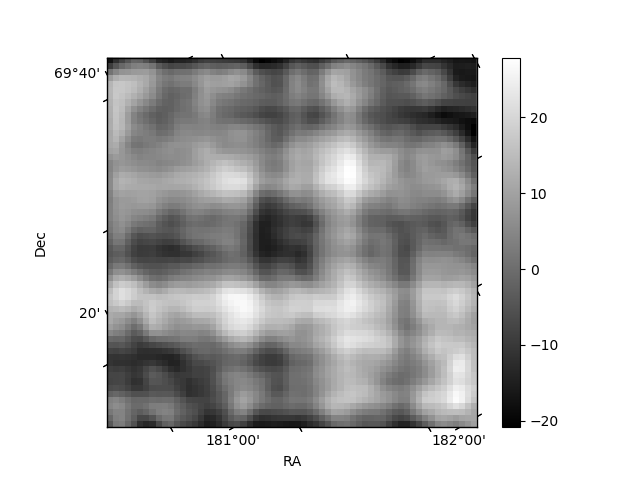
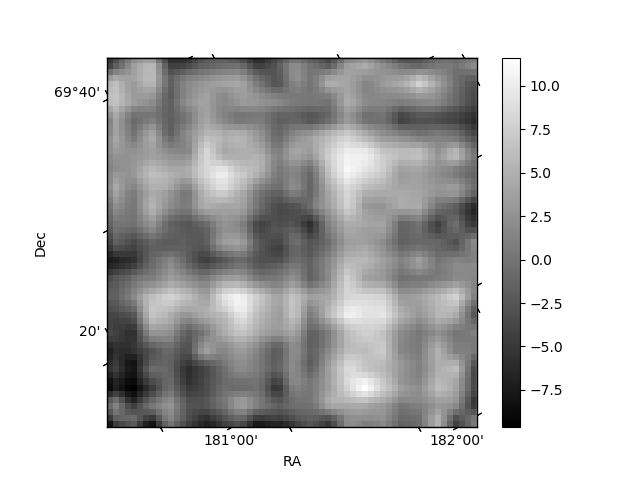
Histogram calculated using DETX and DETY for each event in the final _common_clean file
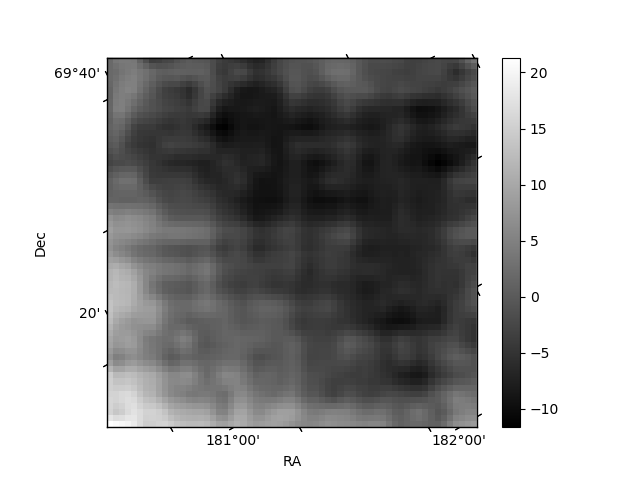
| Quadrant A | 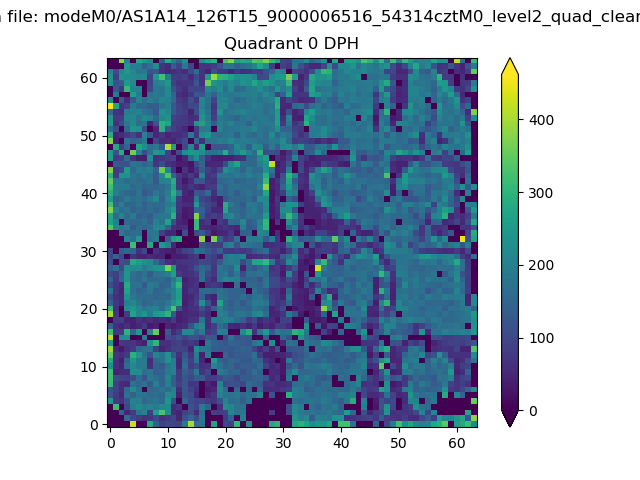 |
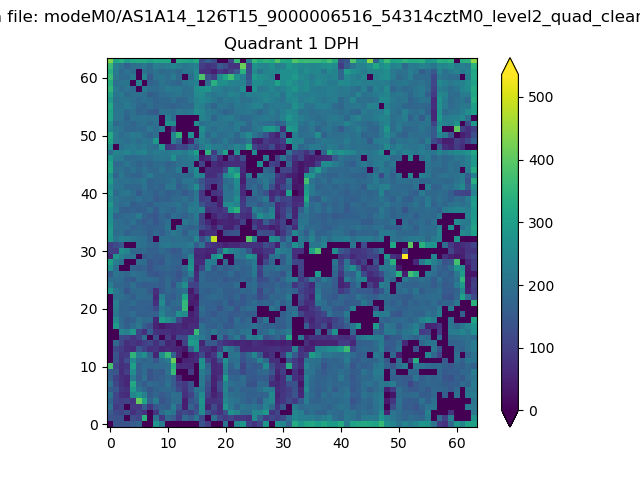 |
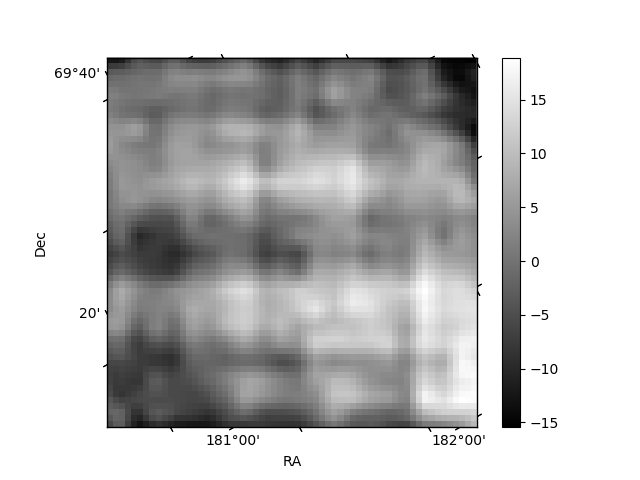
Quadrant B |
|---|---|---|---|
| Quadrant D | 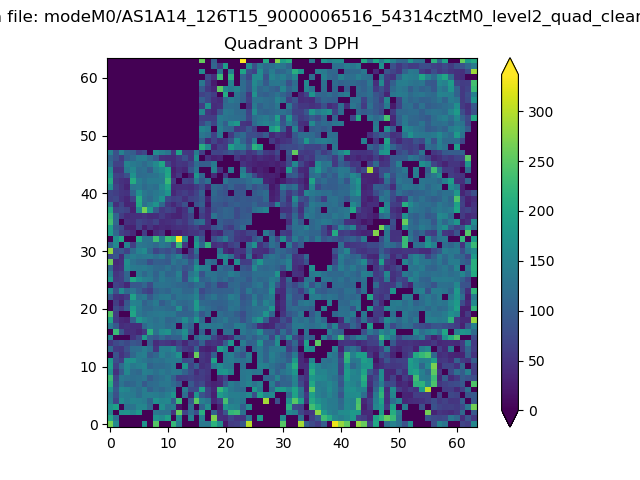 |
 |
Quadrant C |
| Plot type | Count rate plots | Images |
|---|---|---|
| Comparison with Poisson distribution Blue bars denote a histogram of data divided into 1 sec bins. Red curve is a Poisson curve with rate = median count rate of data. |
 |
 |
| Quadrant-wise count rates Data is divided into 100 sec bins |
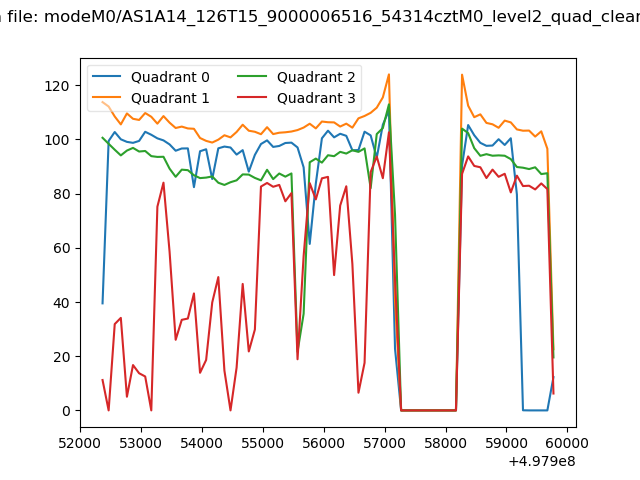 |
|
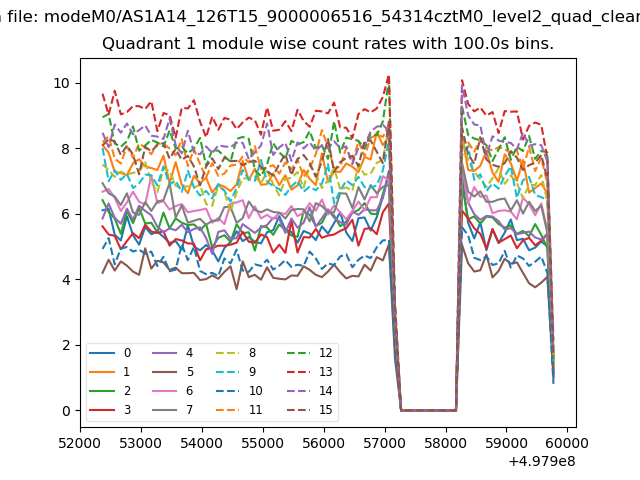
| Module-wise count rates for Quadrant A Data is divided into 100 sec bins |
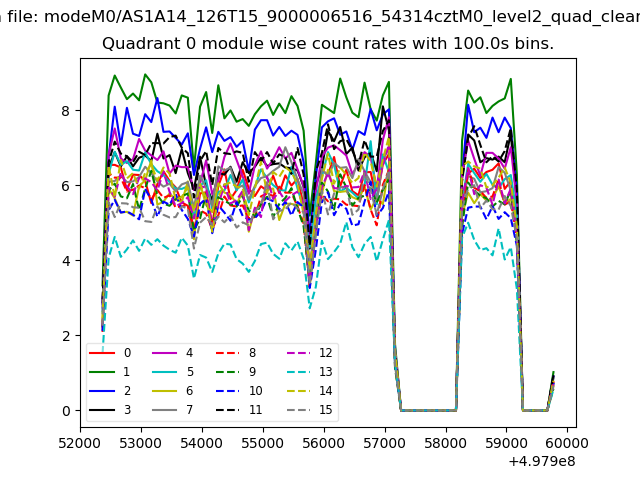 |
 |
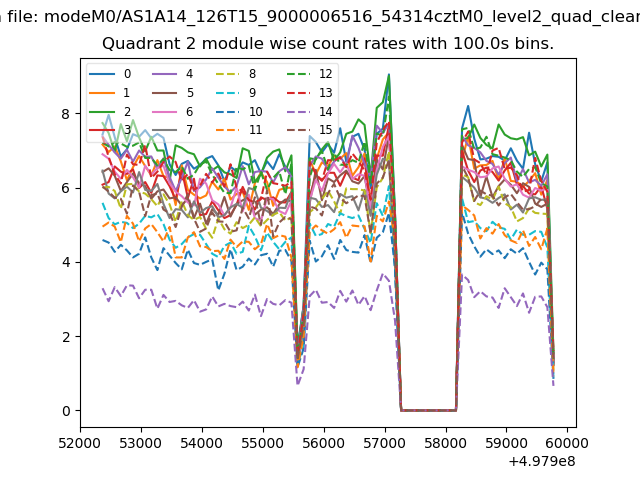
| Module-wise count rates for Quadrant B Data is divided into 100 sec bins |
 |
 |
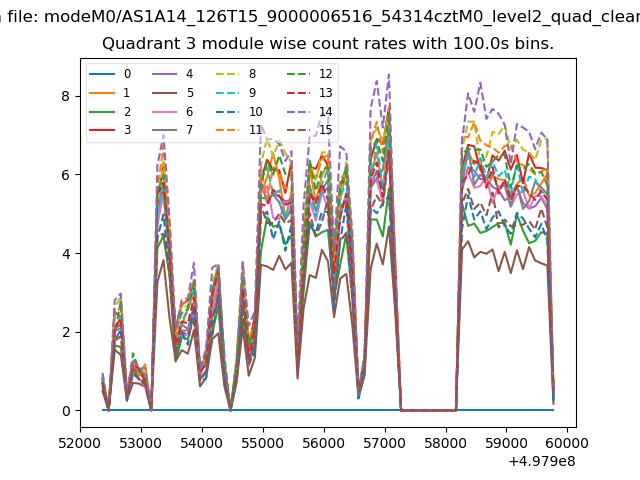
| Module-wise count rates for Quadrant C Data is divided into 100 sec bins |
 |
 |
| Module-wise count rates for Quadrant D Data is divided into 100 sec bins |
 |
 |
| Parameter | Plot |
|---|---|
| CZT HV Monitor | 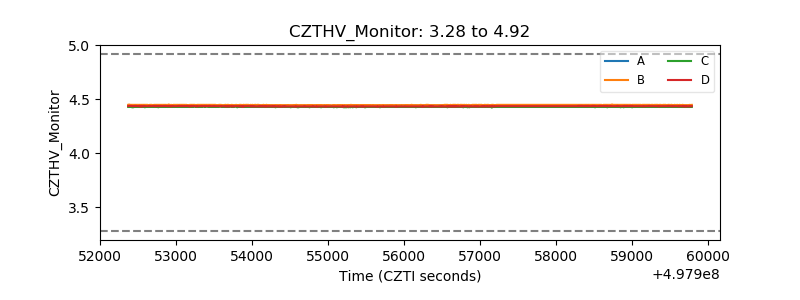 |
| D_VDD | 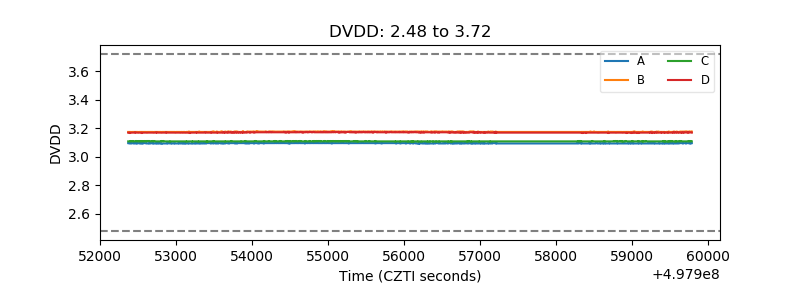 |
| Temperature 1 | 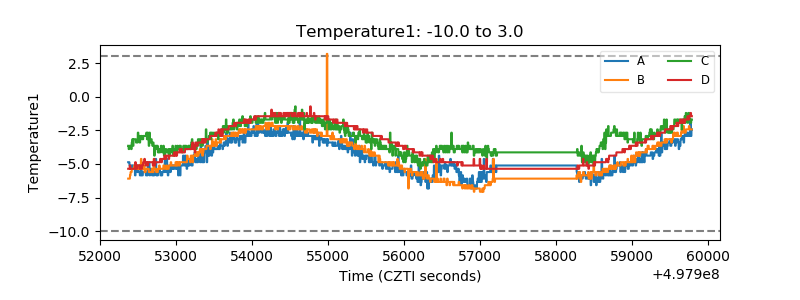 |
| Veto HV Monitor | 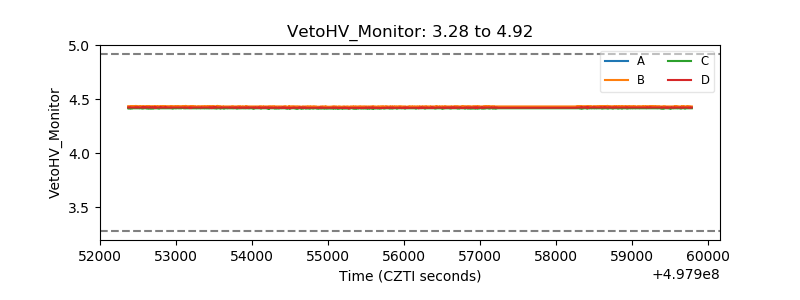 |
| Veto LLD | 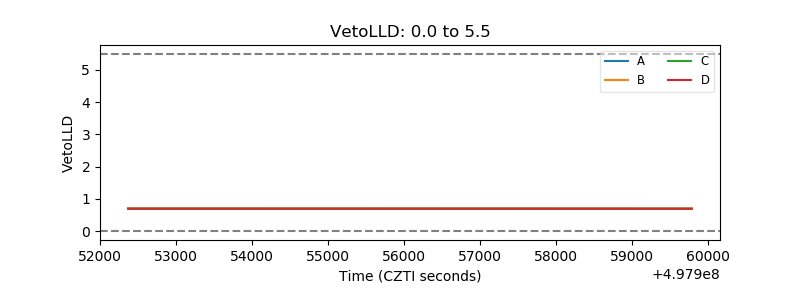 |
| Alpha Counter | 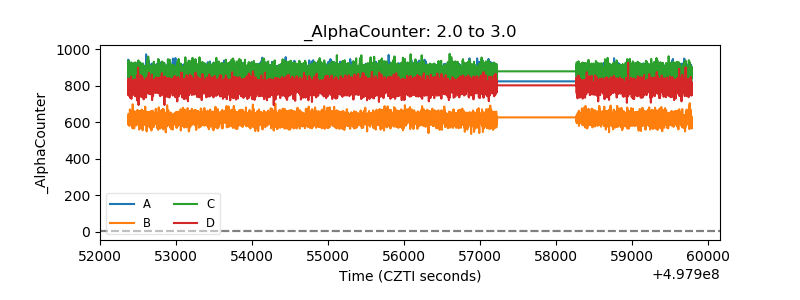 |
| _CPM_Rate | 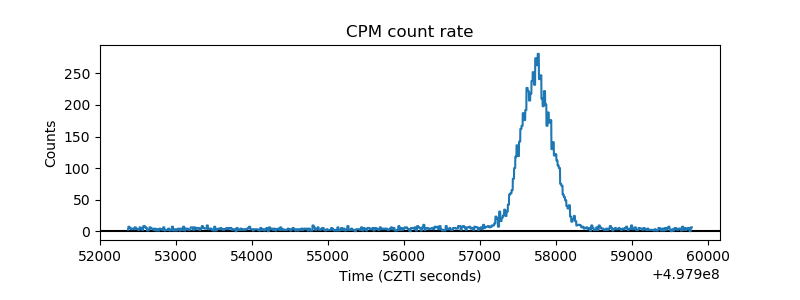 |
| CZT Counter | 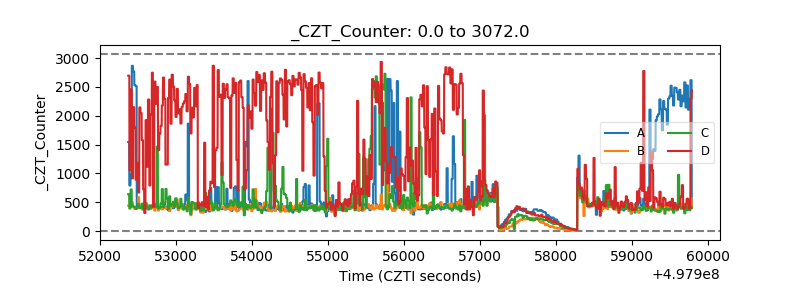 |
| +2.5 Volts monitor |  |
| +5 Volts monitor | 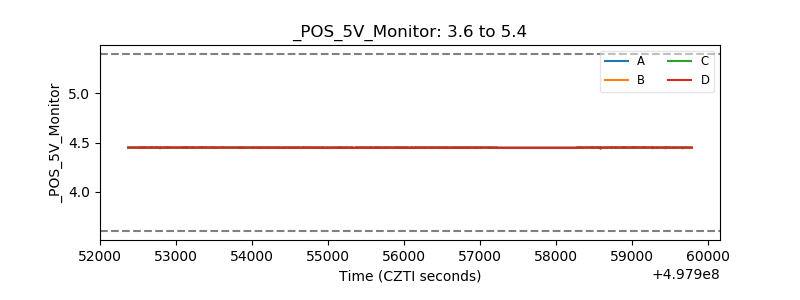 |
| _ROLL_ROT | 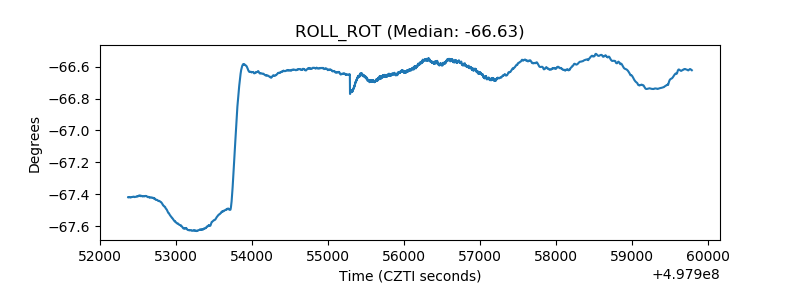 |
| _Roll_DEC | 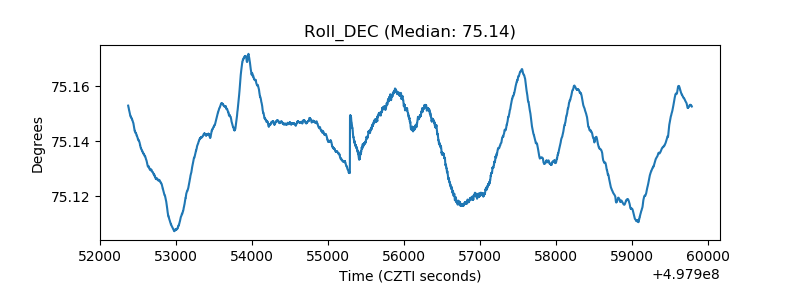 |
| _Roll_RA | 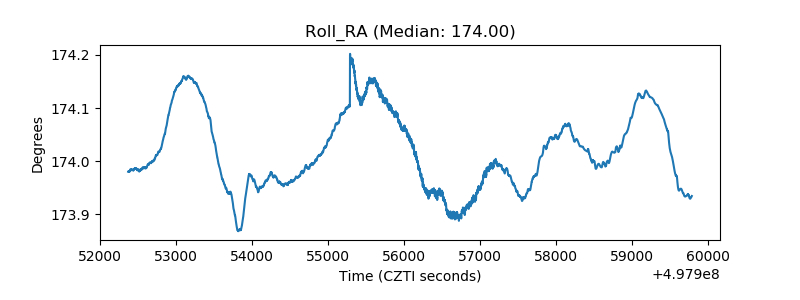 |
| Veto Counter | 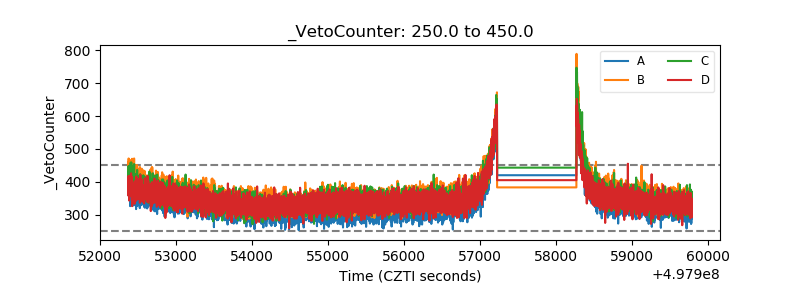 |