| Param | Original file | Final file |
|---|---|---|
| Filename | modeM0/AS1A14_126T15_9000006516_54316cztM0_level2.fits | modeM0/AS1A14_126T15_9000006516_54316cztM0_level2_quad_clean.evt |
| Size (bytes) | 675,976,320 | 100,984,320 |
| Size | 644.7 MB | 96.3 MB |
| Events in quadrant A | 3,689,808 | 723,862 |
| Events in quadrant B | 5,674,479 | 678,994 |
| Events in quadrant C | 4,703,463 | 641,927 |
| Events in quadrant D | 10,365,257 | 484,504 |
| Mode SS | |||
|---|---|---|---|
| Quadrant | BADHDUFLAG | Total packets | Discarded packets |
| A | 0 | 154 | 0 |
| B | 0 | 154 | 0 |
| C | 0 | 154 | 0 |
| D | 0 | 154 | 0 |
| Mode M0 | |||
|---|---|---|---|
| Quadrant | BADHDUFLAG | Total packets | Discarded packets |
| A | 0 | 16505 | 2 |
| B | 0 | 22461 | 2 |
| C | 0 | 19728 | 2 |
| D | 0 | 36086 | 2 |
| Mode M9 | |||
|---|---|---|---|
| Quadrant | BADHDUFLAG | Total packets | Discarded packets |
| A | 0 | 2 | 0 |
| B | 0 | 2 | 0 |
| C | 0 | 2 | 0 |
| D | 0 | 2 | 0 |
| Quadrant | Total seconds | Saturated seconds | Saturation percentage |
|---|---|---|---|
| A | 7592 | 182 | 2.397260% |
| B | 7593 | 1063 | 13.999737% |
| C | 7593 | 534 | 7.032793% |
| D | 7593 | 2152 | 28.341894% |
Noise dominated data is calculated using 1-second bins in cleaned event files. If a bin has >2000 counts, and if more than 50% of those come from <1% of pixels, then it is considered to be noise-dominated and hence unusable.
| Quadrant | # 1 sec bins | Bins with >0 counts | Bins with >2000 counts | High rate bins dominated by noise | Noise dominated (total time) | Noise dominated (detector-on time) | Marked lightcurve |
|---|---|---|---|---|---|---|---|
| A | 7802 | 7593 | 42 | 42 | 0.54% | 0.55% | 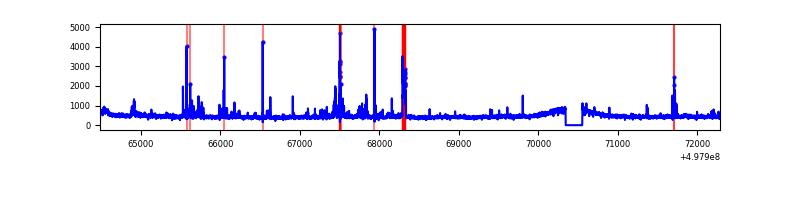 |
| B | 7803 | 7594 | 803 | 803 | 10.29% | 10.57% | 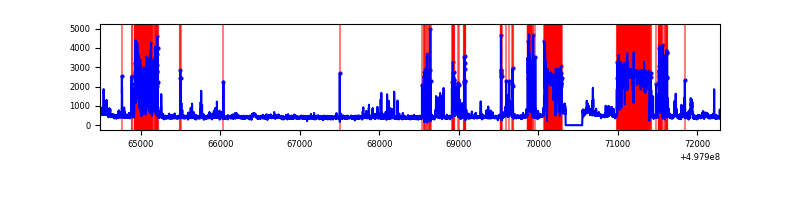 |
| C | 7803 | 7594 | 378 | 378 | 4.84% | 4.98% | 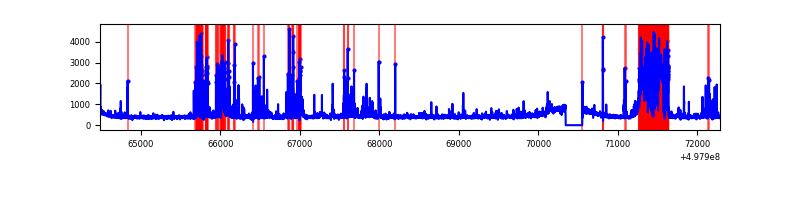 |
| D | 7803 | 7594 | 1843 | 1843 | 23.62% | 24.27% | 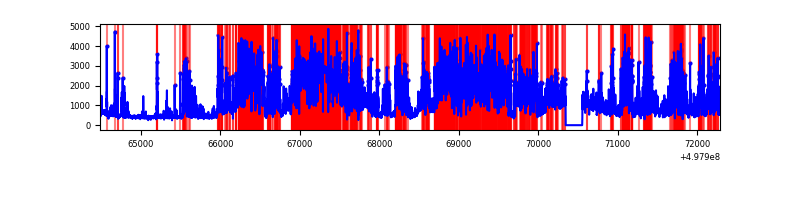 |
Top three noisy pixels from each quadrant. If the there are fewer than three noisy pixels in the level2.evt file, extra rows are filled as -1
| Pixel properties | Quadrant properties | ||||||
|---|---|---|---|---|---|---|---|
| Quadrant | DetID | PixID | Counts | Sigma | Mean | Median | Sigma |
| A | 15 | 174 | 140633 | 694.05 | 823 | 802 | 201.5 |
| A | 6 | 161 | 64774 | 317.52 | 823 | 802 | 201.5 |
| A | 3 | 14 | 56506 | 276.49 | 823 | 802 | 201.5 |
| B | 10 | 245 | 2468416 | 15766.44 | 729 | 703 | 156.5 |
| B | 5 | 172 | 84817 | 537.41 | 729 | 703 | 156.5 |
| B | 0 | 213 | 64977 | 410.65 | 729 | 703 | 156.5 |
| C | 12 | 2 | 1002785 | 4802.24 | 771 | 762 | 208.7 |
| C | 1 | 241 | 335945 | 1606.38 | 771 | 762 | 208.7 |
| C | 14 | 254 | 119358 | 568.38 | 771 | 762 | 208.7 |
| D | 8 | 176 | 6476023 | 32226.38 | 706 | 671 | 200.9 |
| D | 3 | 12 | 363794 | 1807.18 | 706 | 671 | 200.9 |
| D | 2 | 249 | 151431 | 750.3 | 706 | 671 | 200.9 |
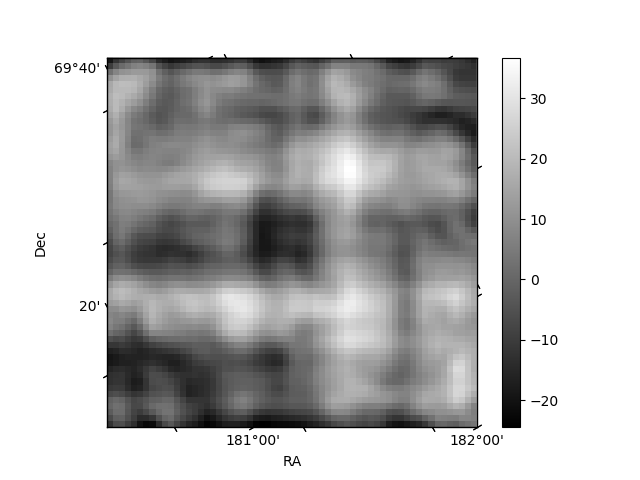
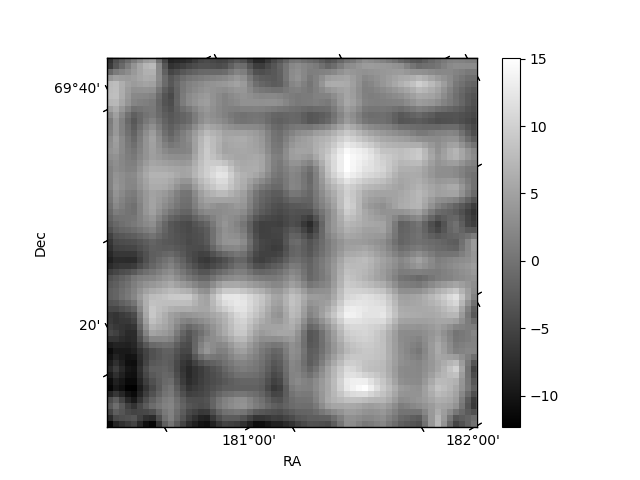
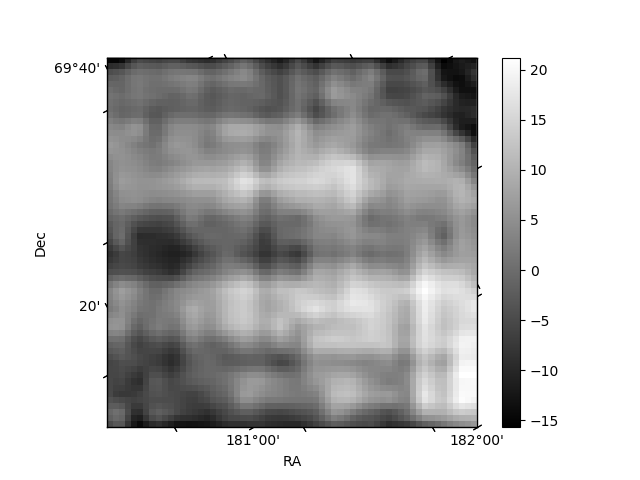
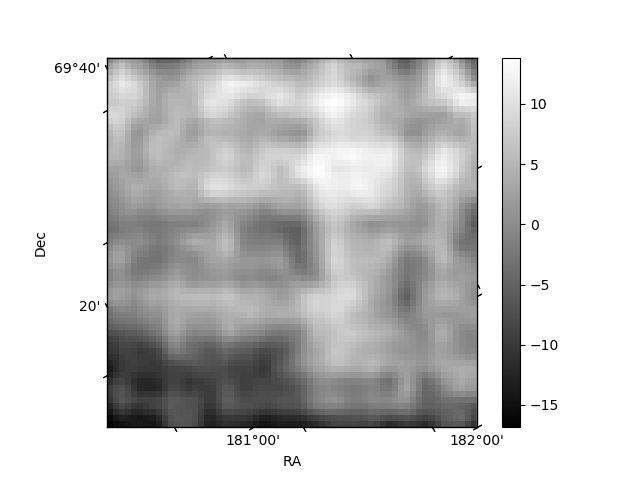
Histogram calculated using DETX and DETY for each event in the final _common_clean file
| Quadrant A | 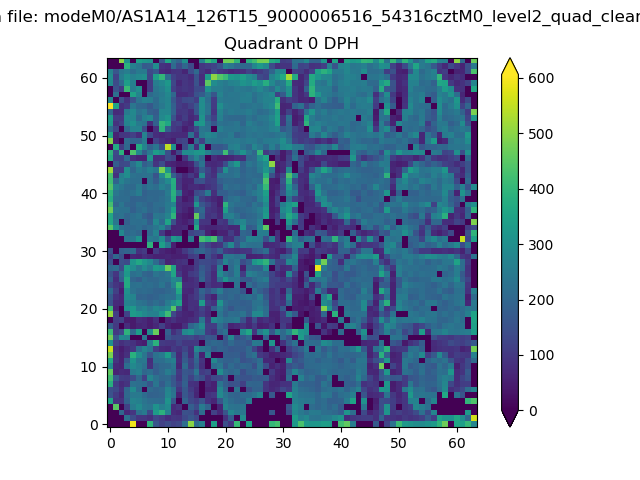 |
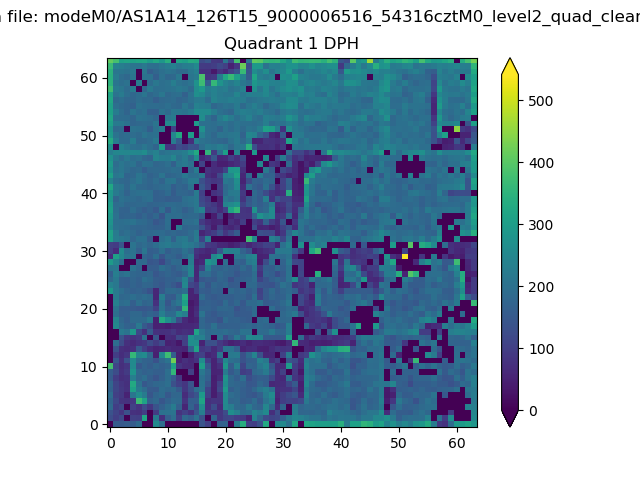 |
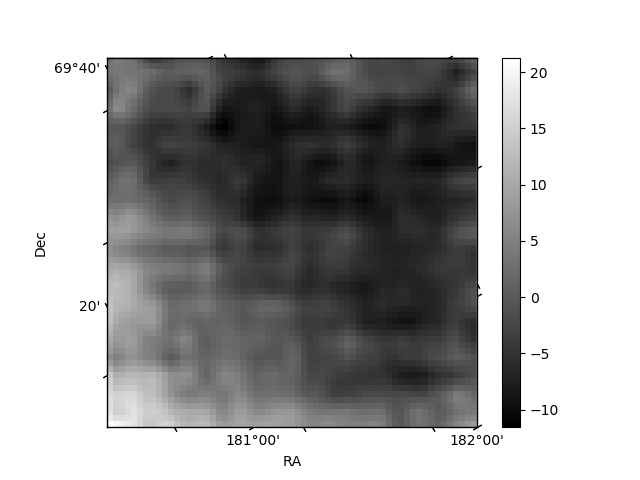
Quadrant B |
|---|---|---|---|
| Quadrant D | 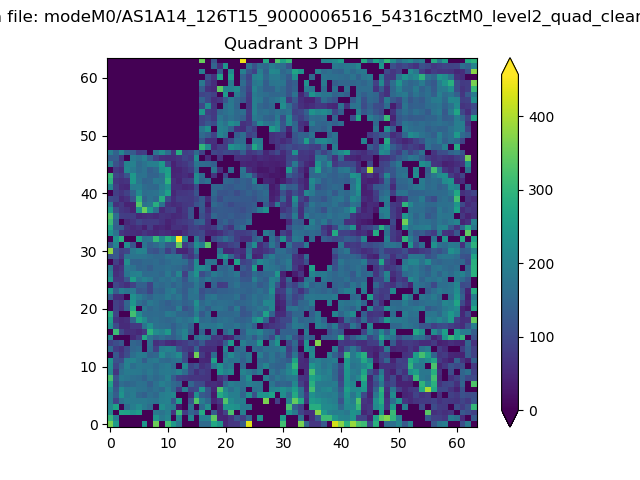 |
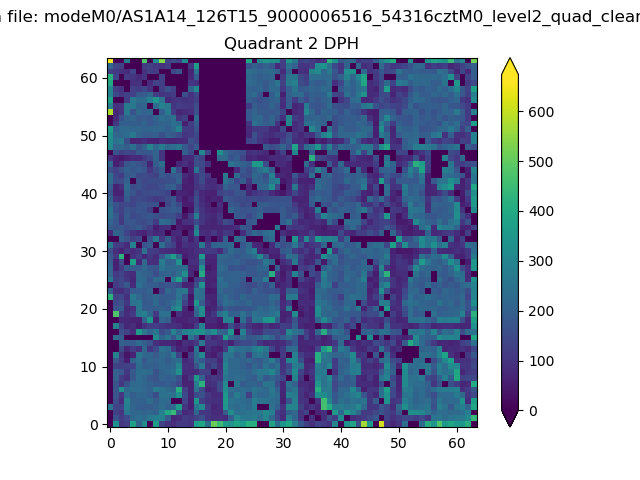 |
Quadrant C |
| Plot type | Count rate plots | Images |
|---|---|---|
| Comparison with Poisson distribution Blue bars denote a histogram of data divided into 1 sec bins. Red curve is a Poisson curve with rate = median count rate of data. |
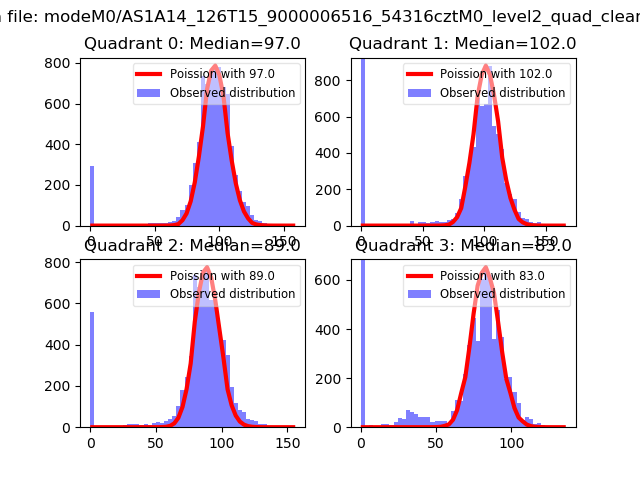 |
 |
| Quadrant-wise count rates Data is divided into 100 sec bins |
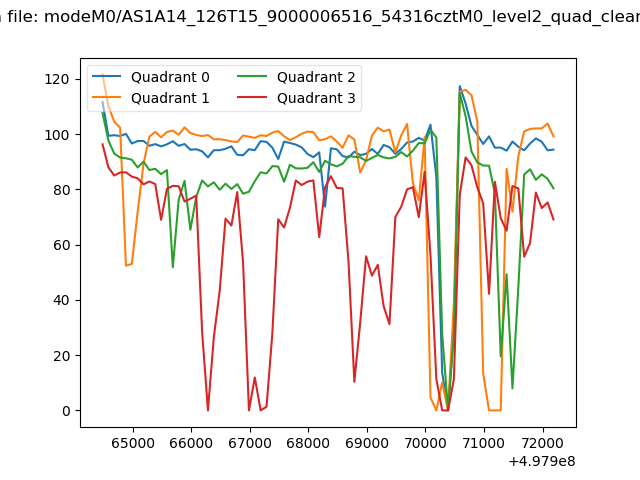 |
|
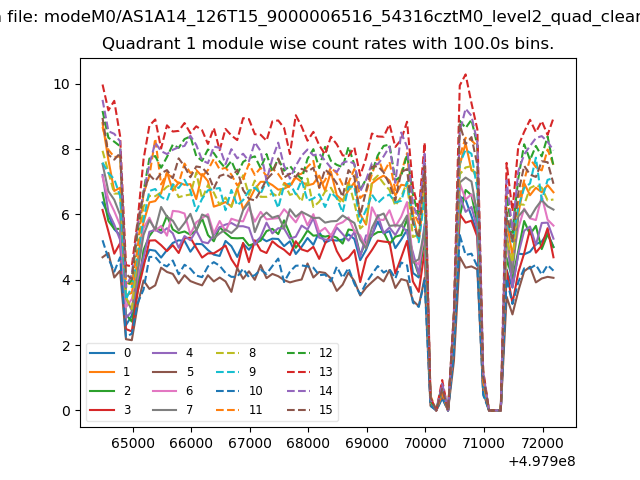
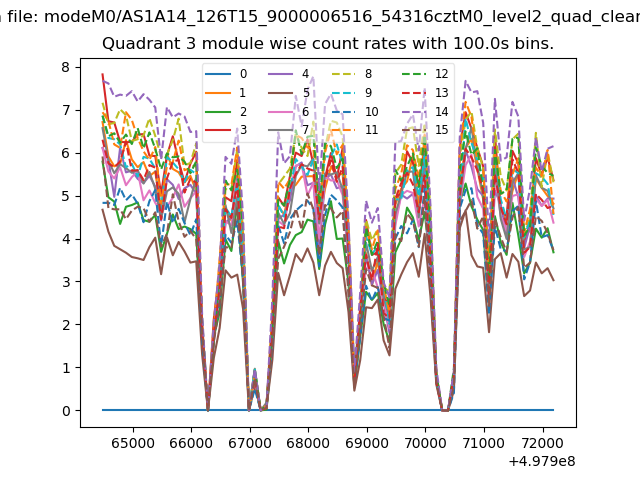
| Module-wise count rates for Quadrant A Data is divided into 100 sec bins |
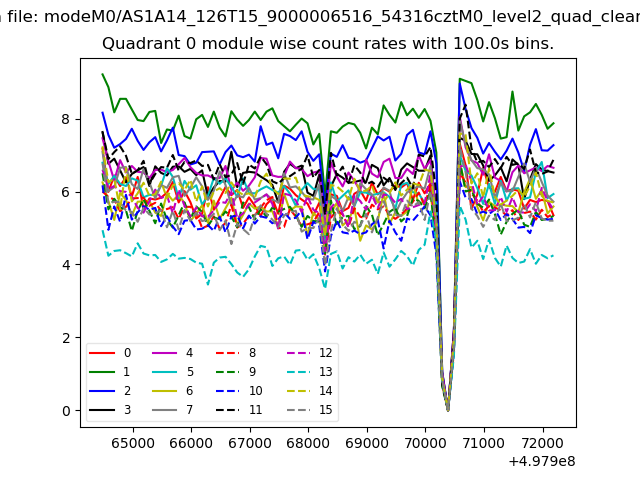 |
 |
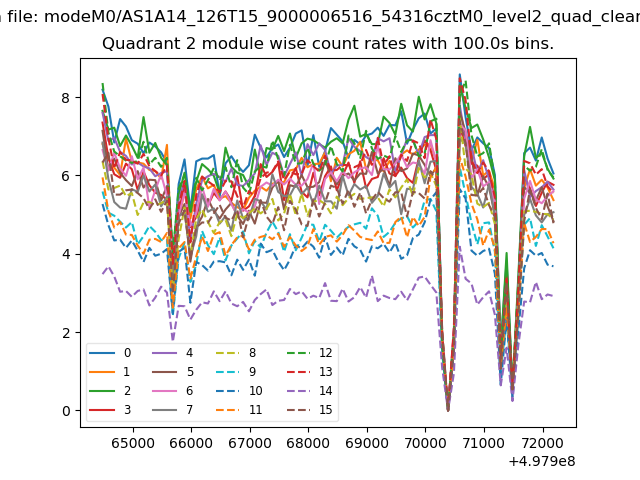
| Module-wise count rates for Quadrant B Data is divided into 100 sec bins |
 |
 |
| Module-wise count rates for Quadrant C Data is divided into 100 sec bins |
 |
 |
| Module-wise count rates for Quadrant D Data is divided into 100 sec bins |
 |
 |
| Parameter | Plot |
|---|---|
| CZT HV Monitor | 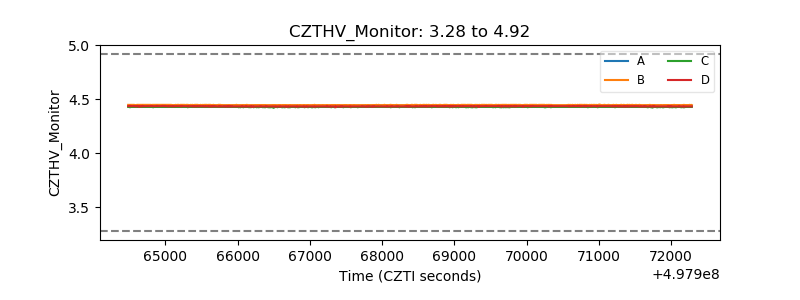 |
| D_VDD | 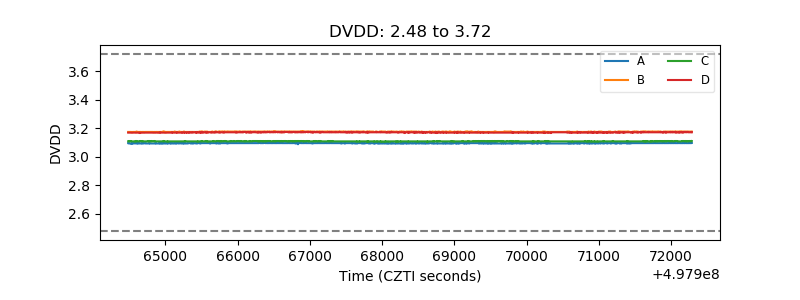 |
| Temperature 1 | 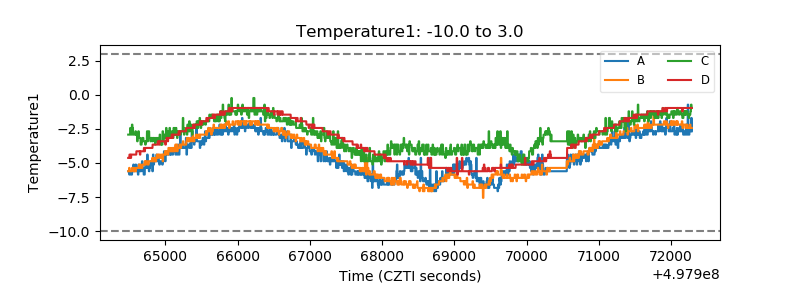 |
| Veto HV Monitor |  |
| Veto LLD | 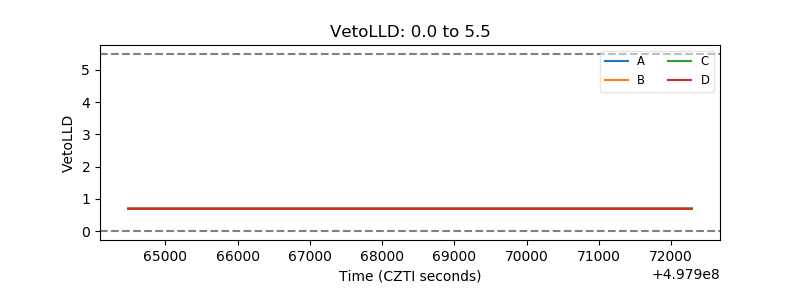 |
| Alpha Counter | 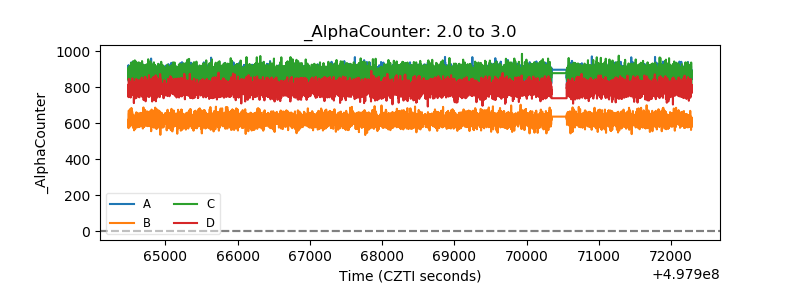 |
| _CPM_Rate | 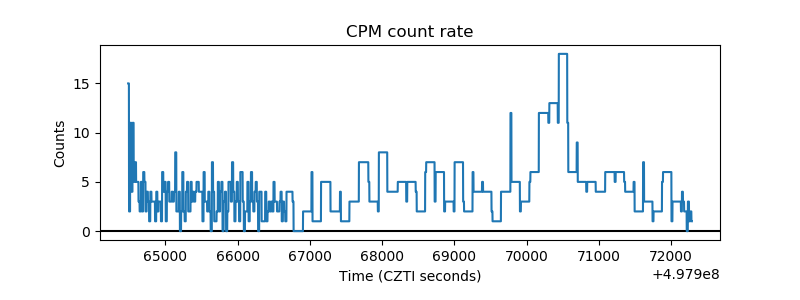 |
| CZT Counter | 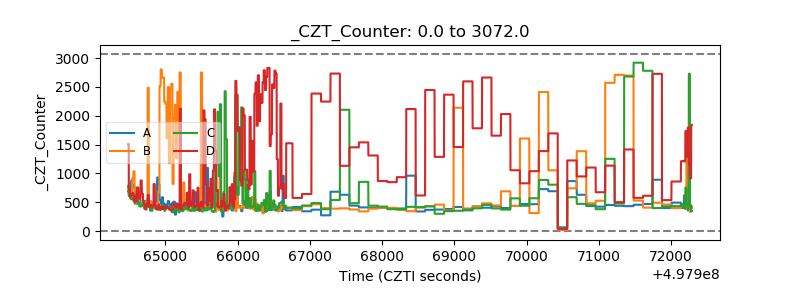 |
| +2.5 Volts monitor |  |
| +5 Volts monitor | 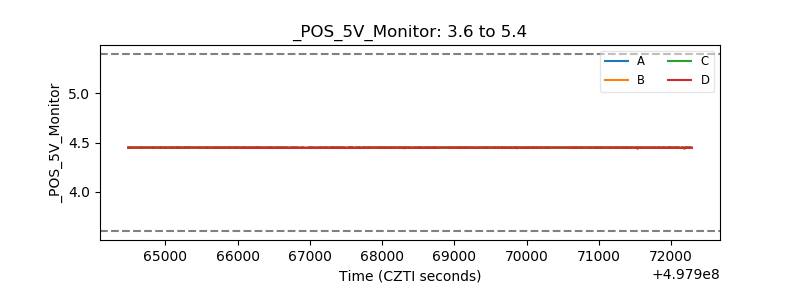 |
| _ROLL_ROT | 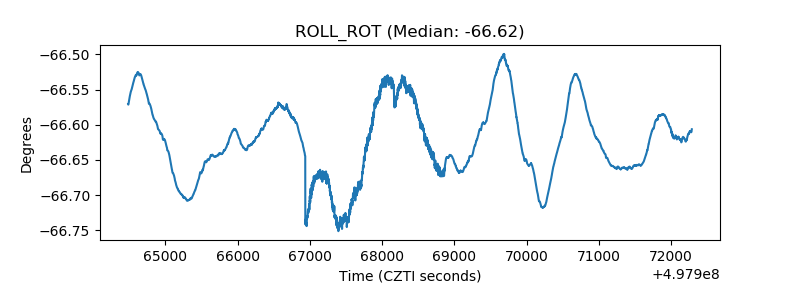 |
| _Roll_DEC | 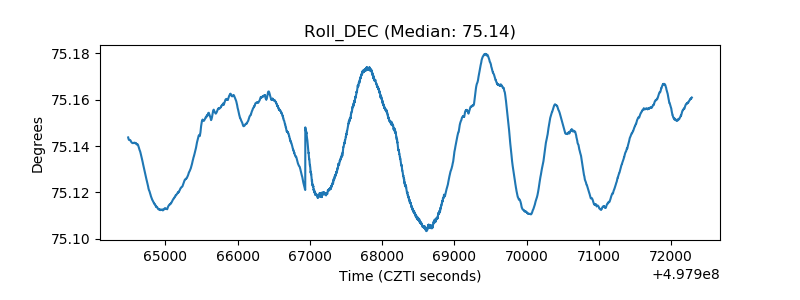 |
| _Roll_RA | 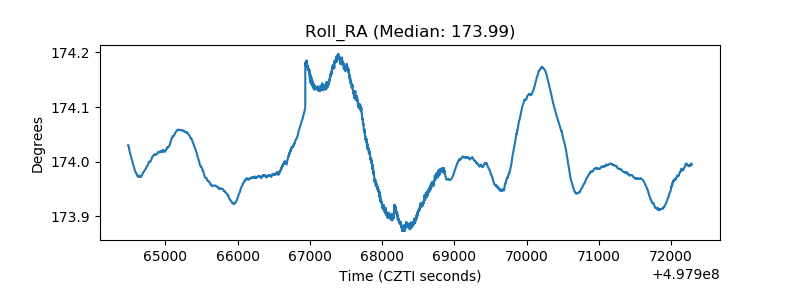 |
| Veto Counter | 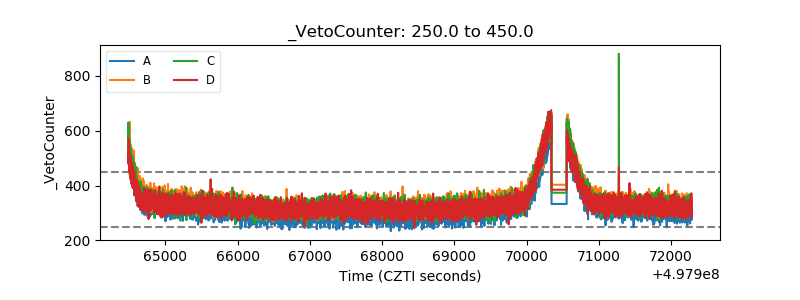 |