| Param | Original file | Final file |
|---|---|---|
| Filename | modeM0/AS1A14_126T15_9000006516_54317cztM0_level2.fits | modeM0/AS1A14_126T15_9000006516_54317cztM0_level2_quad_clean.evt |
| Size (bytes) | 780,508,800 | 93,093,120 |
| Size | 744.4 MB | 88.8 MB |
| Events in quadrant A | 3,609,587 | 703,644 |
| Events in quadrant B | 6,145,964 | 626,839 |
| Events in quadrant C | 7,425,901 | 521,047 |
| Events in quadrant D | 11,136,027 | 450,889 |
| Mode SS | |||
|---|---|---|---|
| Quadrant | BADHDUFLAG | Total packets | Discarded packets |
| A | 0 | 148 | 0 |
| B | 0 | 148 | 0 |
| C | 0 | 148 | 0 |
| D | 0 | 148 | 0 |
| Mode M0 | |||
|---|---|---|---|
| Quadrant | BADHDUFLAG | Total packets | Discarded packets |
| A | 0 | 16208 | 0 |
| B | 0 | 23814 | 0 |
| C | 0 | 27361 | 0 |
| D | 0 | 38160 | 0 |
| Quadrant | Total seconds | Saturated seconds | Saturation percentage |
|---|---|---|---|
| A | 7417 | 102 | 1.375219% |
| B | 7418 | 1282 | 17.282286% |
| C | 7418 | 1562 | 21.056889% |
| D | 7418 | 2270 | 30.601240% |
Noise dominated data is calculated using 1-second bins in cleaned event files. If a bin has >2000 counts, and if more than 50% of those come from <1% of pixels, then it is considered to be noise-dominated and hence unusable.
| Quadrant | # 1 sec bins | Bins with >0 counts | Bins with >2000 counts | High rate bins dominated by noise | Noise dominated (total time) | Noise dominated (detector-on time) | Marked lightcurve |
|---|---|---|---|---|---|---|---|
| A | 7417 | 7417 | 41 | 41 | 0.55% | 0.55% | 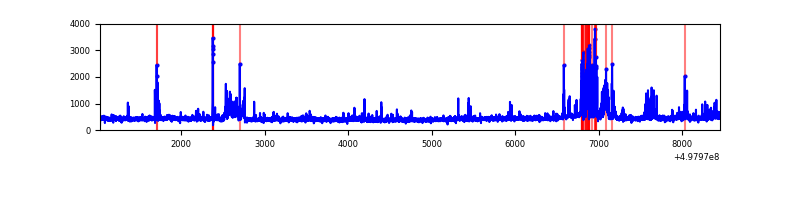 |
| B | 7418 | 7418 | 1019 | 1019 | 13.74% | 13.74% | 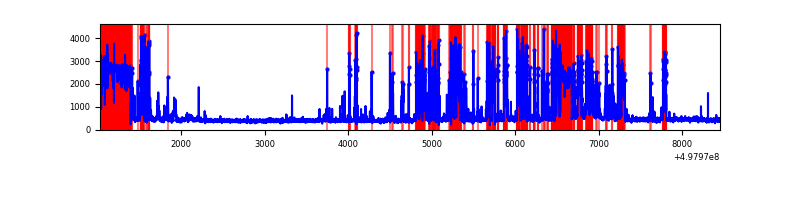 |
| C | 7418 | 7418 | 1426 | 1426 | 19.22% | 19.22% | 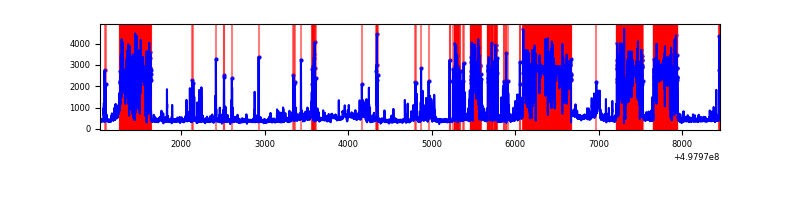 |
| D | 7418 | 7418 | 2213 | 2213 | 29.83% | 29.83% | 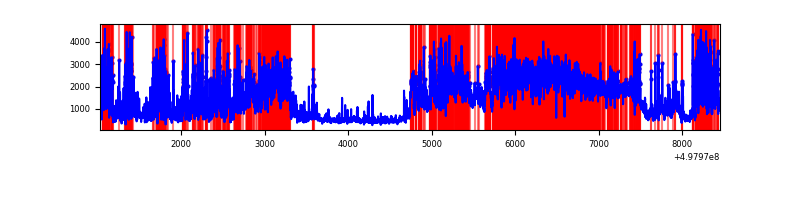 |
Top three noisy pixels from each quadrant. If the there are fewer than three noisy pixels in the level2.evt file, extra rows are filled as -1
| Pixel properties | Quadrant properties | ||||||
|---|---|---|---|---|---|---|---|
| Quadrant | DetID | PixID | Counts | Sigma | Mean | Median | Sigma |
| A | 4 | 61 | 159483 | 830.78 | 777 | 758 | 191.1 |
| A | 15 | 174 | 140462 | 731.23 | 777 | 758 | 191.1 |
| A | 0 | 8 | 83264 | 431.85 | 777 | 758 | 191.1 |
| B | 10 | 245 | 3115733 | 21536.92 | 678 | 655 | 144.6 |
| B | 0 | 213 | 150448 | 1035.63 | 678 | 655 | 144.6 |
| B | 5 | 172 | 68366 | 468.14 | 678 | 655 | 144.6 |
| C | 12 | 2 | 3700444 | 20522.58 | 652 | 644 | 180.3 |
| C | 1 | 241 | 775488 | 4298.02 | 652 | 644 | 180.3 |
| C | 14 | 254 | 141232 | 779.83 | 652 | 644 | 180.3 |
| D | 8 | 176 | 6967022 | 36786.57 | 667 | 634 | 189.4 |
| D | 15 | 108 | 750967 | 3962.19 | 667 | 634 | 189.4 |
| D | 3 | 12 | 338848 | 1785.97 | 667 | 634 | 189.4 |
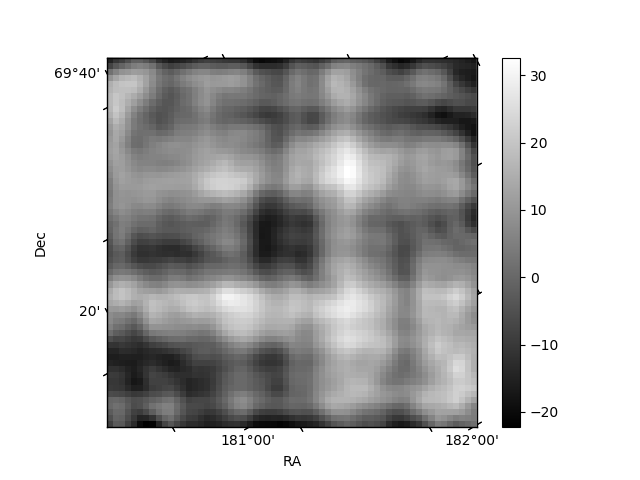
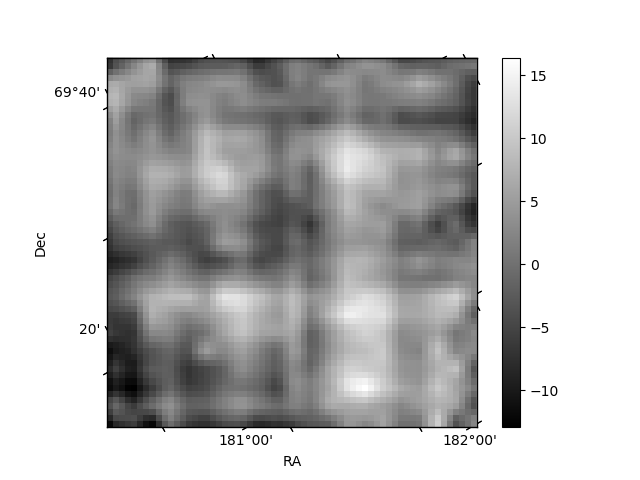
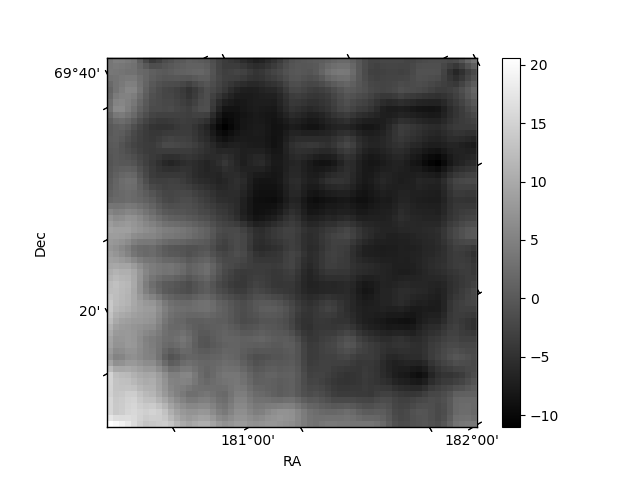
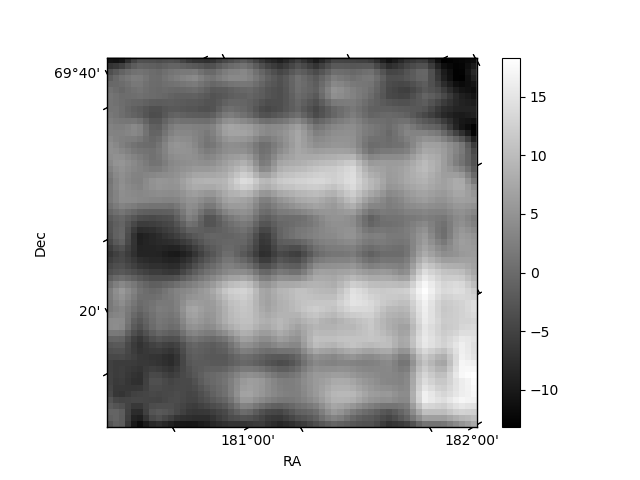
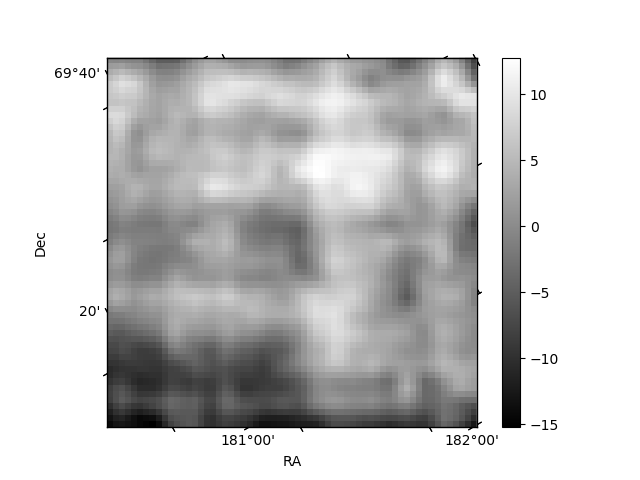
Histogram calculated using DETX and DETY for each event in the final _common_clean file
| Quadrant A | 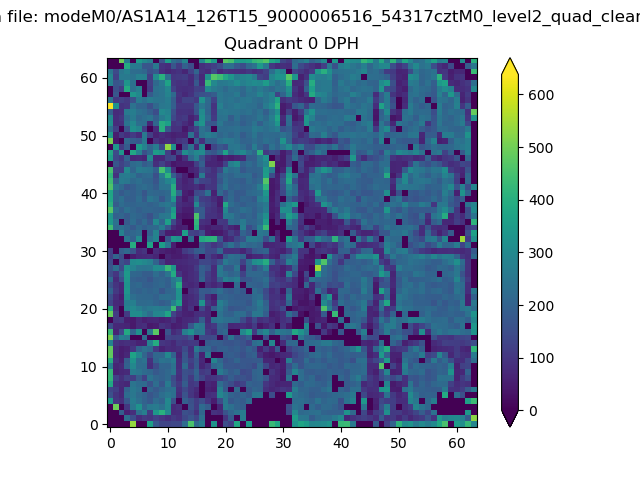 |
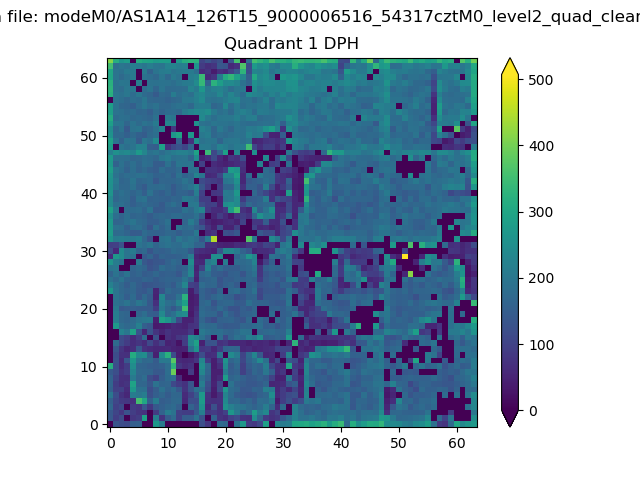 |
Quadrant B |
|---|---|---|---|
| Quadrant D | 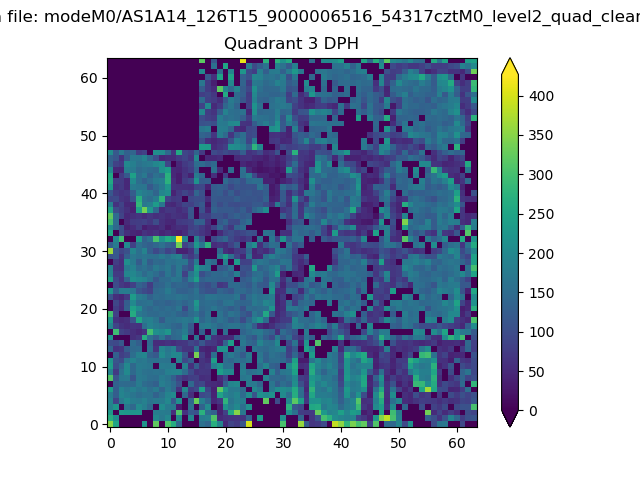 |
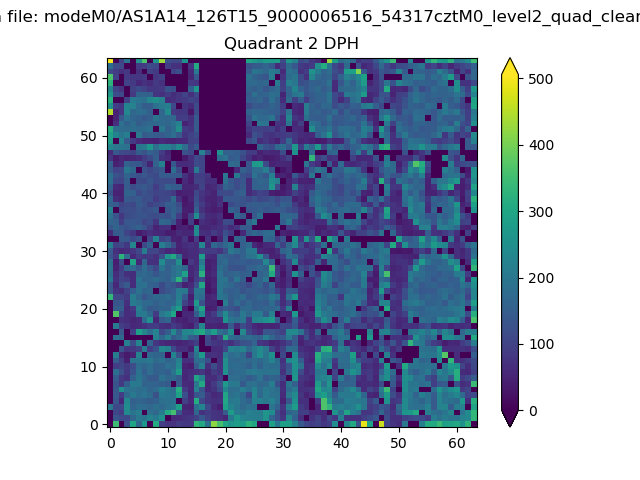 |
Quadrant C |
| Plot type | Count rate plots | Images |
|---|---|---|
| Comparison with Poisson distribution Blue bars denote a histogram of data divided into 1 sec bins. Red curve is a Poisson curve with rate = median count rate of data. |
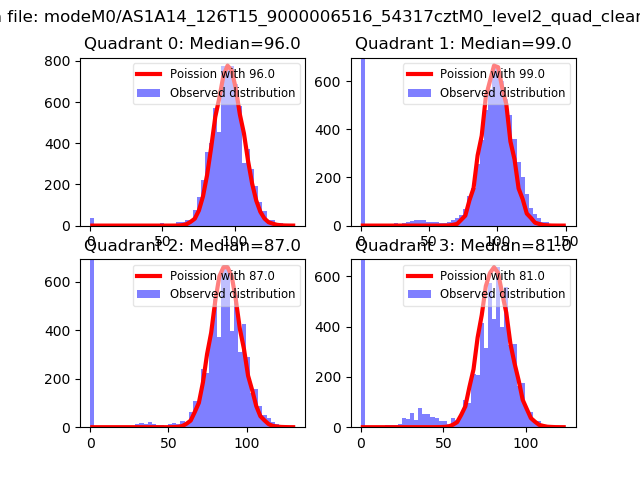 |
 |
| Quadrant-wise count rates Data is divided into 100 sec bins |
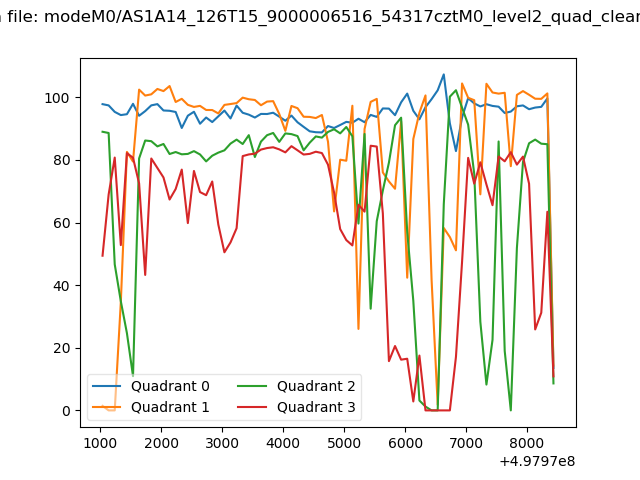 |
|
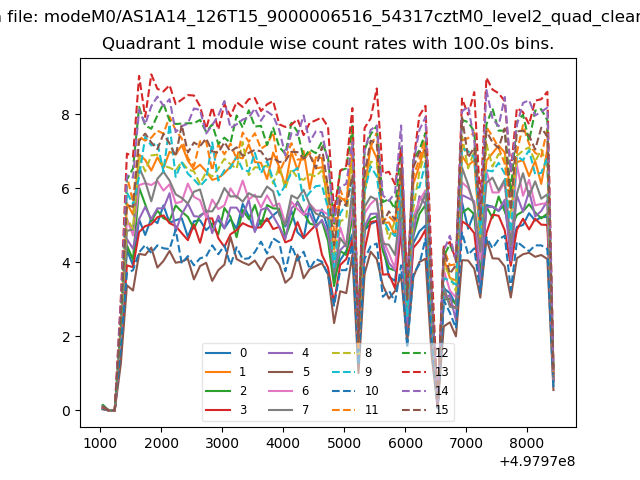
| Module-wise count rates for Quadrant A Data is divided into 100 sec bins |
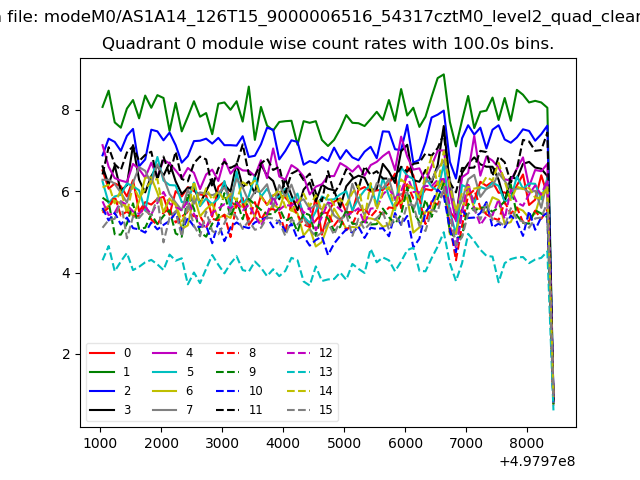 |
 |
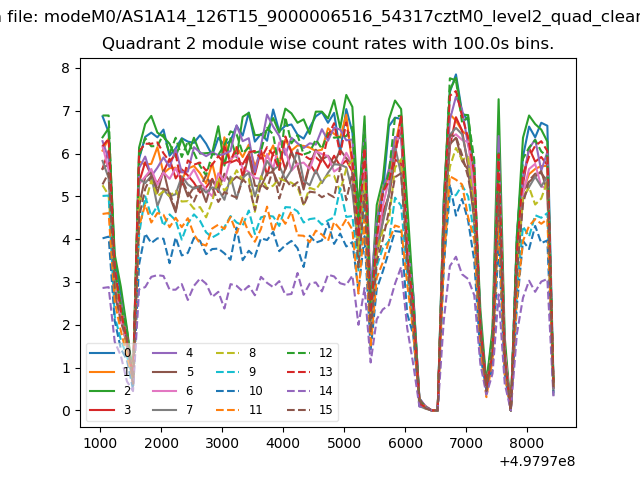
| Module-wise count rates for Quadrant B Data is divided into 100 sec bins |
 |
 |
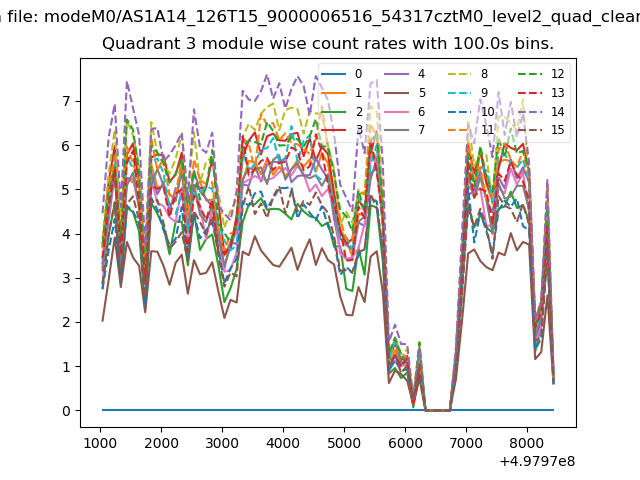
| Module-wise count rates for Quadrant C Data is divided into 100 sec bins |
 |
 |
| Module-wise count rates for Quadrant D Data is divided into 100 sec bins |
 |
 |
| Parameter | Plot |
|---|---|
| CZT HV Monitor | 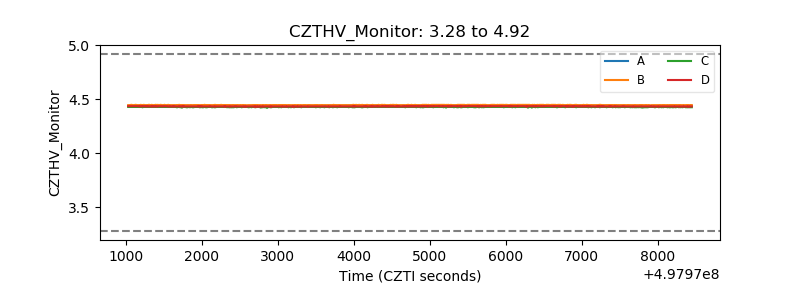 |
| D_VDD | 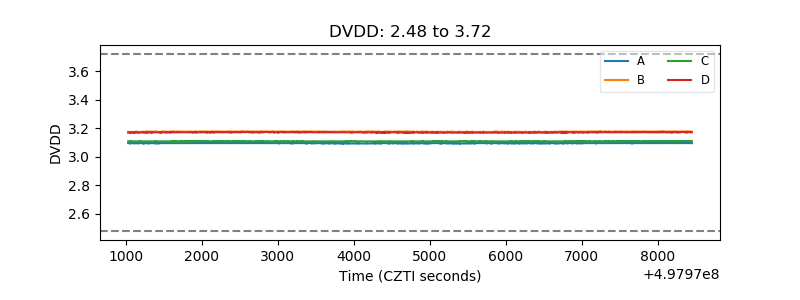 |
| Temperature 1 | 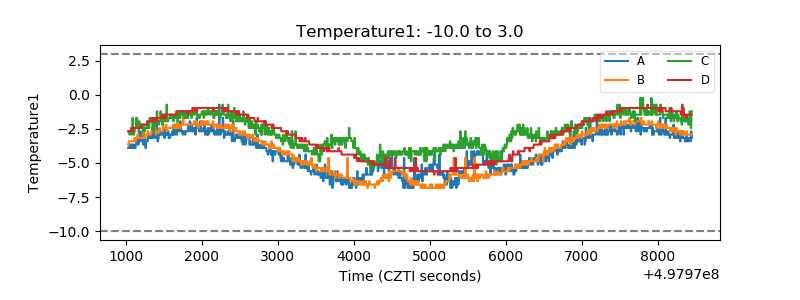 |
| Veto HV Monitor | 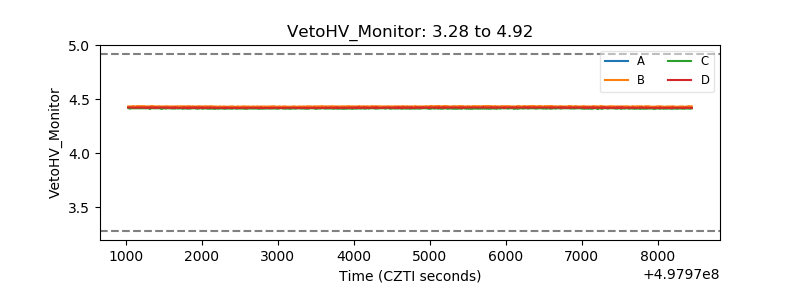 |
| Veto LLD | 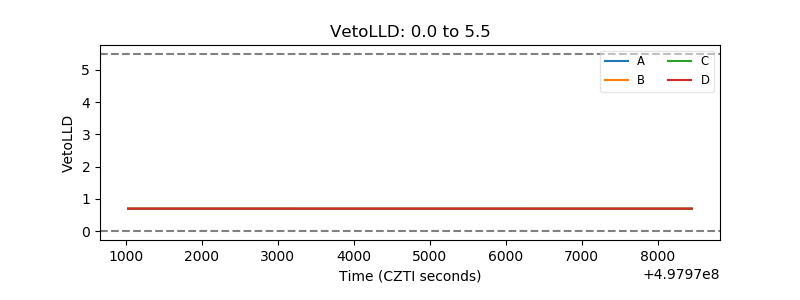 |
| Alpha Counter | 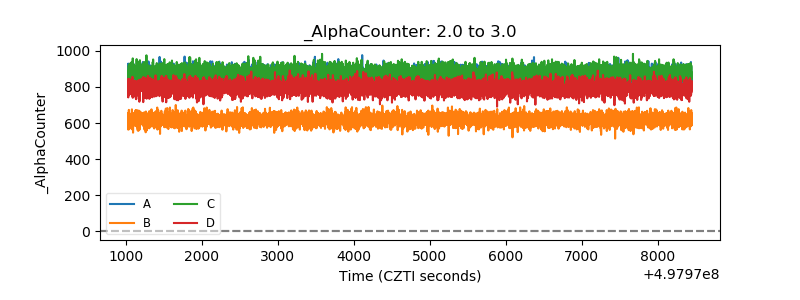 |
| _CPM_Rate | 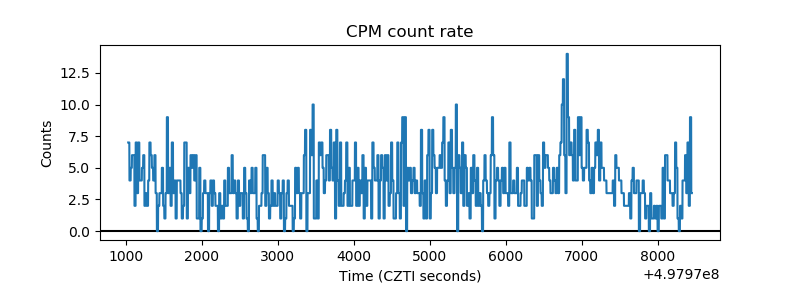 |
| CZT Counter | 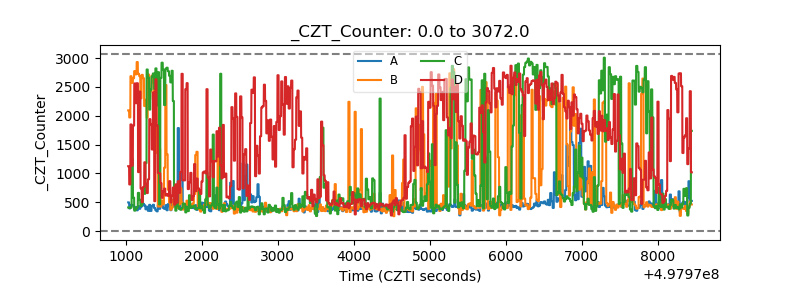 |
| +2.5 Volts monitor | 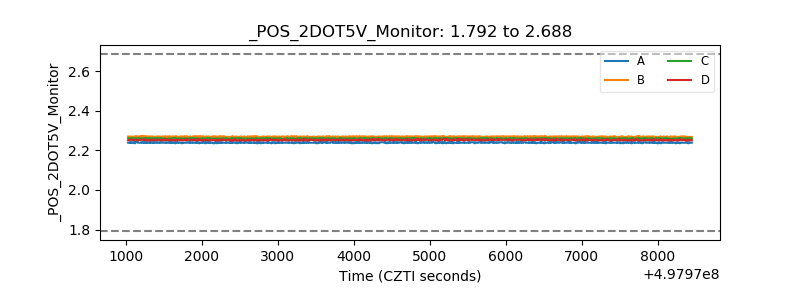 |
| +5 Volts monitor | 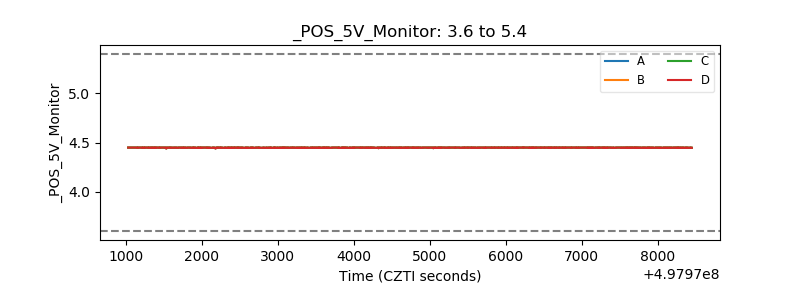 |
| _ROLL_ROT | 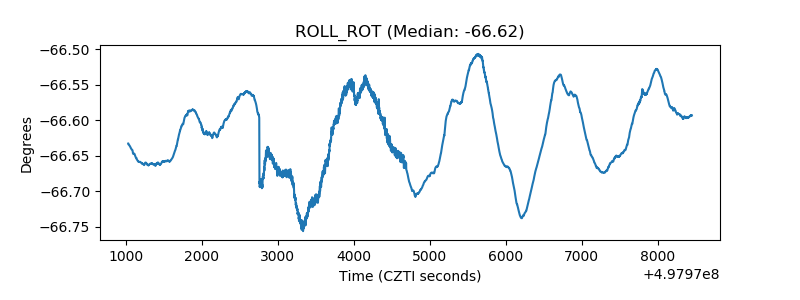 |
| _Roll_DEC | 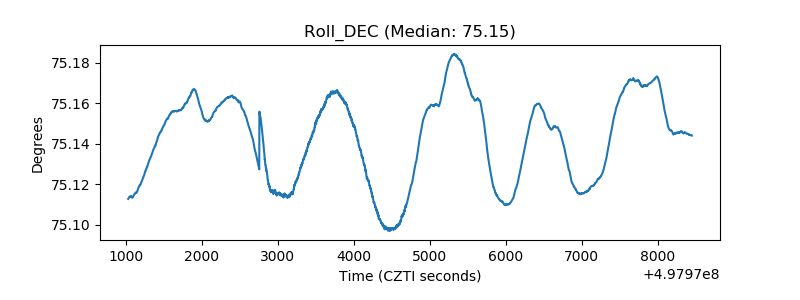 |
| _Roll_RA | 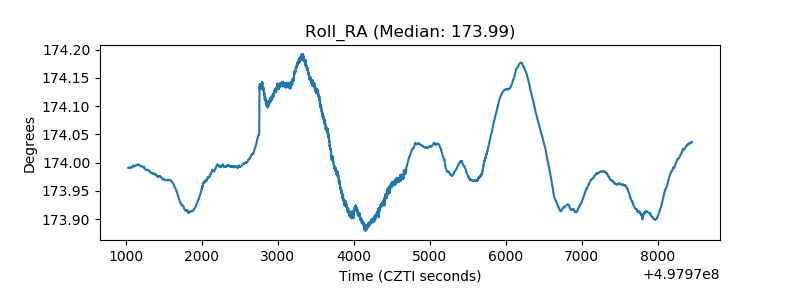 |
| Veto Counter | 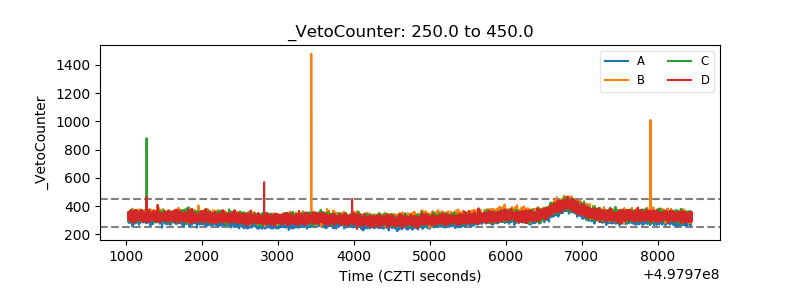 |