| Param | Original file | Final file |
|---|---|---|
| Filename | modeM0/AS1A14_126T15_9000006516_54318cztM0_level2.fits | modeM0/AS1A14_126T15_9000006516_54318cztM0_level2_quad_clean.evt |
| Size (bytes) | 1,091,473,920 | 86,299,200 |
| Size | 1.0 GB | 82.3 MB |
| Events in quadrant A | 6,703,835 | 636,577 |
| Events in quadrant B | 6,066,229 | 686,300 |
| Events in quadrant C | 12,589,508 | 396,329 |
| Events in quadrant D | 14,444,994 | 353,938 |
| Mode SS | |||
|---|---|---|---|
| Quadrant | BADHDUFLAG | Total packets | Discarded packets |
| A | 0 | 156 | 0 |
| B | 0 | 156 | 0 |
| C | 0 | 156 | 0 |
| D | 0 | 156 | 0 |
| Mode M0 | |||
|---|---|---|---|
| Quadrant | BADHDUFLAG | Total packets | Discarded packets |
| A | 0 | 25581 | 0 |
| B | 0 | 23641 | 0 |
| C | 0 | 42657 | 0 |
| D | 0 | 48279 | 0 |
| Quadrant | Total seconds | Saturated seconds | Saturation percentage |
|---|---|---|---|
| A | 7752 | 1150 | 14.834881% |
| B | 7752 | 980 | 12.641899% |
| C | 7751 | 3469 | 44.755515% |
| D | 7752 | 3781 | 48.774510% |
Noise dominated data is calculated using 1-second bins in cleaned event files. If a bin has >2000 counts, and if more than 50% of those come from <1% of pixels, then it is considered to be noise-dominated and hence unusable.
| Quadrant | # 1 sec bins | Bins with >0 counts | Bins with >2000 counts | High rate bins dominated by noise | Noise dominated (total time) | Noise dominated (detector-on time) | Marked lightcurve |
|---|---|---|---|---|---|---|---|
| A | 7752 | 7752 | 822 | 822 | 10.60% | 10.60% | 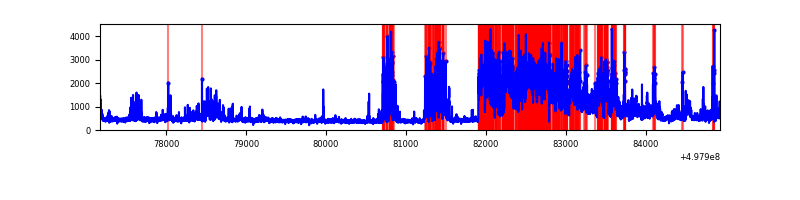 |
| B | 7752 | 7752 | 810 | 810 | 10.45% | 10.45% | 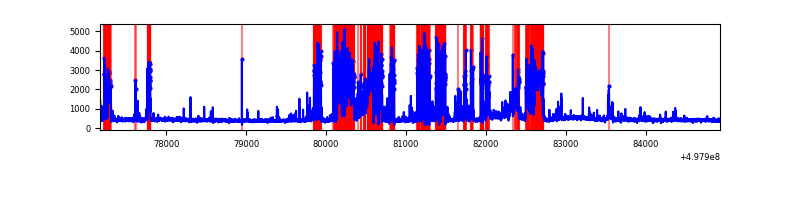 |
| C | 7750 | 7750 | 3221 | 3221 | 41.56% | 41.56% | 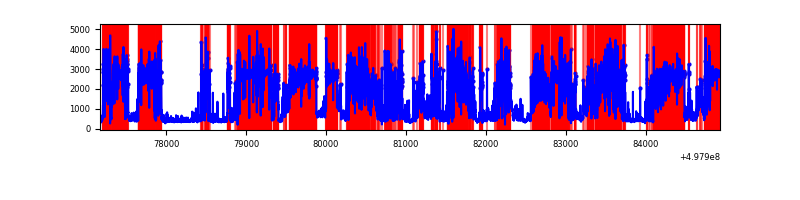 |
| D | 7751 | 7751 | 3489 | 3489 | 45.01% | 45.01% | 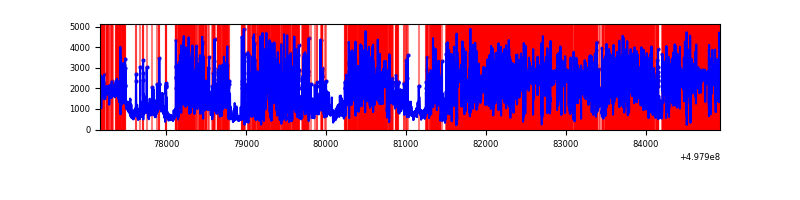 |
Top three noisy pixels from each quadrant. If the there are fewer than three noisy pixels in the level2.evt file, extra rows are filled as -1
| Pixel properties | Quadrant properties | ||||||
|---|---|---|---|---|---|---|---|
| Quadrant | DetID | PixID | Counts | Sigma | Mean | Median | Sigma |
| A | 7 | 29 | 2890653 | 15258.82 | 765 | 746 | 189.4 |
| A | 0 | 8 | 330807 | 1742.74 | 765 | 746 | 189.4 |
| A | 15 | 174 | 191901 | 1009.31 | 765 | 746 | 189.4 |
| B | 10 | 245 | 2766453 | 17142.26 | 749 | 721 | 161.3 |
| B | 0 | 213 | 151541 | 934.8 | 749 | 721 | 161.3 |
| B | 10 | 247 | 45563 | 277.93 | 749 | 721 | 161.3 |
| C | 12 | 2 | 6705694 | 41211.59 | 594 | 588 | 162.7 |
| C | 1 | 241 | 3190028 | 19603.26 | 594 | 588 | 162.7 |
| C | 14 | 254 | 166764 | 1021.37 | 594 | 588 | 162.7 |
| D | 8 | 176 | 6087266 | 37263.41 | 576 | 549 | 163.3 |
| D | 3 | 12 | 2778262 | 17005.4 | 576 | 549 | 163.3 |
| D | 15 | 108 | 2759699 | 16891.75 | 576 | 549 | 163.3 |
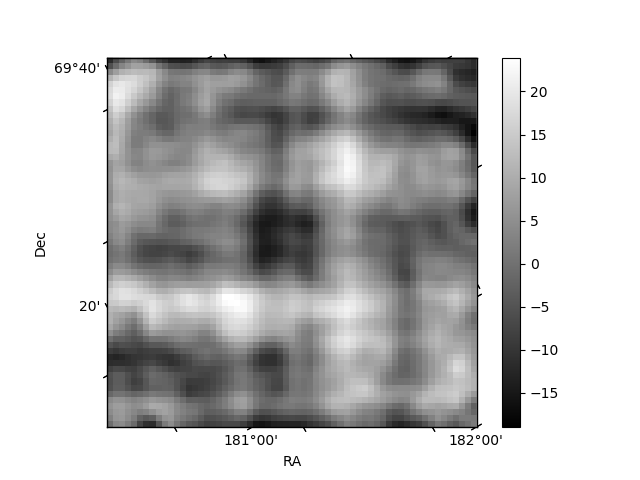
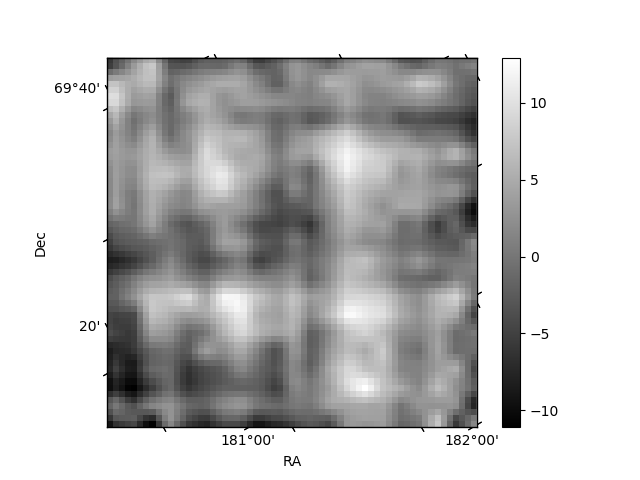
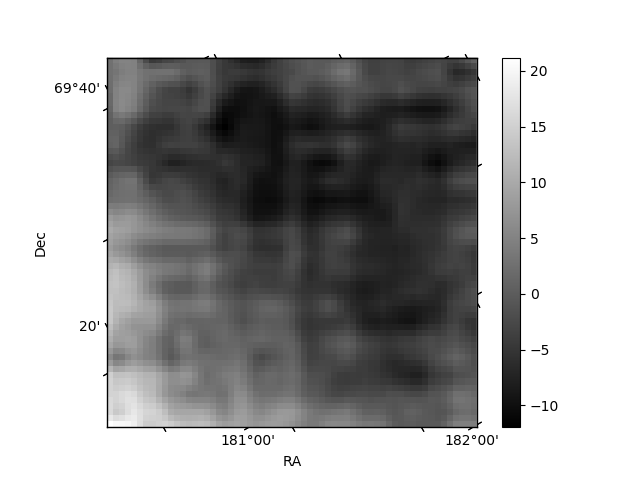
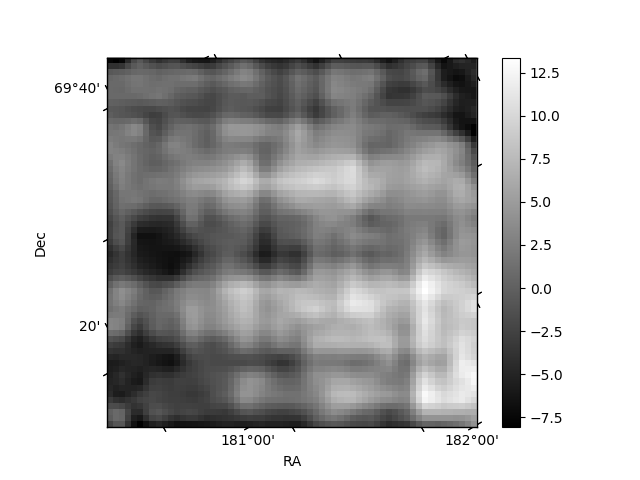
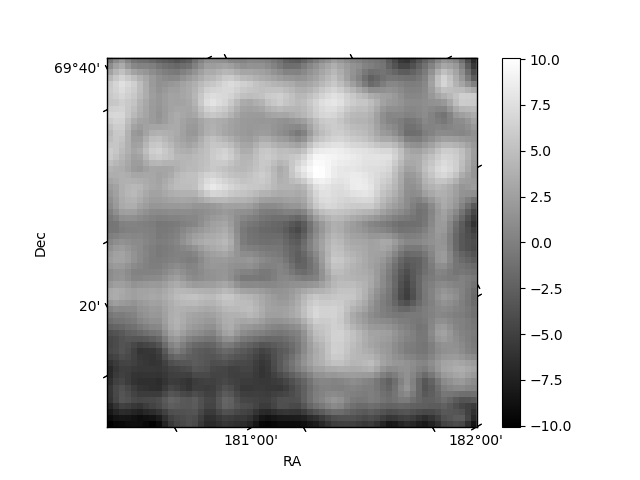
Histogram calculated using DETX and DETY for each event in the final _common_clean file
| Quadrant A | 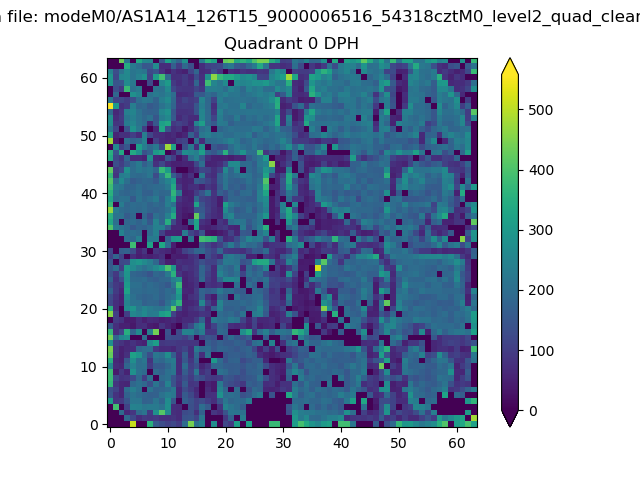 |
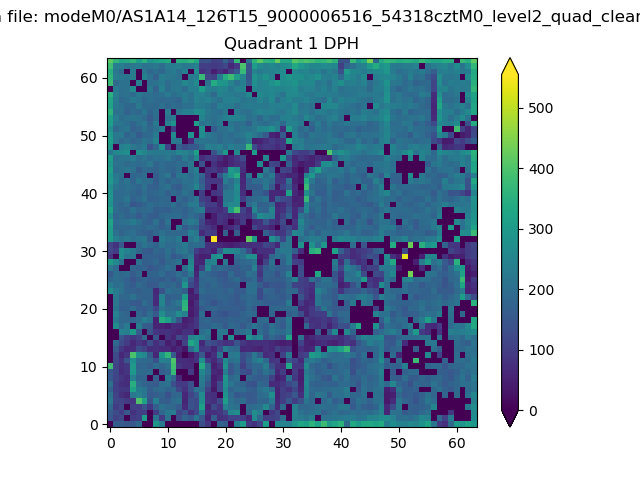 |
Quadrant B |
|---|---|---|---|
| Quadrant D | 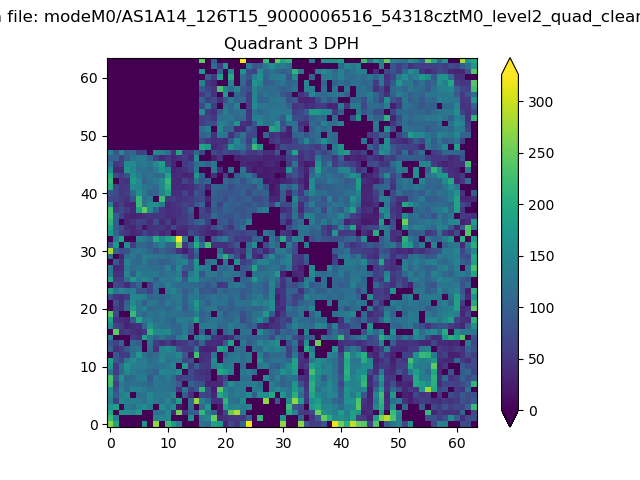 |
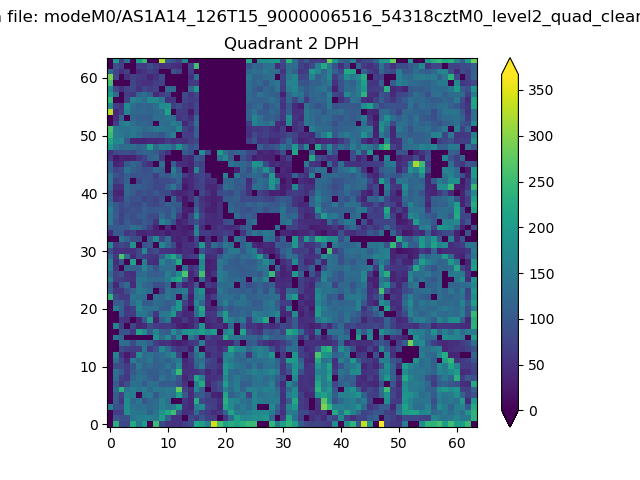 |
Quadrant C |
| Plot type | Count rate plots | Images |
|---|---|---|
| Comparison with Poisson distribution Blue bars denote a histogram of data divided into 1 sec bins. Red curve is a Poisson curve with rate = median count rate of data. |
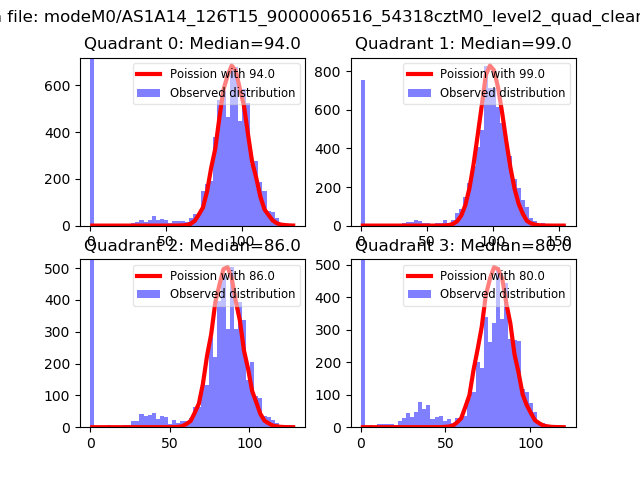 |
 |
| Quadrant-wise count rates Data is divided into 100 sec bins |
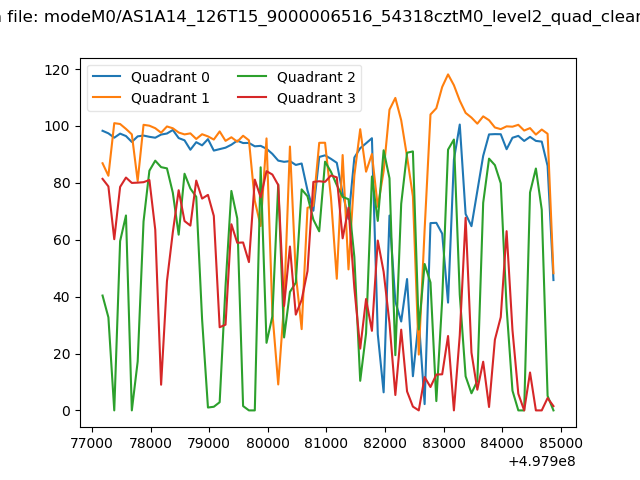 |
|
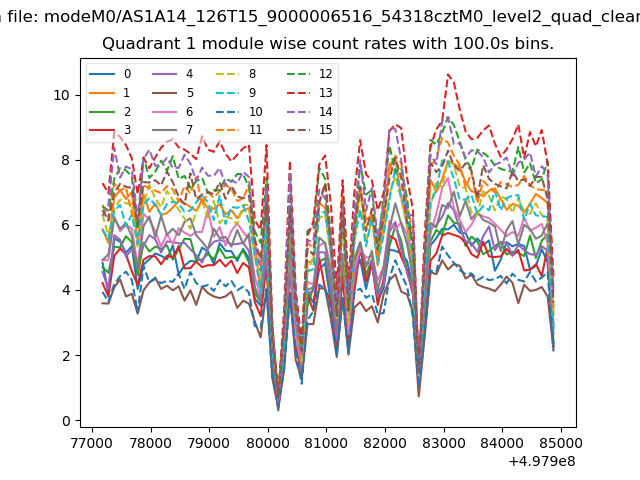
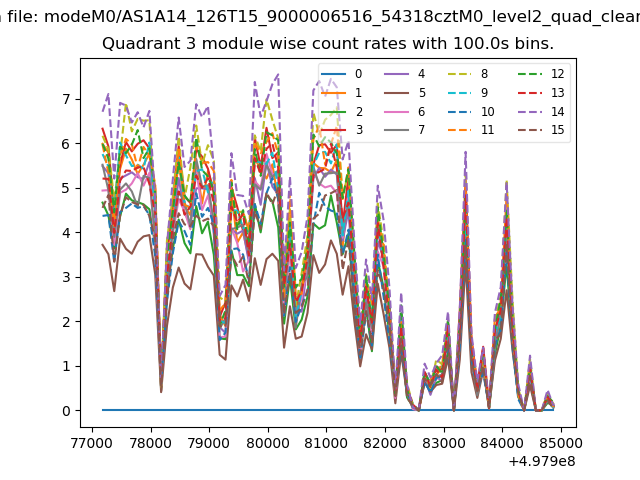
| Module-wise count rates for Quadrant A Data is divided into 100 sec bins |
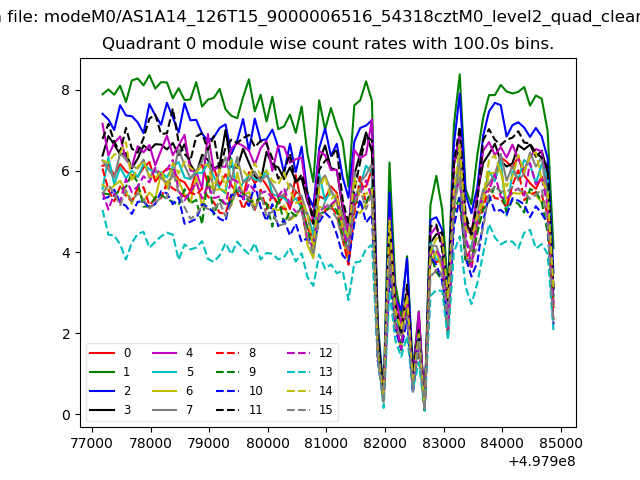 |
 |
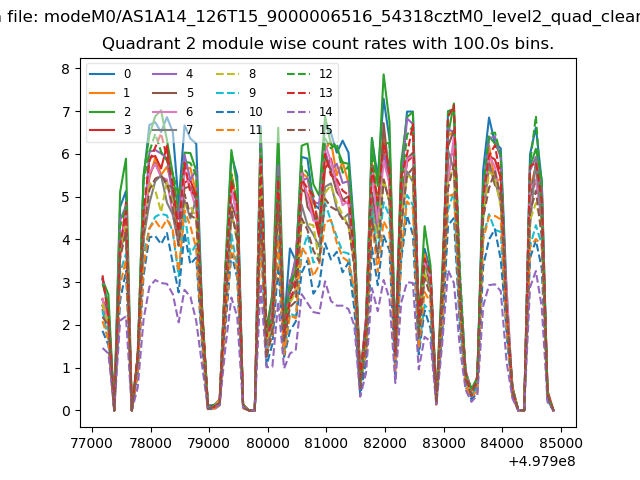
| Module-wise count rates for Quadrant B Data is divided into 100 sec bins |
 |
 |
| Module-wise count rates for Quadrant C Data is divided into 100 sec bins |
 |
 |
| Module-wise count rates for Quadrant D Data is divided into 100 sec bins |
 |
 |
| Parameter | Plot |
|---|---|
| CZT HV Monitor | 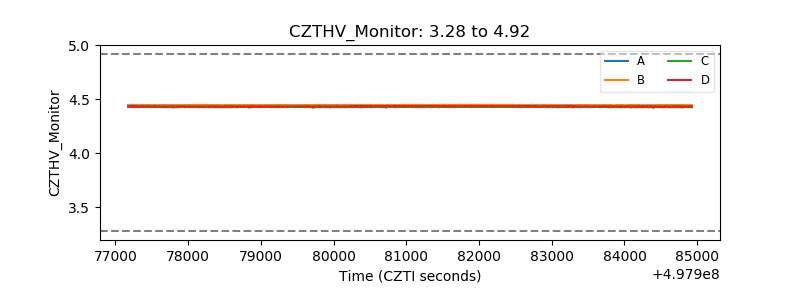 |
| D_VDD | 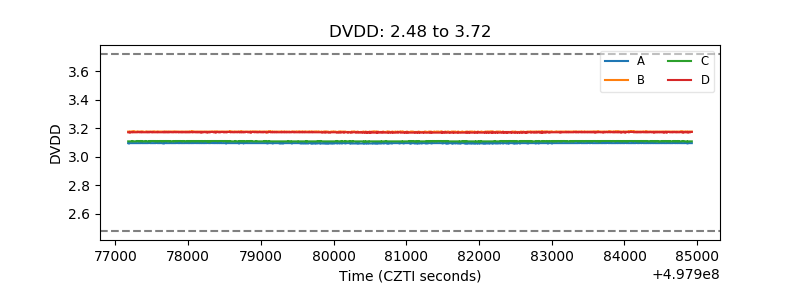 |
| Temperature 1 | 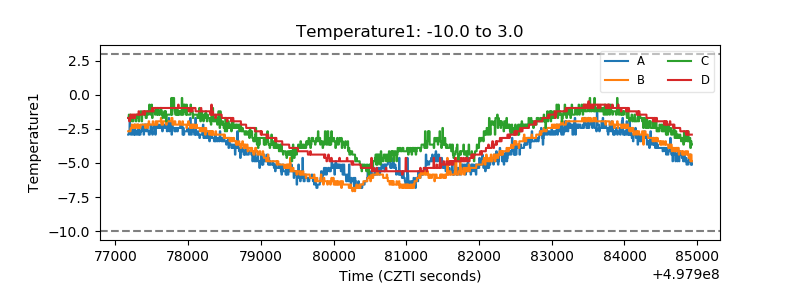 |
| Veto HV Monitor | 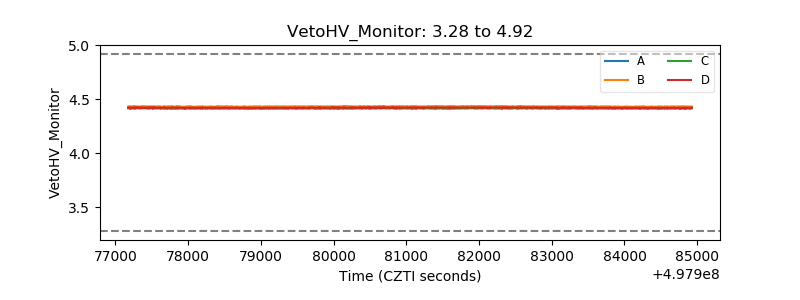 |
| Veto LLD | 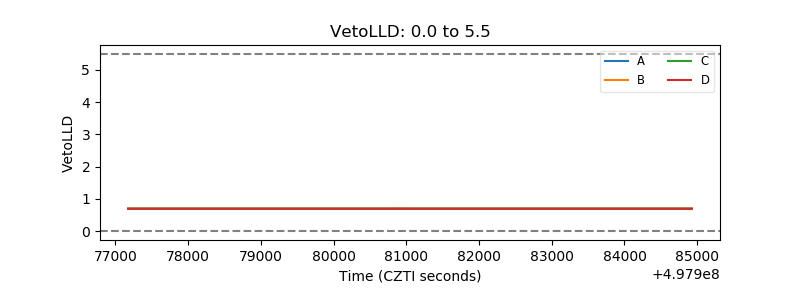 |
| Alpha Counter | 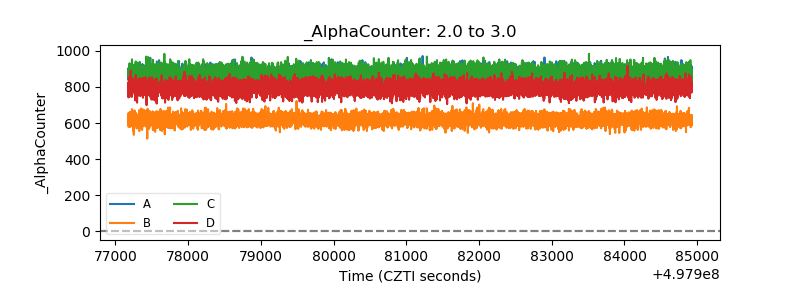 |
| _CPM_Rate | 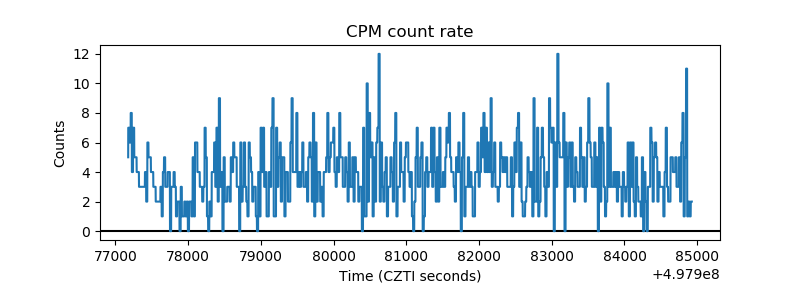 |
| CZT Counter | 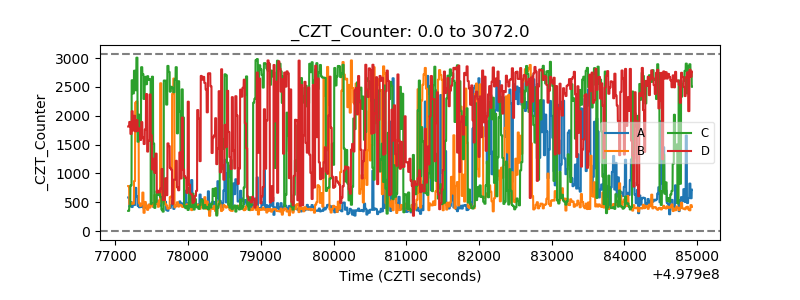 |
| +2.5 Volts monitor |  |
| +5 Volts monitor | 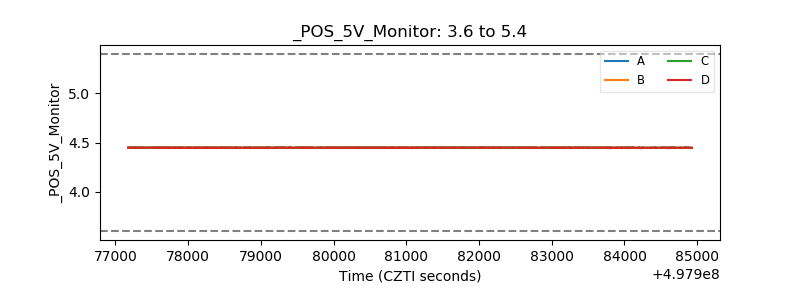 |
| _ROLL_ROT | 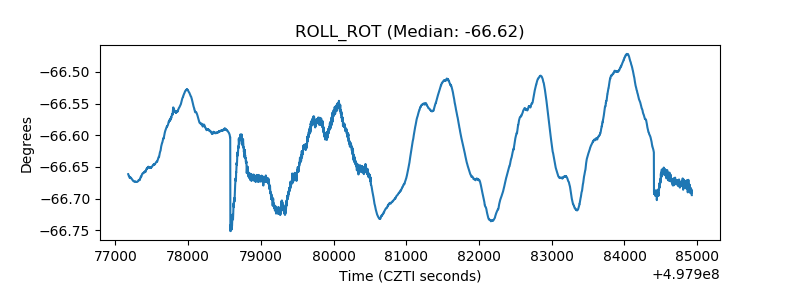 |
| _Roll_DEC | 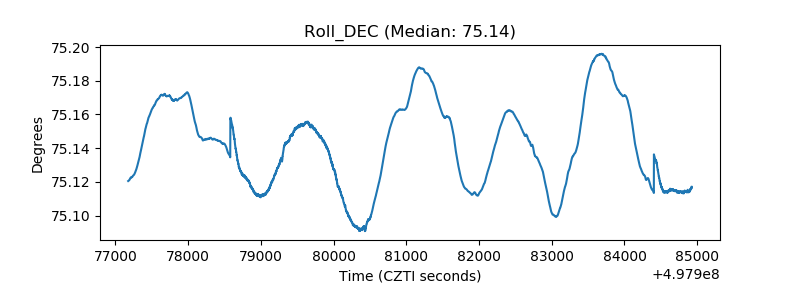 |
| _Roll_RA | 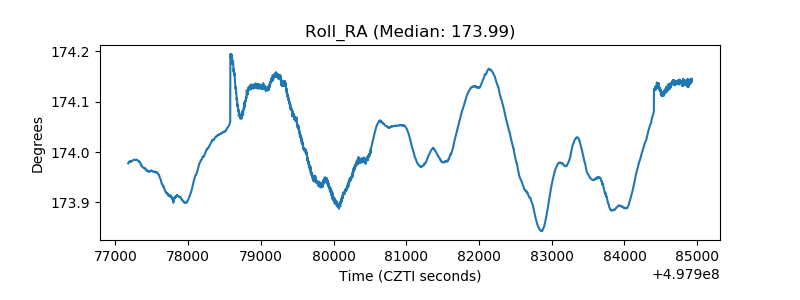 |
| Veto Counter | 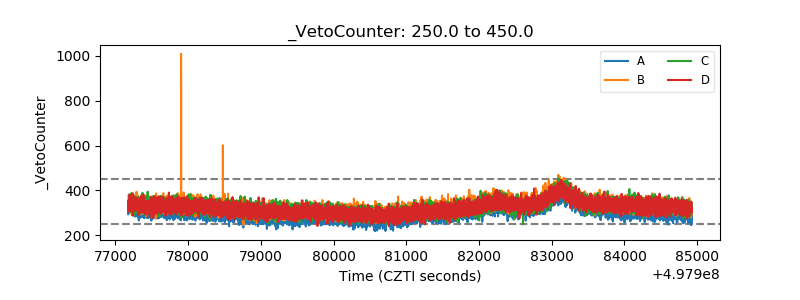 |