| Param | Original file | Final file |
|---|---|---|
| Filename | modeM0/AS1A14_126T15_9000006516_54321cztM0_level2.fits | modeM0/AS1A14_126T15_9000006516_54321cztM0_level2_quad_clean.evt |
| Size (bytes) | 1,665,740,160 | 145,874,880 |
| Size | 1.6 GB | 139.1 MB |
| Events in quadrant A | 8,869,344 | 1,125,835 |
| Events in quadrant B | 8,177,644 | 1,210,345 |
| Events in quadrant C | 19,760,151 | 677,459 |
| Events in quadrant D | 23,868,428 | 520,212 |
| Mode SS | |||
|---|---|---|---|
| Quadrant | BADHDUFLAG | Total packets | Discarded packets |
| A | 0 | 256 | 0 |
| B | 0 | 256 | 0 |
| C | 0 | 256 | 0 |
| D | 0 | 256 | 0 |
| Mode M0 | |||
|---|---|---|---|
| Quadrant | BADHDUFLAG | Total packets | Discarded packets |
| A | 0 | 35331 | 1 |
| B | 0 | 33581 | 1 |
| C | 0 | 67398 | 5 |
| D | 0 | 79505 | 1 |
| Mode M9 | |||
|---|---|---|---|
| Quadrant | BADHDUFLAG | Total packets | Discarded packets |
| A | 0 | 3 | 0 |
| B | 0 | 3 | 0 |
| C | 0 | 3 | 0 |
| D | 0 | 3 | 0 |
| Quadrant | Total seconds | Saturated seconds | Saturation percentage |
|---|---|---|---|
| A | 12768 | 952 | 7.456140% |
| B | 12768 | 886 | 6.939223% |
| C | 12767 | 5335 | 41.787421% |
| D | 12767 | 6945 | 54.398057% |
Noise dominated data is calculated using 1-second bins in cleaned event files. If a bin has >2000 counts, and if more than 50% of those come from <1% of pixels, then it is considered to be noise-dominated and hence unusable.
| Quadrant | # 1 sec bins | Bins with >0 counts | Bins with >2000 counts | High rate bins dominated by noise | Noise dominated (total time) | Noise dominated (detector-on time) | Marked lightcurve |
|---|---|---|---|---|---|---|---|
| A | 13078 | 12769 | 698 | 698 | 5.34% | 5.47% | 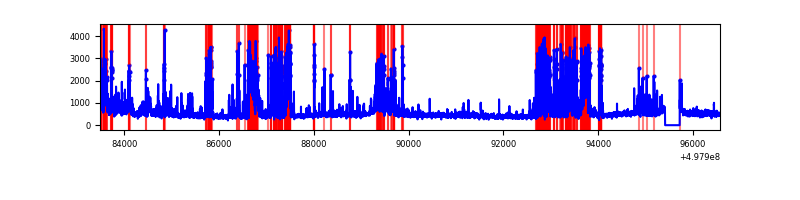 |
| B | 13078 | 12769 | 676 | 676 | 5.17% | 5.29% | 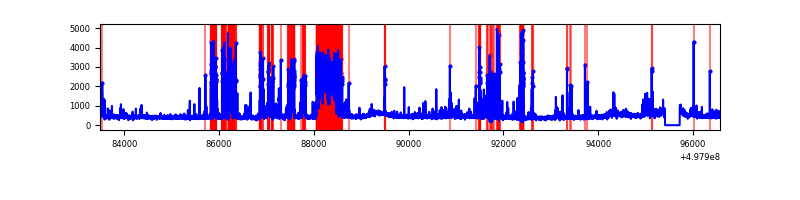 |
| C | 13076 | 12767 | 4997 | 4997 | 38.22% | 39.14% | 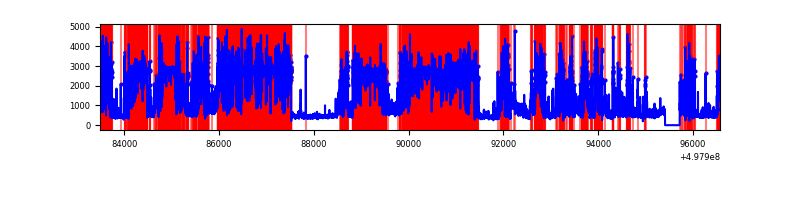 |
| D | 13077 | 12768 | 6383 | 6383 | 48.81% | 49.99% | 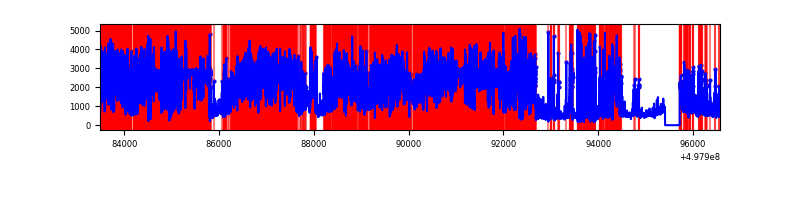 |
Top three noisy pixels from each quadrant. If the there are fewer than three noisy pixels in the level2.evt file, extra rows are filled as -1
| Pixel properties | Quadrant properties | ||||||
|---|---|---|---|---|---|---|---|
| Quadrant | DetID | PixID | Counts | Sigma | Mean | Median | Sigma |
| A | 7 | 29 | 2008190 | 6113.7 | 1320 | 1290 | 328.3 |
| A | 4 | 61 | 636401 | 1934.76 | 1320 | 1290 | 328.3 |
| A | 15 | 174 | 209258 | 633.54 | 1320 | 1290 | 328.3 |
| B | 10 | 245 | 2078270 | 7481.51 | 1296 | 1248 | 277.6 |
| B | 5 | 172 | 319158 | 1145.12 | 1296 | 1248 | 277.6 |
| B | 7 | 0 | 186444 | 667.08 | 1296 | 1248 | 277.6 |
| C | 1 | 241 | 7922372 | 29818.41 | 982 | 974 | 265.7 |
| C | 12 | 2 | 6230458 | 23449.56 | 982 | 974 | 265.7 |
| C | 12 | 249 | 604367 | 2271.34 | 982 | 974 | 265.7 |
| D | 8 | 176 | 9519825 | 36734.89 | 916 | 874 | 259.1 |
| D | 15 | 108 | 4657812 | 17971.74 | 916 | 874 | 259.1 |
| D | 3 | 12 | 4149012 | 16008.21 | 916 | 874 | 259.1 |
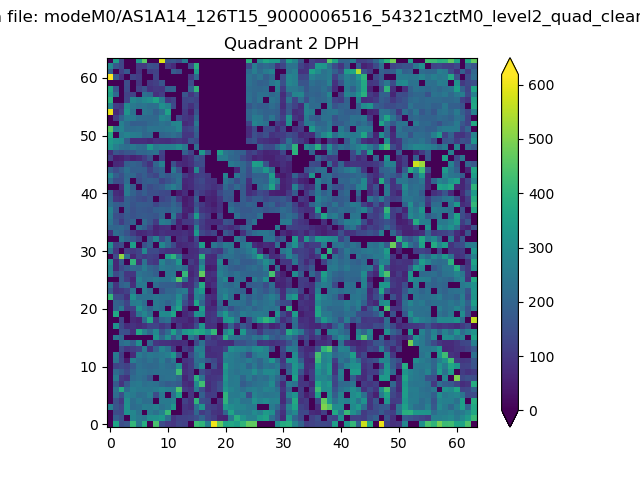
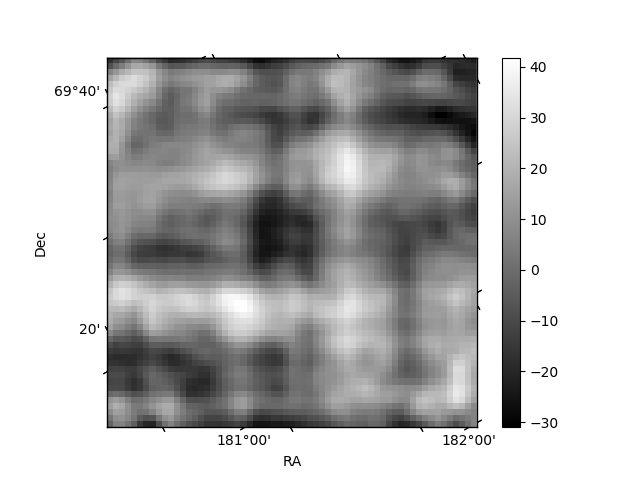
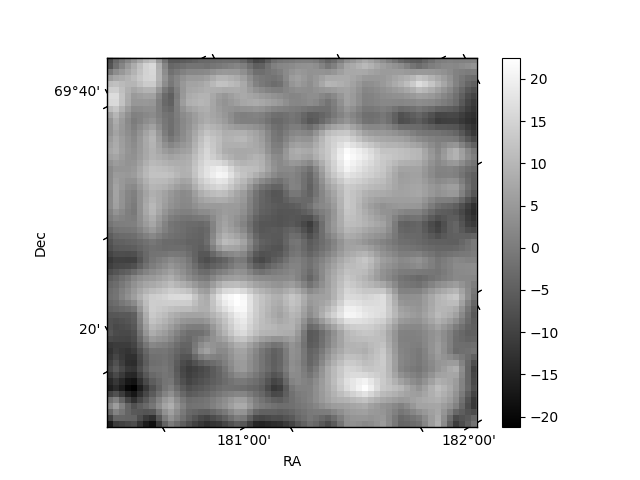
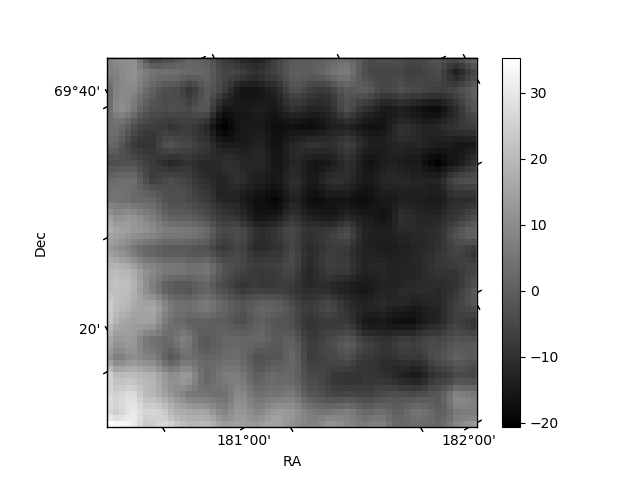
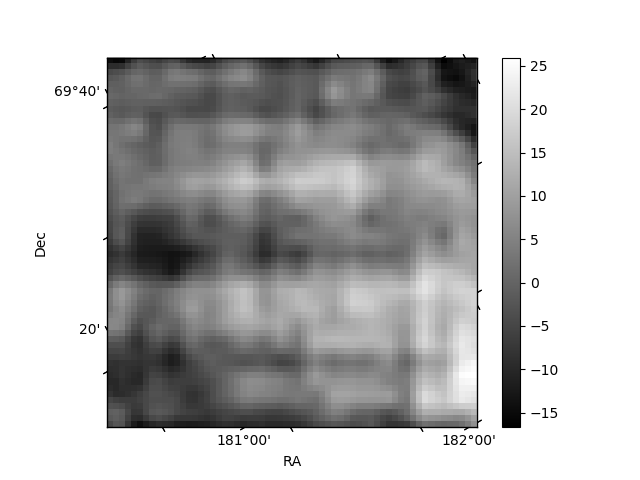
Histogram calculated using DETX and DETY for each event in the final _common_clean file
| Quadrant A | 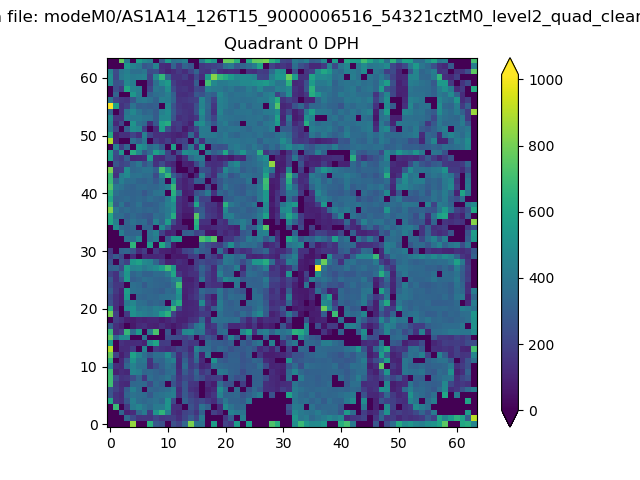 |
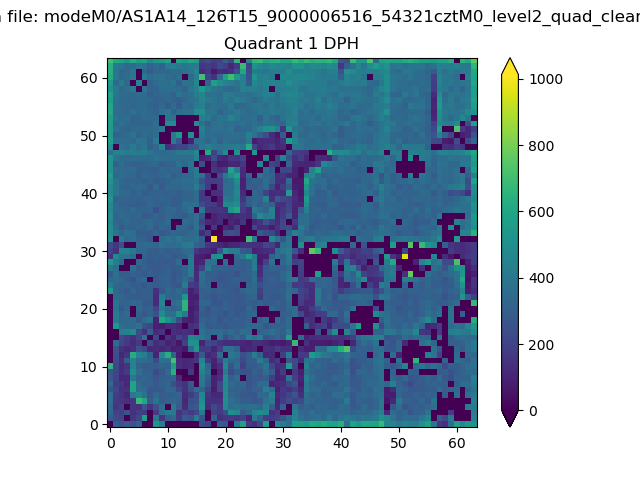 |
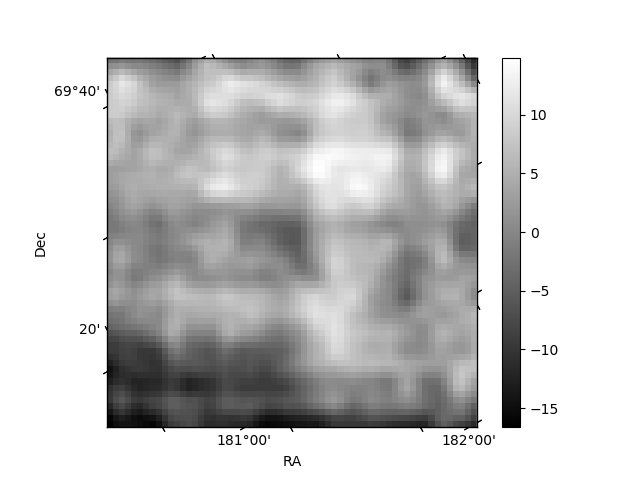
Quadrant B |
|---|---|---|---|
| Quadrant D | 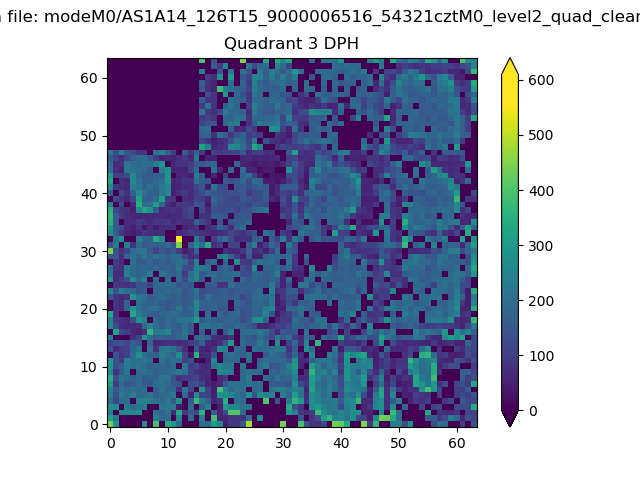 |
 |
Quadrant C |
| Plot type | Count rate plots | Images |
|---|---|---|
| Comparison with Poisson distribution Blue bars denote a histogram of data divided into 1 sec bins. Red curve is a Poisson curve with rate = median count rate of data. |
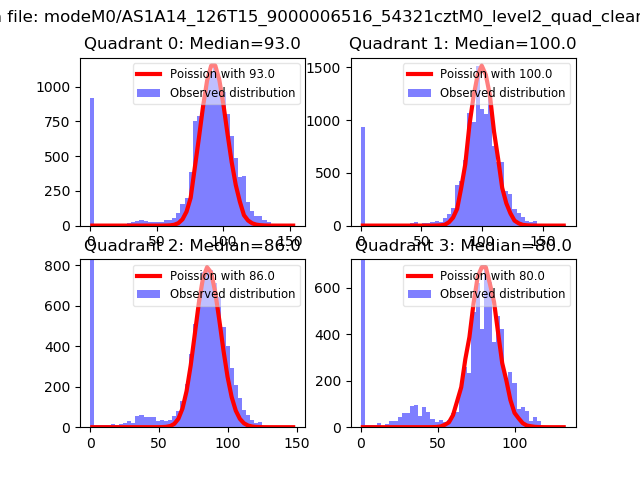 |
 |
| Quadrant-wise count rates Data is divided into 100 sec bins |
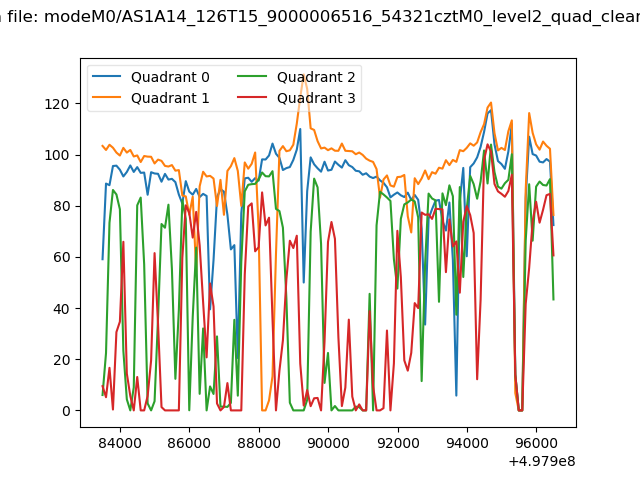 |
|
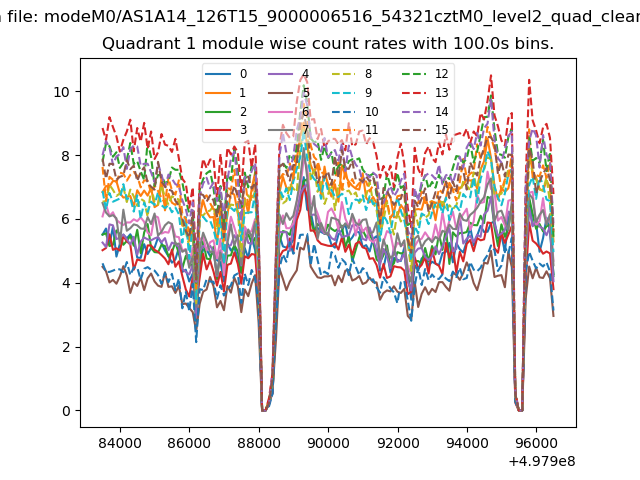
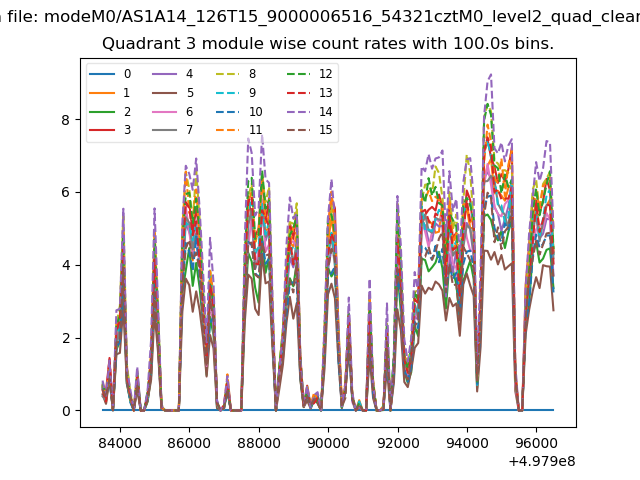
| Module-wise count rates for Quadrant A Data is divided into 100 sec bins |
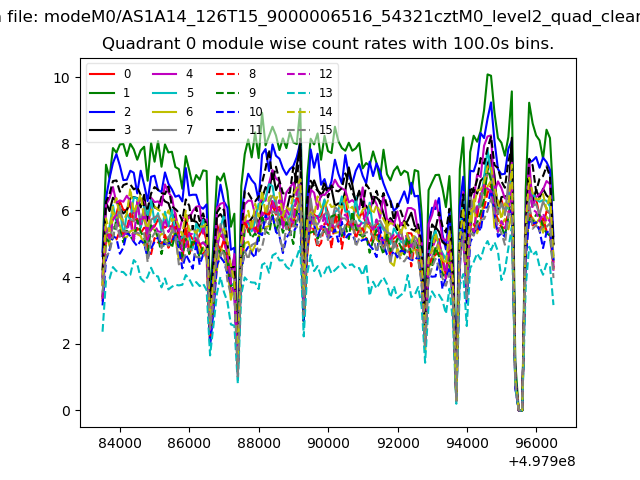 |
 |
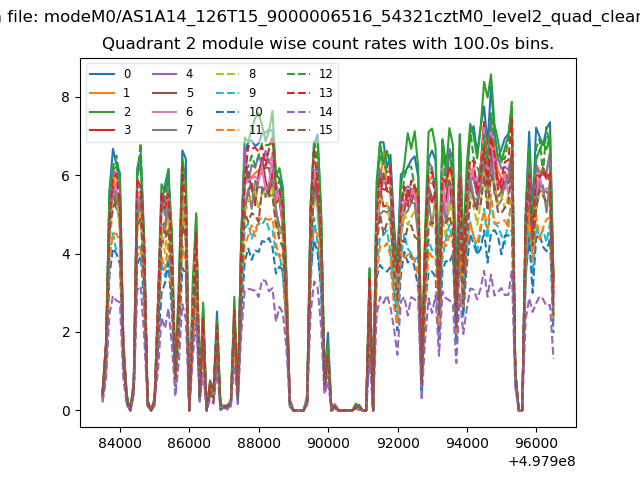
| Module-wise count rates for Quadrant B Data is divided into 100 sec bins |
 |
 |
| Module-wise count rates for Quadrant C Data is divided into 100 sec bins |
 |
 |
| Module-wise count rates for Quadrant D Data is divided into 100 sec bins |
 |
 |
| Parameter | Plot |
|---|---|
| CZT HV Monitor | 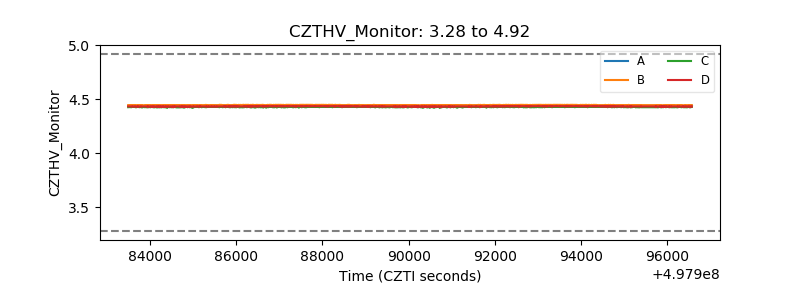 |
| D_VDD | 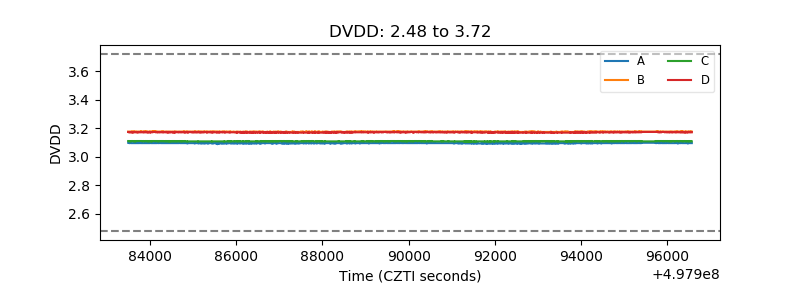 |
| Temperature 1 | 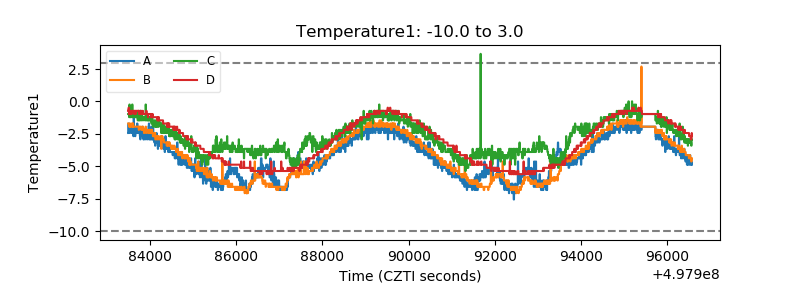 |
| Veto HV Monitor | 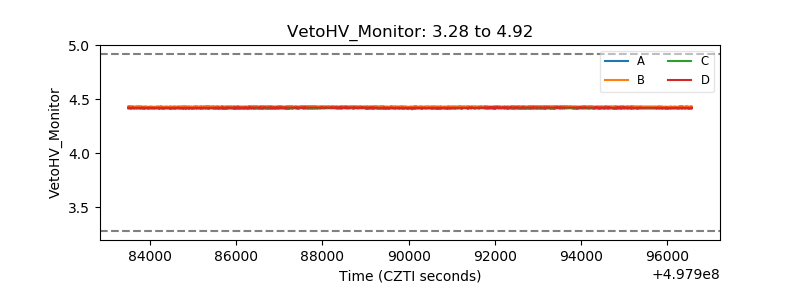 |
| Veto LLD | 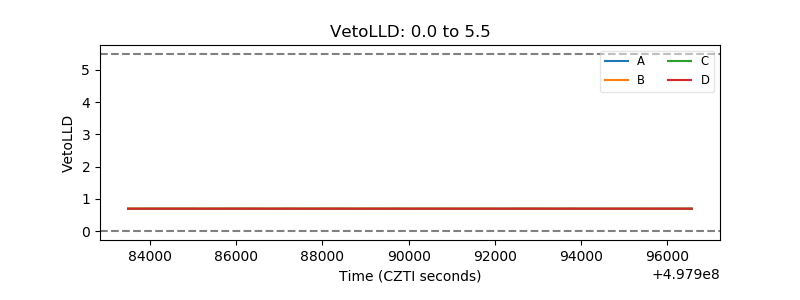 |
| Alpha Counter | 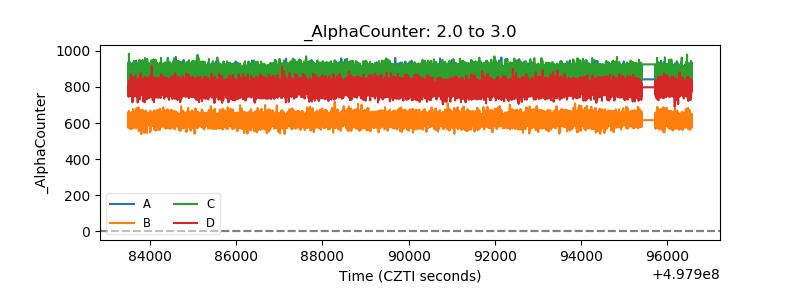 |
| _CPM_Rate | 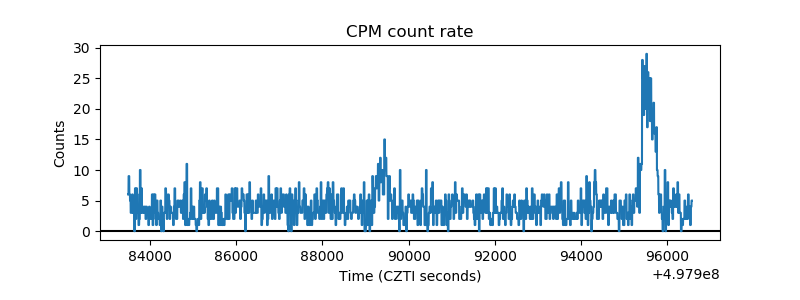 |
| CZT Counter | 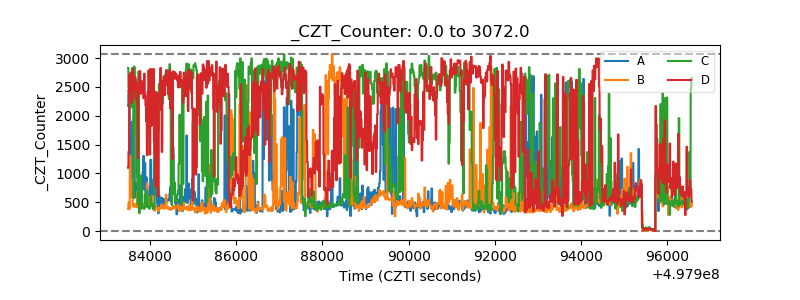 |
| +2.5 Volts monitor | 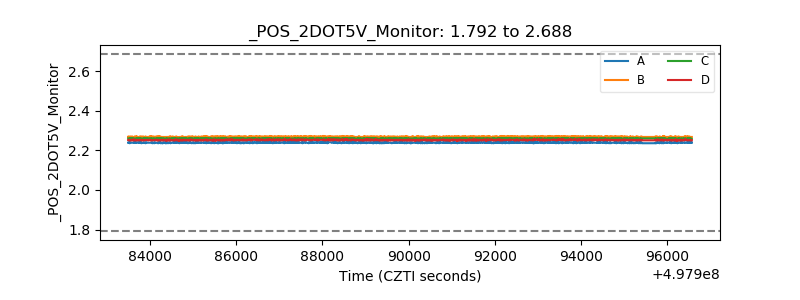 |
| +5 Volts monitor | 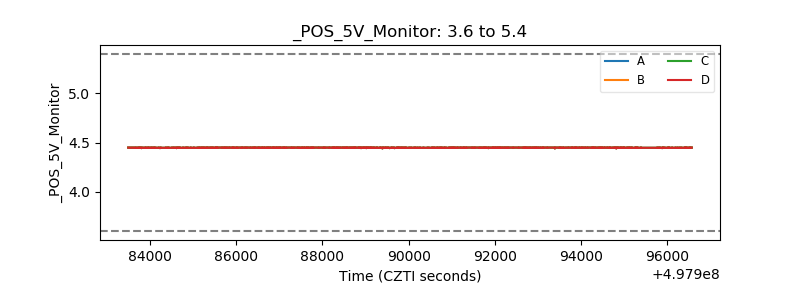 |
| _ROLL_ROT | 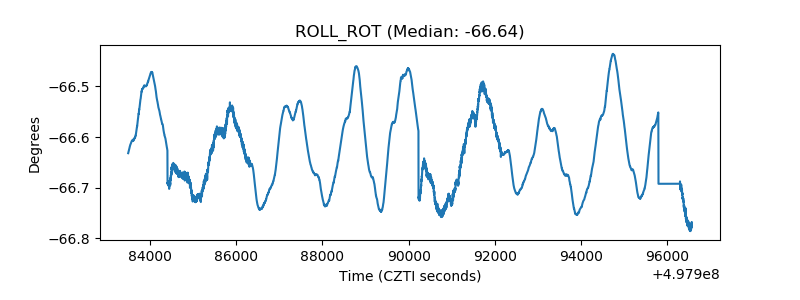 |
| _Roll_DEC | 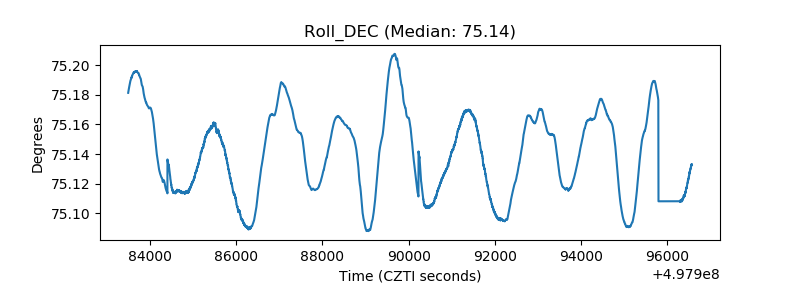 |
| _Roll_RA | 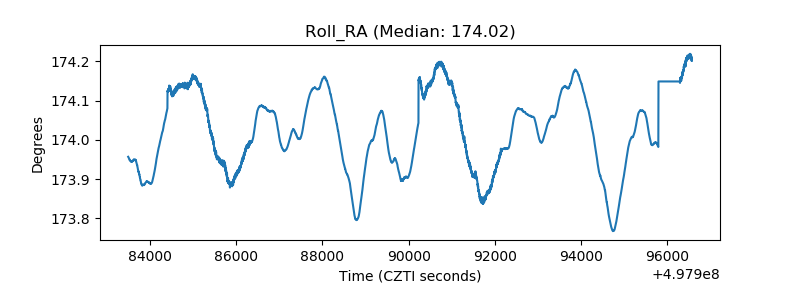 |
| Veto Counter | 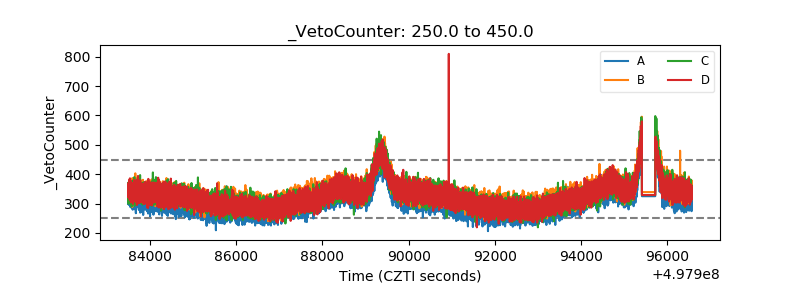 |