| Param | Original file | Final file |
|---|---|---|
| Filename | modeM0/AS1A14_126T15_9000006516_54322cztM0_level2.fits | modeM0/AS1A14_126T15_9000006516_54322cztM0_level2_quad_clean.evt |
| Size (bytes) | 772,176,960 | 98,668,800 |
| Size | 736.4 MB | 94.1 MB |
| Events in quadrant A | 4,191,577 | 720,289 |
| Events in quadrant B | 3,586,253 | 774,239 |
| Events in quadrant C | 6,383,707 | 609,337 |
| Events in quadrant D | 13,826,014 | 348,945 |
| Mode SS | |||
|---|---|---|---|
| Quadrant | BADHDUFLAG | Total packets | Discarded packets |
| A | 0 | 160 | 2 |
| B | 0 | 158 | 0 |
| C | 0 | 165 | 7 |
| D | 0 | 159 | 1 |
| Mode M0 | |||
|---|---|---|---|
| Quadrant | BADHDUFLAG | Total packets | Discarded packets |
| A | 0 | 18379 | 364 |
| B | 0 | 16593 | 332 |
| C | 0 | 24867 | 328 |
| D | 0 | 46980 | 606 |
| Mode M9 | |||
|---|---|---|---|
| Quadrant | BADHDUFLAG | Total packets | Discarded packets |
| A | 0 | 14 | 0 |
| B | 0 | 17 | 3 |
| C | 0 | 14 | 0 |
| D | 0 | 16 | 2 |
| Quadrant | Total seconds | Saturated seconds | Saturation percentage |
|---|---|---|---|
| A | 7684 | 214 | 2.785008% |
| B | 7686 | 50 | 0.650533% |
| C | 7683 | 1106 | 14.395418% |
| D | 7678 | 3825 | 49.817661% |
Noise dominated data is calculated using 1-second bins in cleaned event files. If a bin has >2000 counts, and if more than 50% of those come from <1% of pixels, then it is considered to be noise-dominated and hence unusable.
| Quadrant | # 1 sec bins | Bins with >0 counts | Bins with >2000 counts | High rate bins dominated by noise | Noise dominated (total time) | Noise dominated (detector-on time) | Marked lightcurve |
|---|---|---|---|---|---|---|---|
| A | 10067 | 7692 | 145 | 145 | 1.44% | 1.89% | 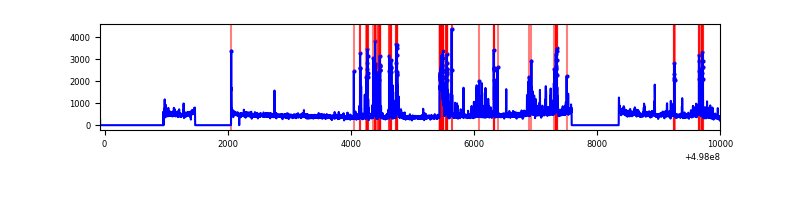 |
| B | 9043 | 7693 | 7 | 7 | 0.08% | 0.09% | 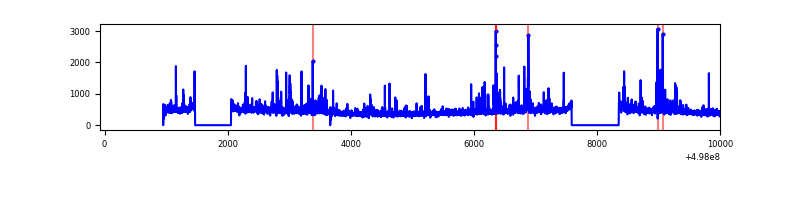 |
| C | 9044 | 7690 | 970 | 970 | 10.73% | 12.61% | 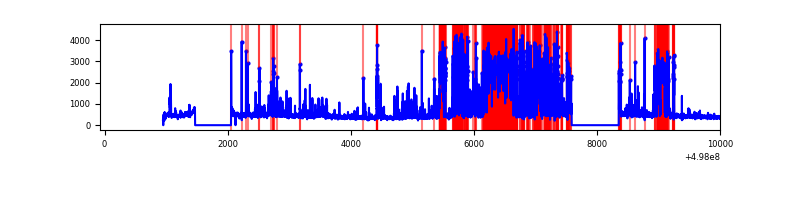 |
| D | 9039 | 7685 | 3327 | 3327 | 36.81% | 43.29% | 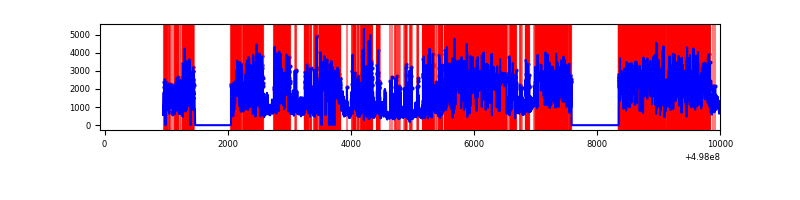 |
Top three noisy pixels from each quadrant. If the there are fewer than three noisy pixels in the level2.evt file, extra rows are filled as -1
| Pixel properties | Quadrant properties | ||||||
|---|---|---|---|---|---|---|---|
| Quadrant | DetID | PixID | Counts | Sigma | Mean | Median | Sigma |
| A | 7 | 29 | 571499 | 2817.88 | 813 | 792 | 202.5 |
| A | 0 | 8 | 214376 | 1054.57 | 813 | 792 | 202.5 |
| A | 11 | 3 | 94312 | 461.76 | 813 | 792 | 202.5 |
| B | 0 | 213 | 107598 | 613.04 | 812 | 780 | 174.2 |
| B | 0 | 171 | 62395 | 353.62 | 812 | 780 | 174.2 |
| B | 10 | 247 | 47130 | 266.01 | 812 | 780 | 174.2 |
| C | 1 | 241 | 2729894 | 13292.2 | 748 | 741 | 205.3 |
| C | 14 | 254 | 221173 | 1073.6 | 748 | 741 | 205.3 |
| C | 15 | 157 | 95162 | 459.87 | 748 | 741 | 205.3 |
| D | 8 | 176 | 4537763 | 27082.6 | 583 | 556 | 167.5 |
| D | 15 | 108 | 4367529 | 26066.47 | 583 | 556 | 167.5 |
| D | 2 | 172 | 2032643 | 12129.53 | 583 | 556 | 167.5 |
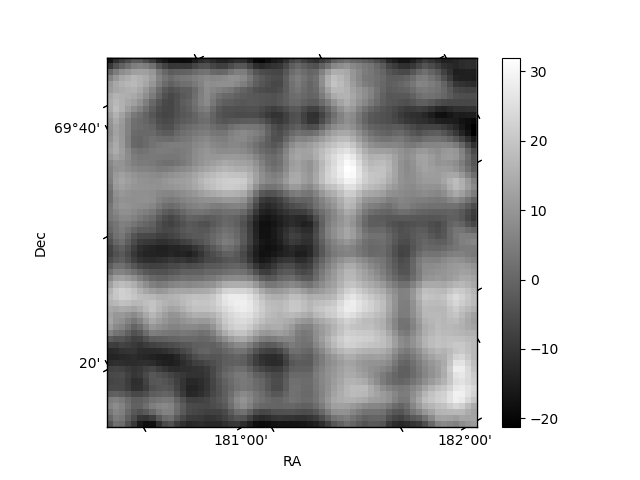
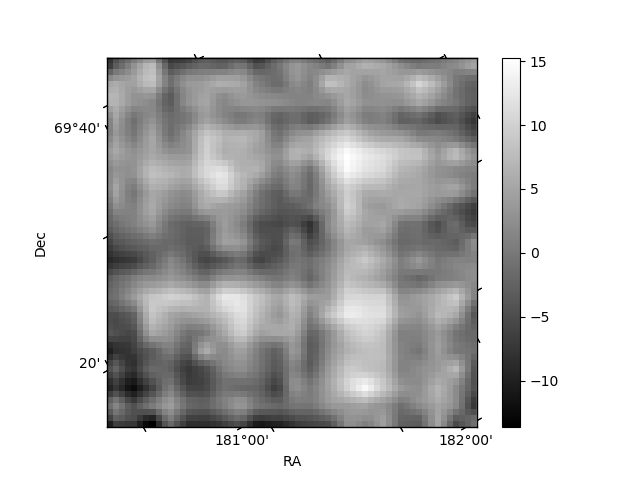
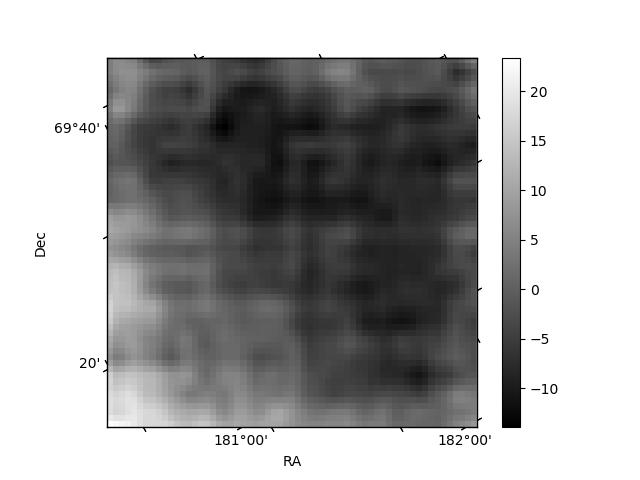
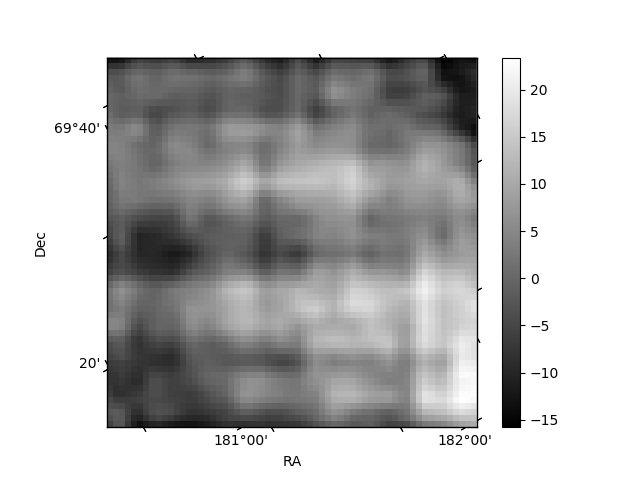
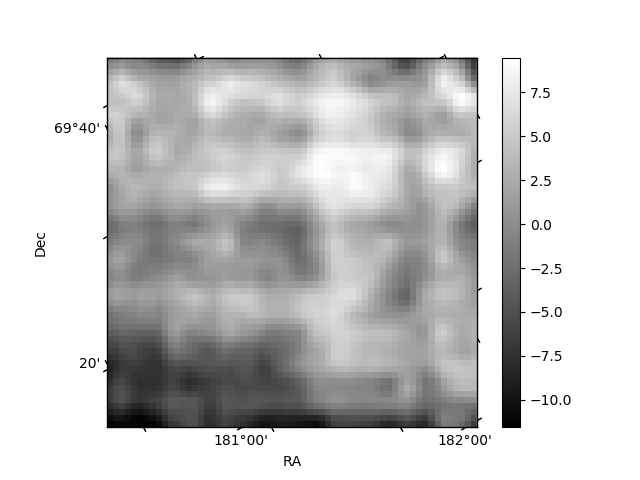
Histogram calculated using DETX and DETY for each event in the final _common_clean file
| Quadrant A | 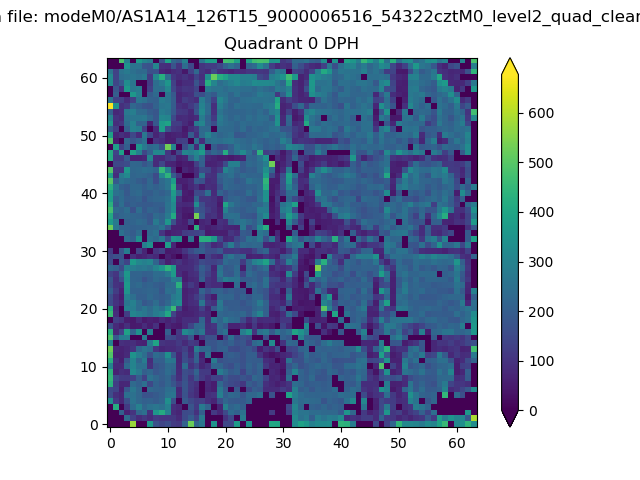 |
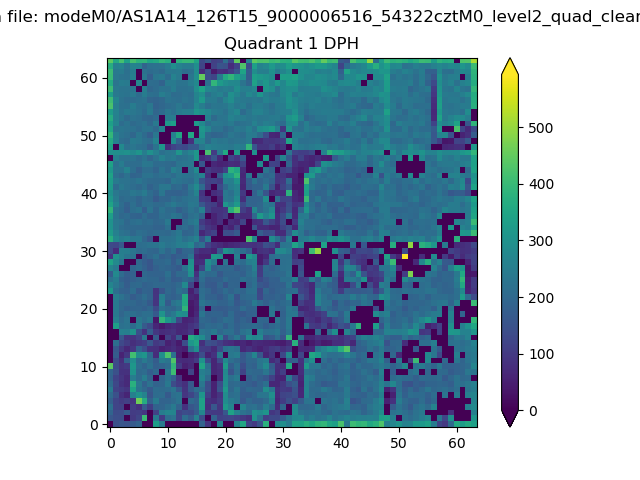 |
Quadrant B |
|---|---|---|---|
| Quadrant D | 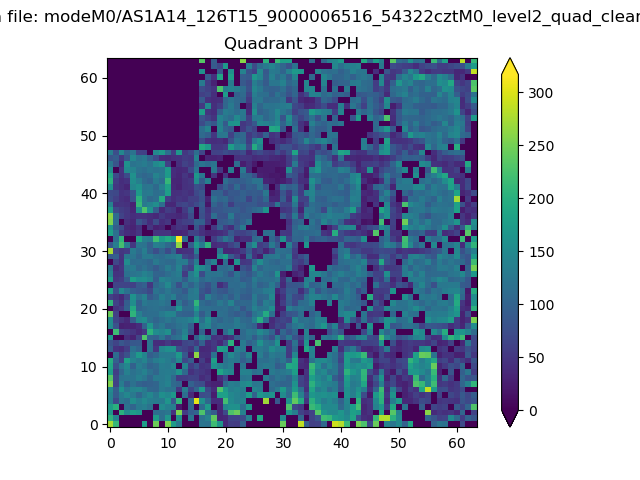 |
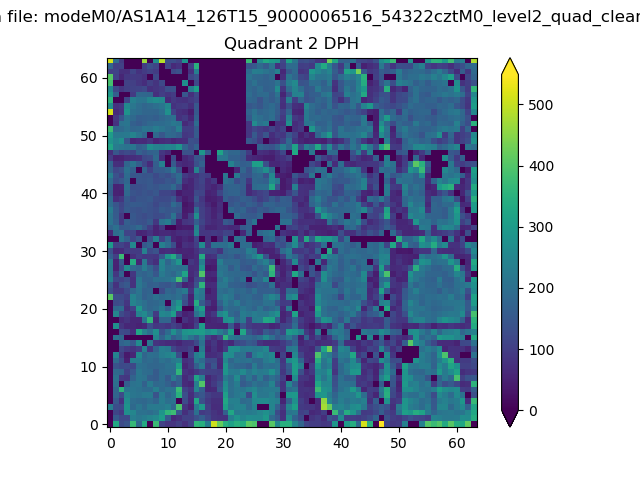 |
Quadrant C |
| Plot type | Count rate plots | Images |
|---|---|---|
| Comparison with Poisson distribution Blue bars denote a histogram of data divided into 1 sec bins. Red curve is a Poisson curve with rate = median count rate of data. |
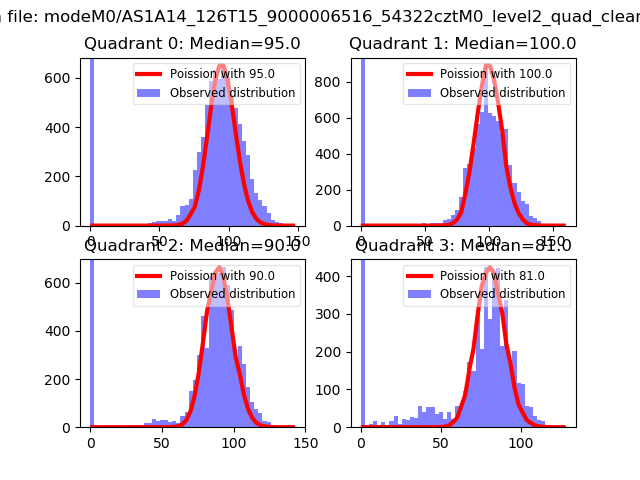 |
 |
| Quadrant-wise count rates Data is divided into 100 sec bins |
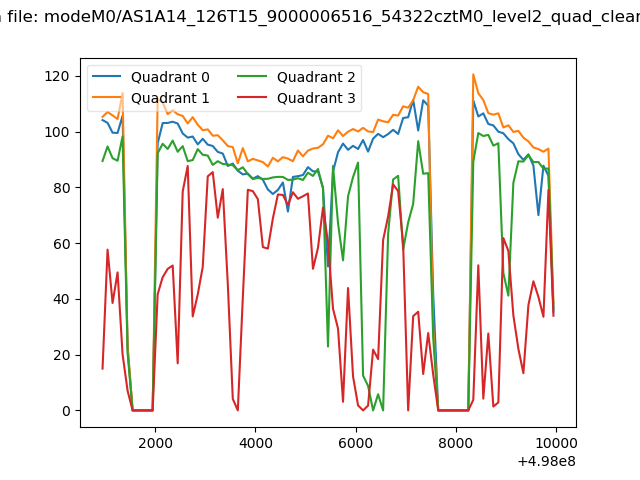 |
|
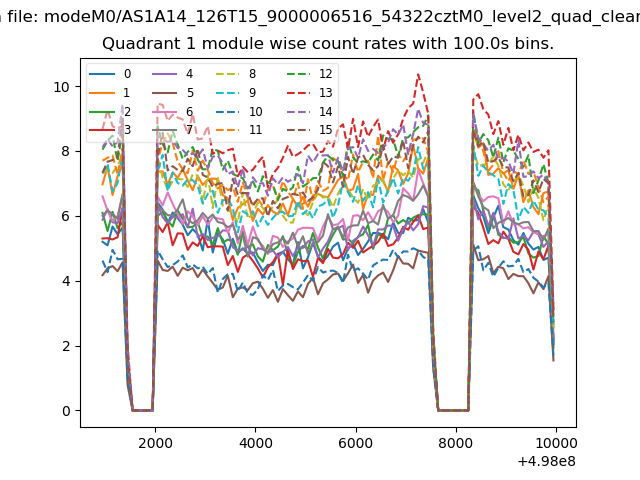
| Module-wise count rates for Quadrant A Data is divided into 100 sec bins |
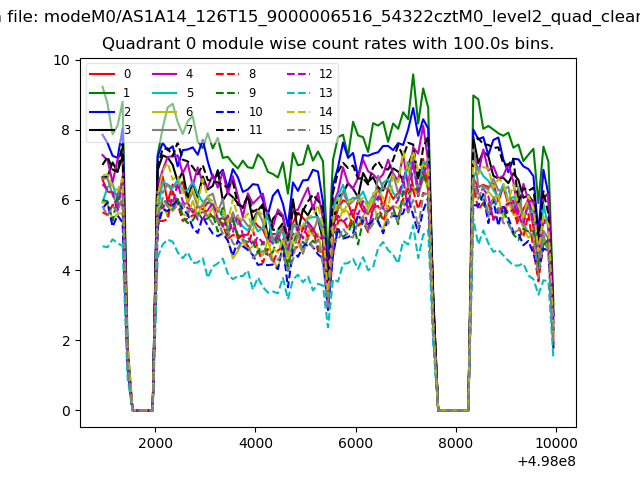 |
 |
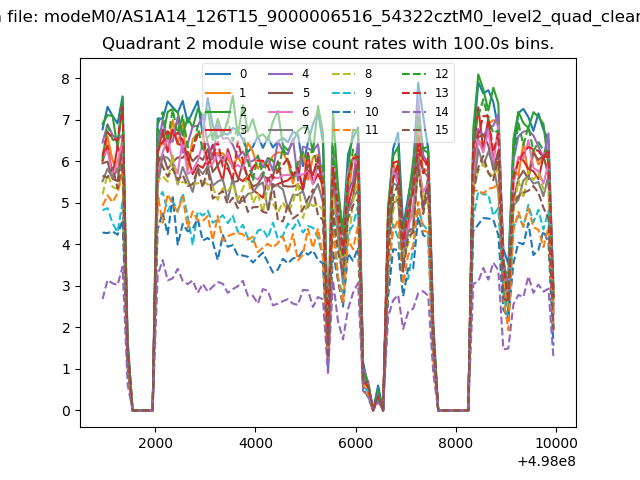
| Module-wise count rates for Quadrant B Data is divided into 100 sec bins |
 |
 |
| Module-wise count rates for Quadrant C Data is divided into 100 sec bins |
 |
 |
| Module-wise count rates for Quadrant D Data is divided into 100 sec bins |
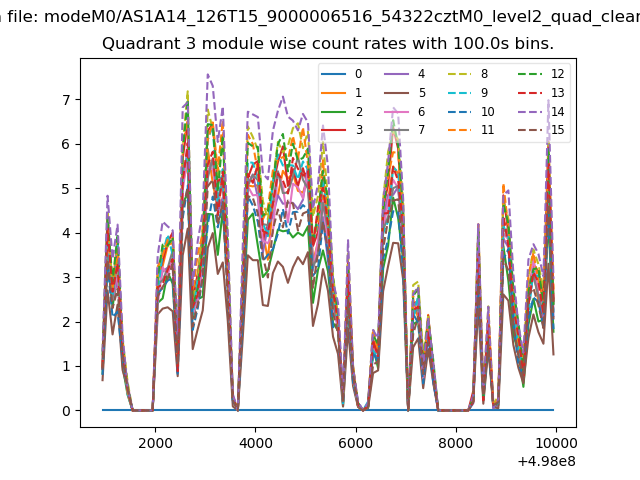 |
 |
| Parameter | Plot |
|---|---|
| CZT HV Monitor | 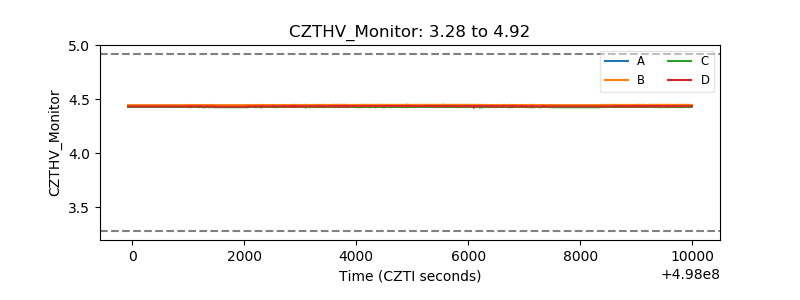 |
| D_VDD | 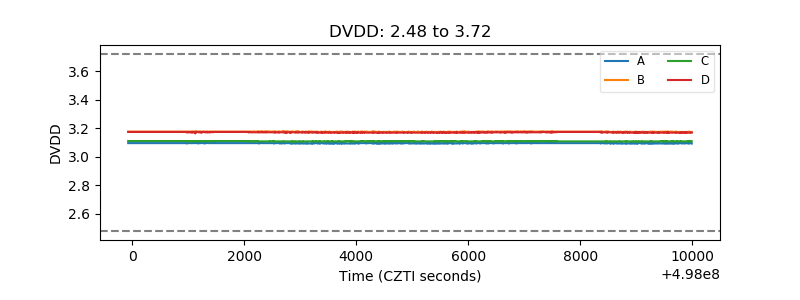 |
| Temperature 1 | 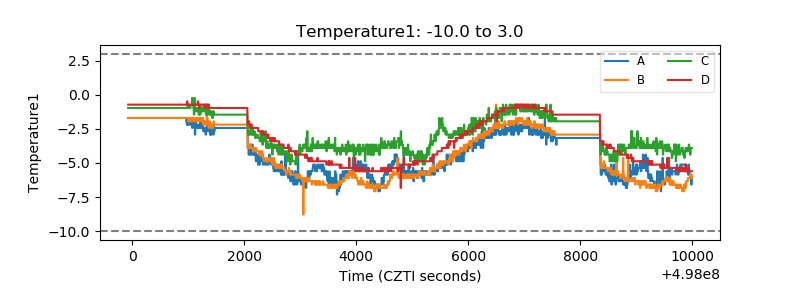 |
| Veto HV Monitor | 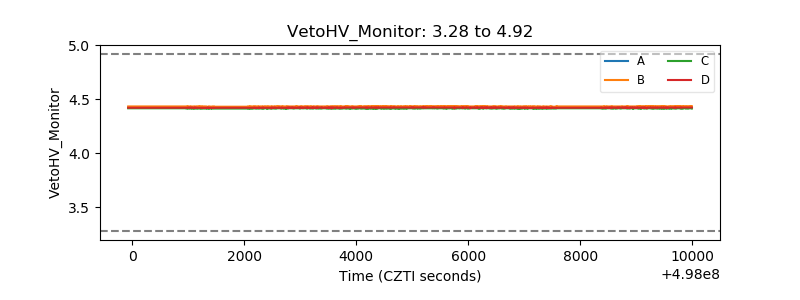 |
| Veto LLD | 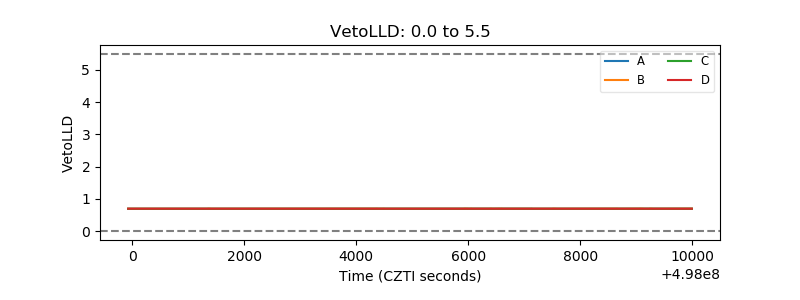 |
| Alpha Counter | 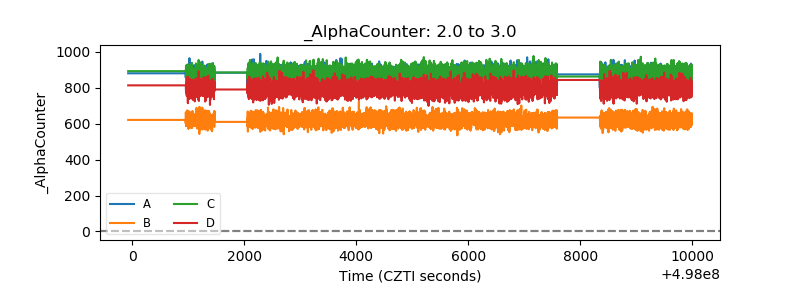 |
| _CPM_Rate | 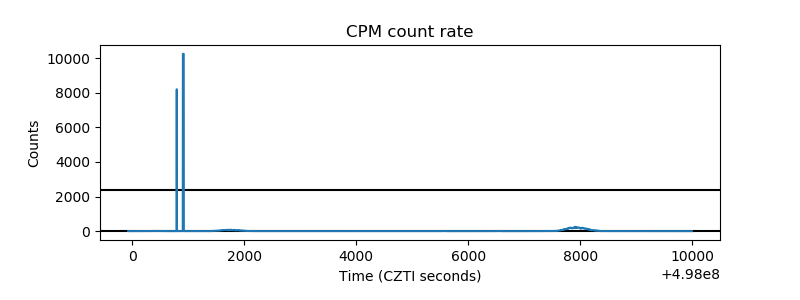 |
| CZT Counter | 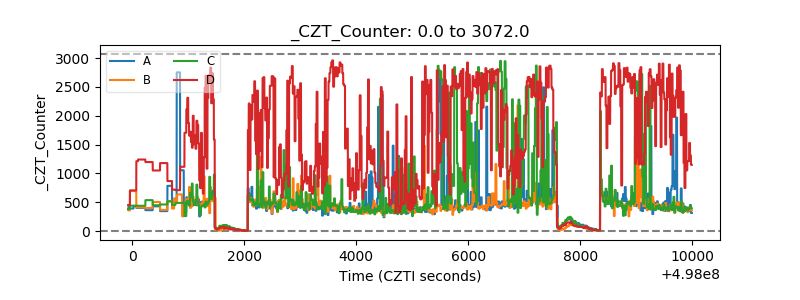 |
| +2.5 Volts monitor |  |
| +5 Volts monitor | 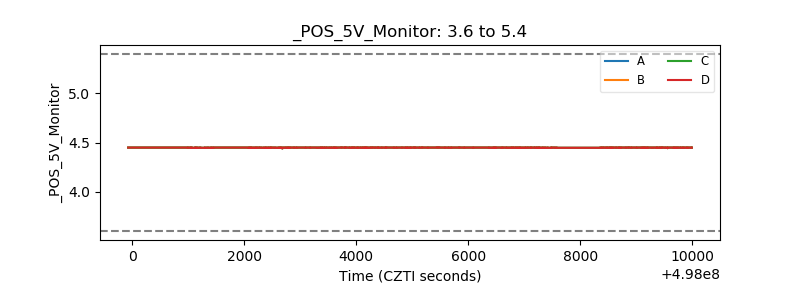 |
| _ROLL_ROT | 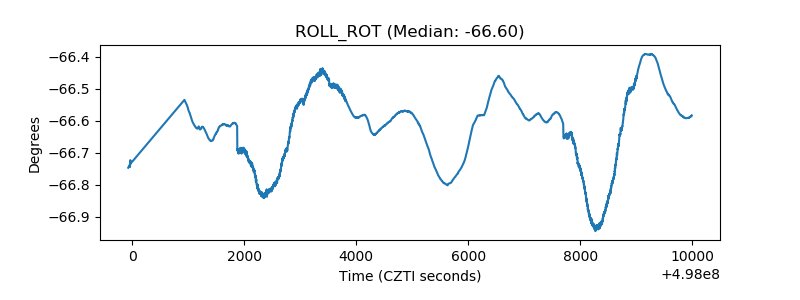 |
| _Roll_DEC | 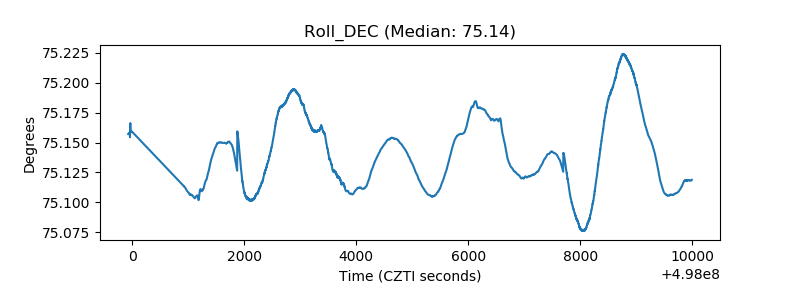 |
| _Roll_RA | 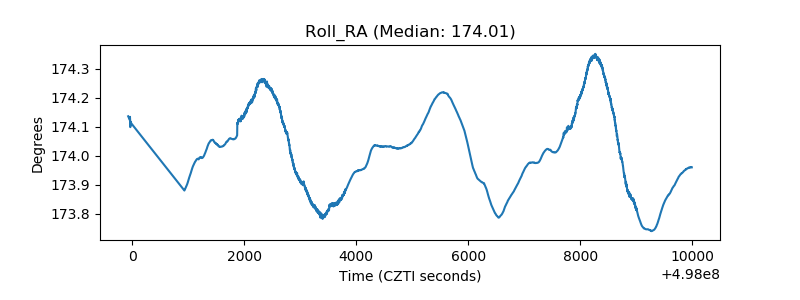 |
| Veto Counter | 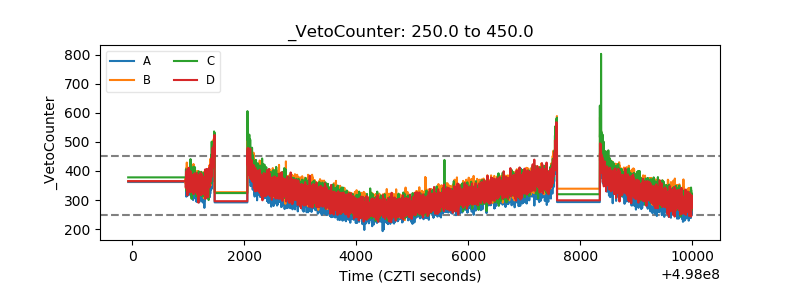 |