| Param | Original file | Final file |
|---|---|---|
| Filename | modeM0/AS1A14_126T15_9000006516_54323cztM0_level2.fits | modeM0/AS1A14_126T15_9000006516_54323cztM0_level2_quad_clean.evt |
| Size (bytes) | 1,649,499,840 | 237,263,040 |
| Size | 1.5 GB | 226.3 MB |
| Events in quadrant A | 10,156,617 | 1,639,882 |
| Events in quadrant B | 8,606,849 | 1,798,730 |
| Events in quadrant C | 14,537,069 | 1,467,033 |
| Events in quadrant D | 26,357,005 | 1,027,820 |
| Mode SS | |||
|---|---|---|---|
| Quadrant | BADHDUFLAG | Total packets | Discarded packets |
| A | 0 | 366 | 0 |
| B | 0 | 366 | 0 |
| C | 0 | 366 | 0 |
| D | 0 | 366 | 0 |
| Mode M0 | |||
|---|---|---|---|
| Quadrant | BADHDUFLAG | Total packets | Discarded packets |
| A | 0 | 43390 | 4 |
| B | 0 | 38886 | 4 |
| C | 0 | 56479 | 4 |
| D | 0 | 90931 | 4 |
| Mode M9 | |||
|---|---|---|---|
| Quadrant | BADHDUFLAG | Total packets | Discarded packets |
| A | 0 | 24 | 0 |
| B | 0 | 24 | 0 |
| C | 0 | 24 | 0 |
| D | 0 | 24 | 0 |
| Quadrant | Total seconds | Saturated seconds | Saturation percentage |
|---|---|---|---|
| A | 18138 | 715 | 3.942000% |
| B | 18138 | 128 | 0.705701% |
| C | 18138 | 1839 | 10.138935% |
| D | 18139 | 5922 | 32.647886% |
Noise dominated data is calculated using 1-second bins in cleaned event files. If a bin has >2000 counts, and if more than 50% of those come from <1% of pixels, then it is considered to be noise-dominated and hence unusable.
| Quadrant | # 1 sec bins | Bins with >0 counts | Bins with >2000 counts | High rate bins dominated by noise | Noise dominated (total time) | Noise dominated (detector-on time) | Marked lightcurve |
|---|---|---|---|---|---|---|---|
| A | 20453 | 18141 | 541 | 541 | 2.65% | 2.98% | 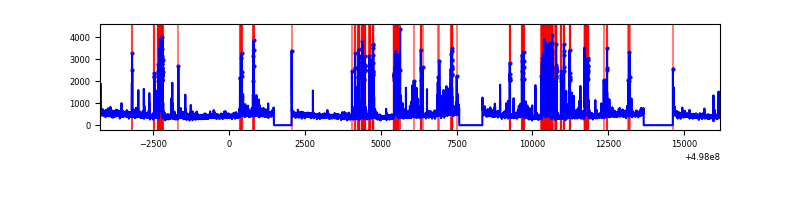 |
| B | 20453 | 18141 | 57 | 57 | 0.28% | 0.31% | 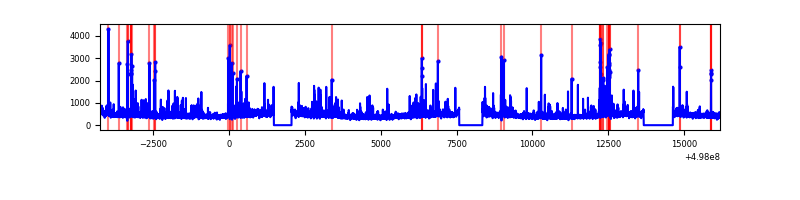 |
| C | 20453 | 18141 | 1656 | 1656 | 8.10% | 9.13% | 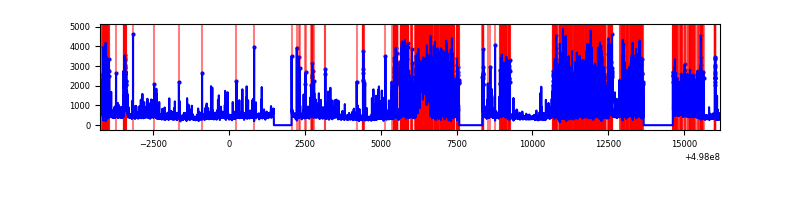 |
| D | 20454 | 18142 | 4991 | 4991 | 24.40% | 27.51% | 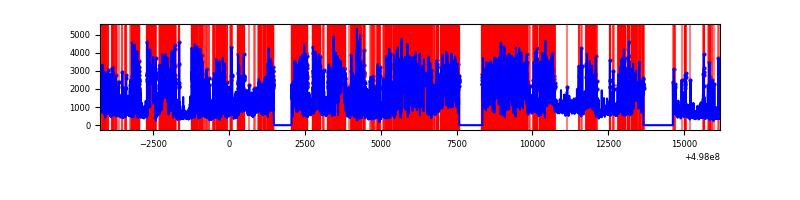 |
Top three noisy pixels from each quadrant. If the there are fewer than three noisy pixels in the level2.evt file, extra rows are filled as -1
| Pixel properties | Quadrant properties | ||||||
|---|---|---|---|---|---|---|---|
| Quadrant | DetID | PixID | Counts | Sigma | Mean | Median | Sigma |
| A | 7 | 29 | 1941768 | 4196.55 | 1872 | 1826 | 462.3 |
| A | 0 | 8 | 285961 | 614.65 | 1872 | 1826 | 462.3 |
| A | 4 | 78 | 160691 | 343.66 | 1872 | 1826 | 462.3 |
| B | 5 | 172 | 223004 | 554.48 | 1878 | 1806 | 398.9 |
| B | 0 | 213 | 220363 | 547.86 | 1878 | 1806 | 398.9 |
| B | 0 | 171 | 202309 | 502.61 | 1878 | 1806 | 398.9 |
| C | 1 | 241 | 3445544 | 7115.35 | 1769 | 1749 | 484.0 |
| C | 1 | 16 | 2417059 | 4990.36 | 1769 | 1749 | 484.0 |
| C | 1 | 29 | 655152 | 1350.02 | 1769 | 1749 | 484.0 |
| D | 8 | 176 | 7232934 | 16274.17 | 1540 | 1464 | 444.4 |
| D | 15 | 108 | 5734066 | 12901.02 | 1540 | 1464 | 444.4 |
| D | 2 | 172 | 5007087 | 11264.98 | 1540 | 1464 | 444.4 |
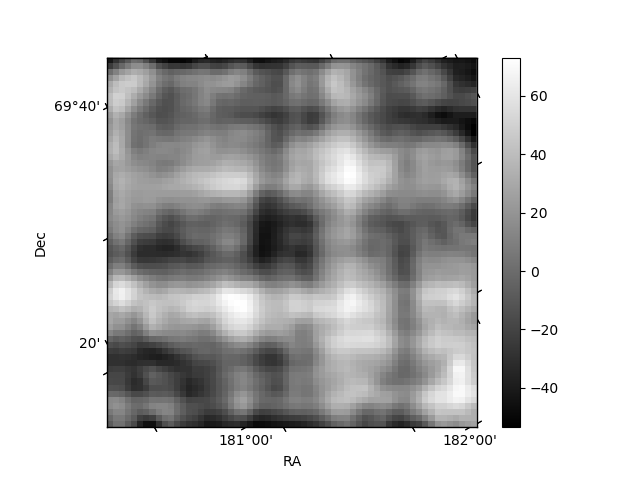
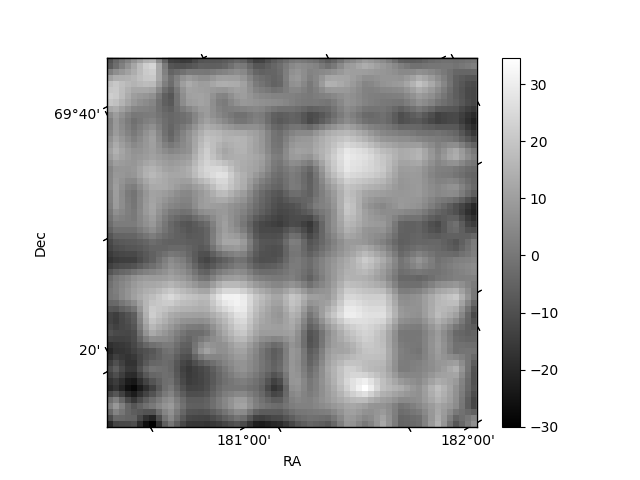
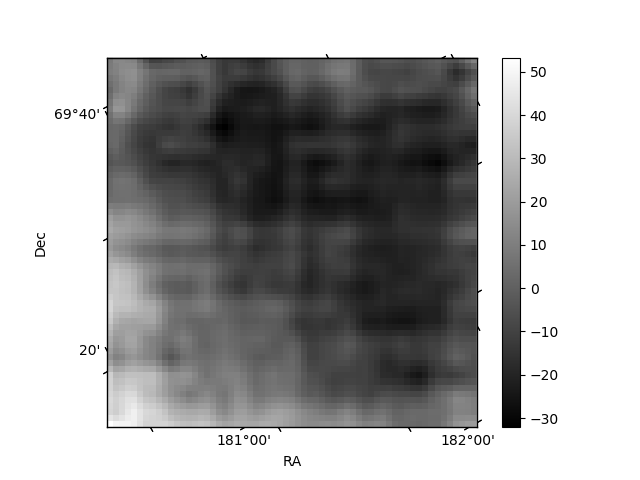
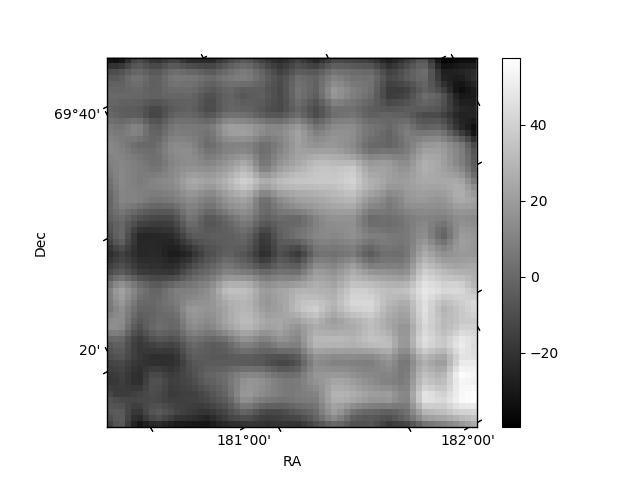
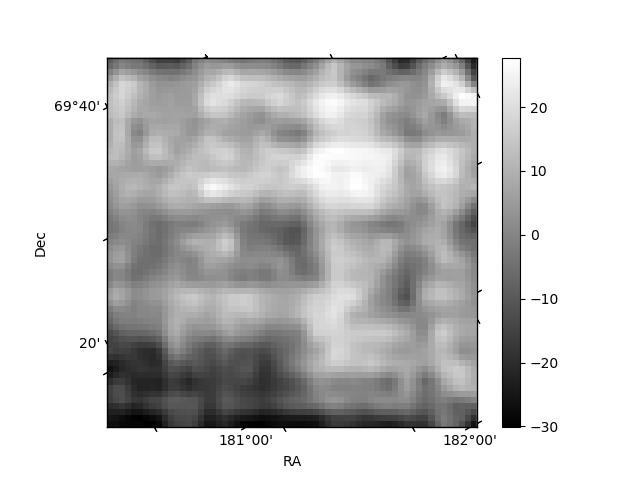
Histogram calculated using DETX and DETY for each event in the final _common_clean file
| Quadrant A | 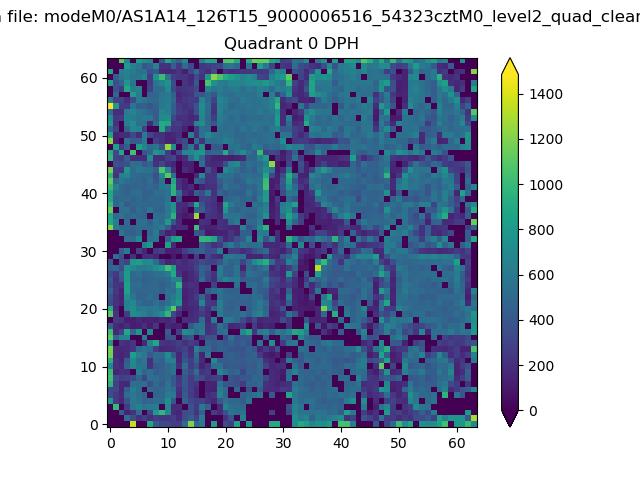 |
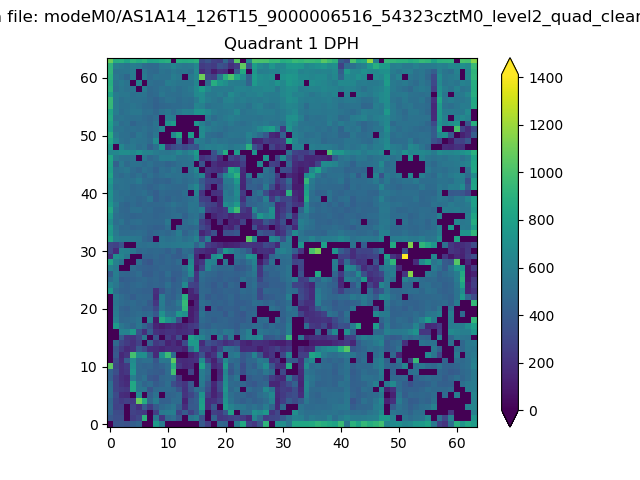 |
Quadrant B |
|---|---|---|---|
| Quadrant D | 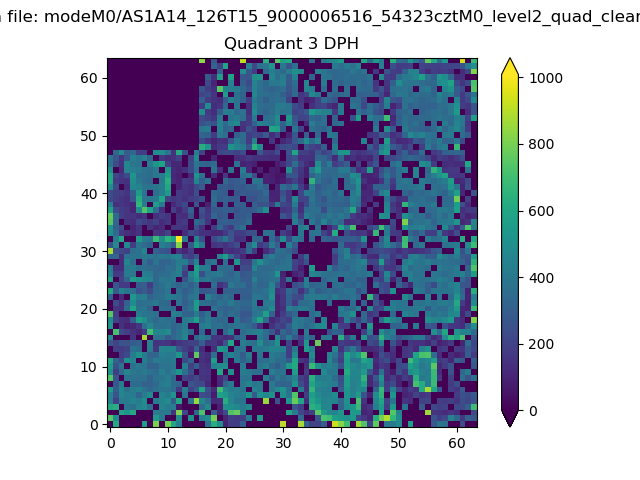 |
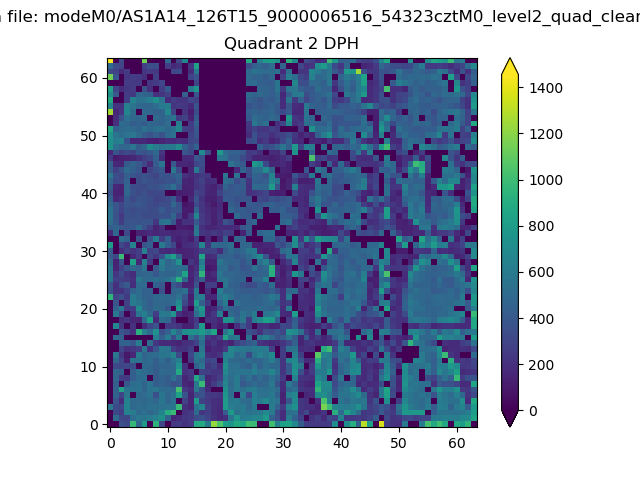 |
Quadrant C |
| Plot type | Count rate plots | Images |
|---|---|---|
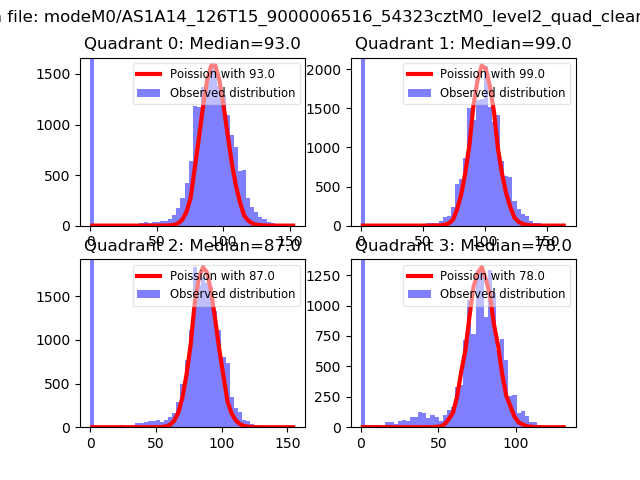
| Comparison with Poisson distribution Blue bars denote a histogram of data divided into 1 sec bins. Red curve is a Poisson curve with rate = median count rate of data. |
 |
 |
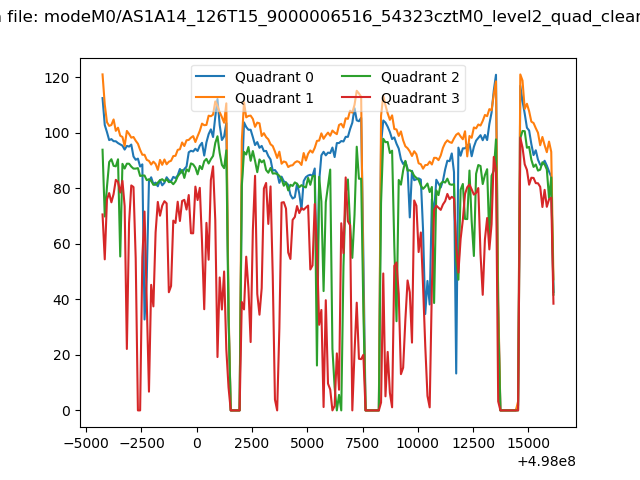
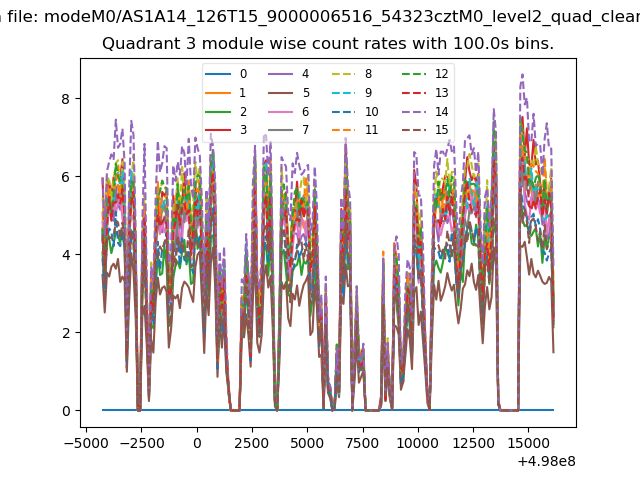
| Quadrant-wise count rates Data is divided into 100 sec bins |
 |
|
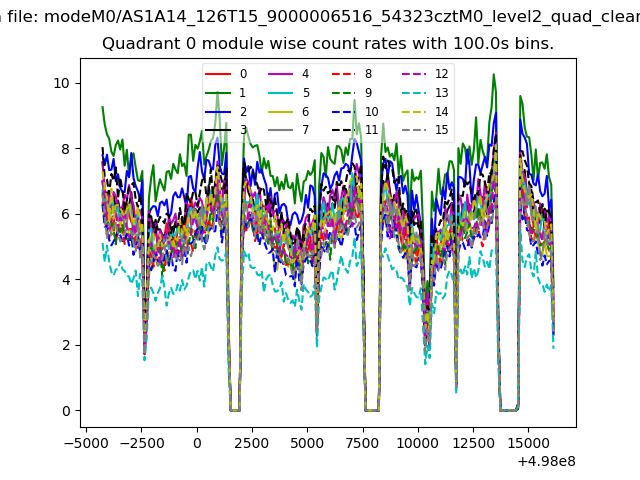
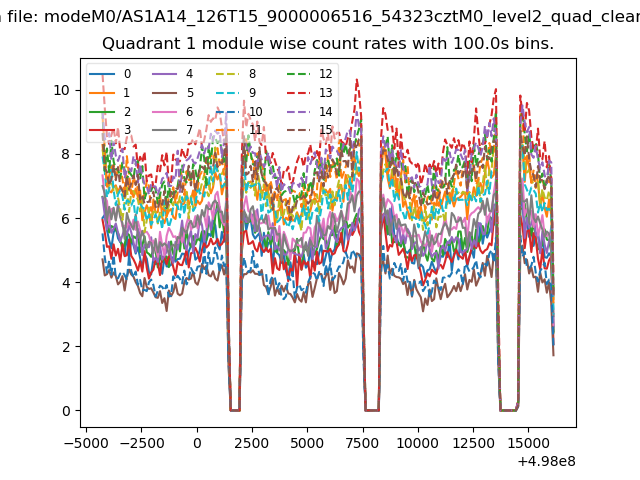
| Module-wise count rates for Quadrant A Data is divided into 100 sec bins |
 |
 |
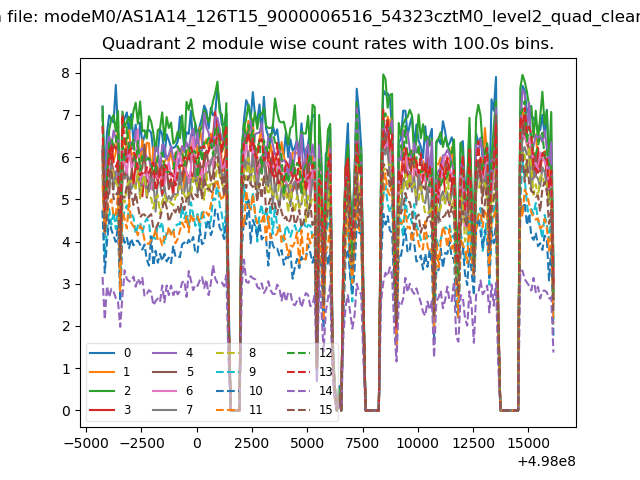
| Module-wise count rates for Quadrant B Data is divided into 100 sec bins |
 |
 |
| Module-wise count rates for Quadrant C Data is divided into 100 sec bins |
 |
 |
| Module-wise count rates for Quadrant D Data is divided into 100 sec bins |
 |
 |
| Parameter | Plot |
|---|---|
| CZT HV Monitor |  |
| D_VDD | 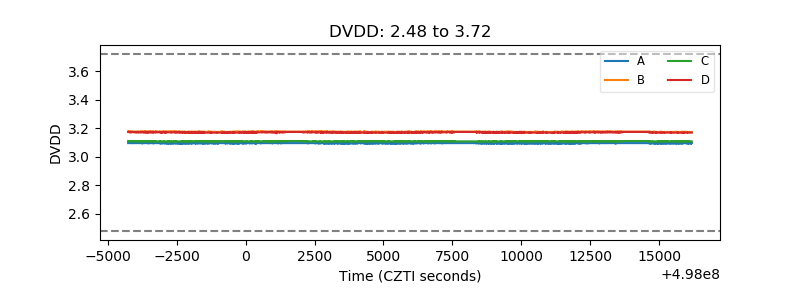 |
| Temperature 1 | 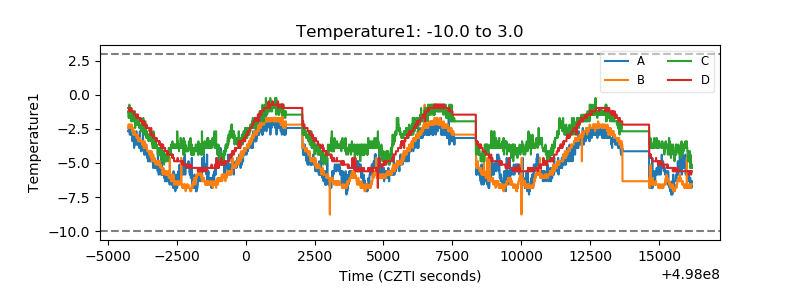 |
| Veto HV Monitor | 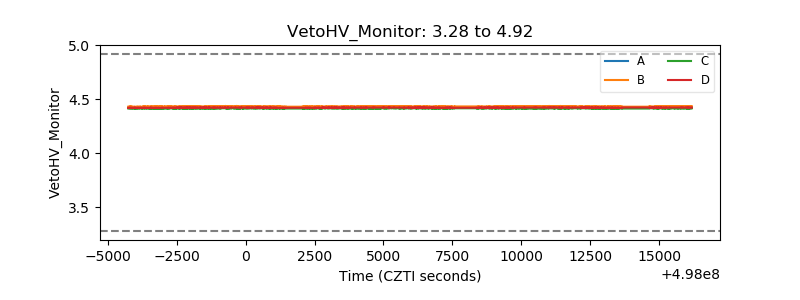 |
| Veto LLD | 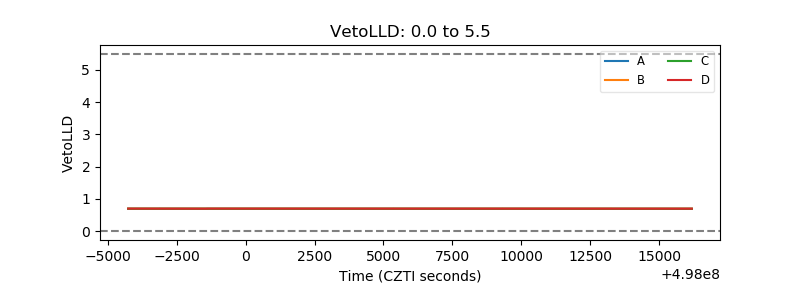 |
| Alpha Counter | 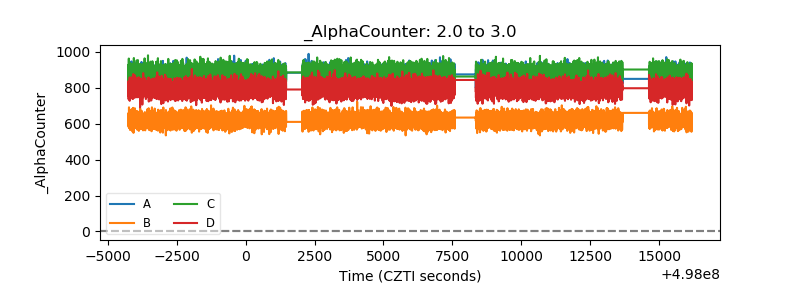 |
| _CPM_Rate | 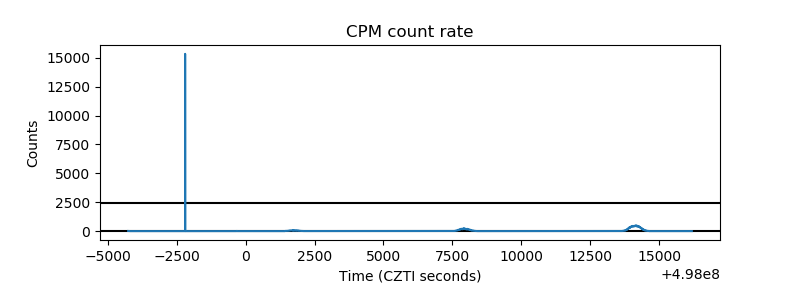 |
| CZT Counter | 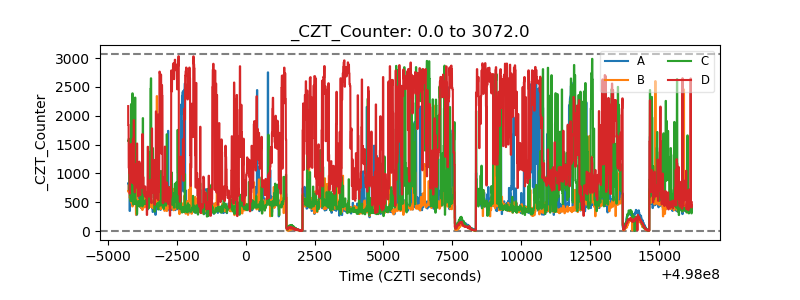 |
| +2.5 Volts monitor | 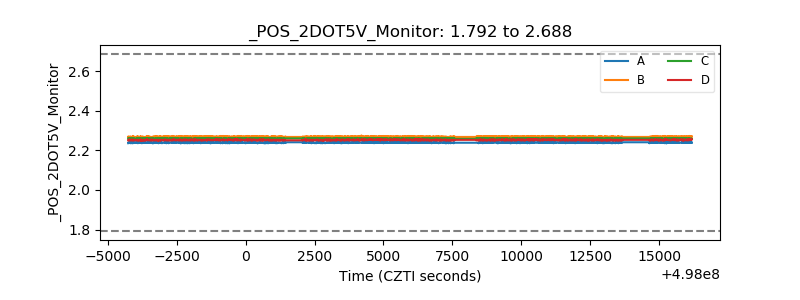 |
| +5 Volts monitor | 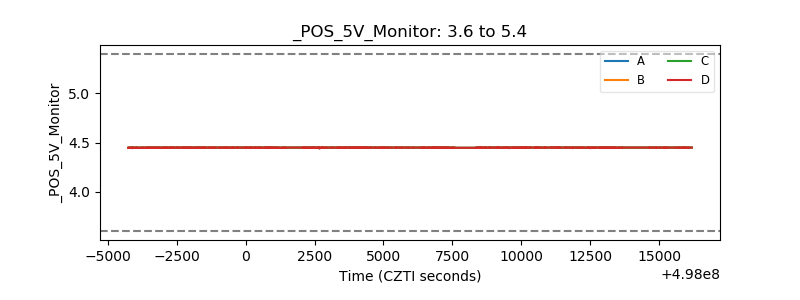 |
| _ROLL_ROT | 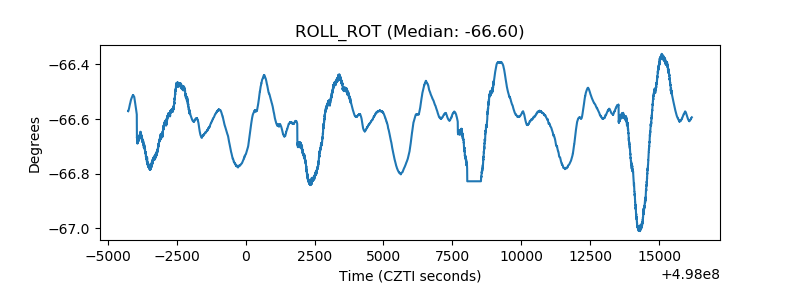 |
| _Roll_DEC | 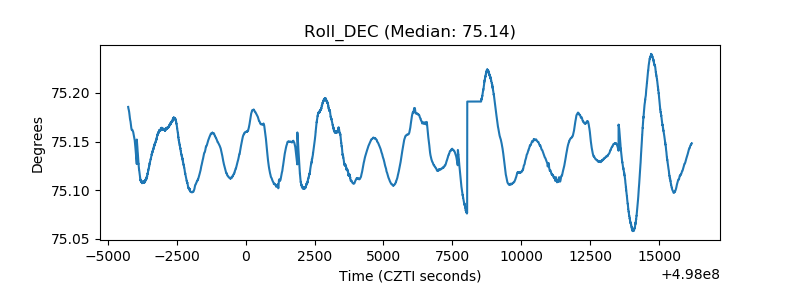 |
| _Roll_RA | 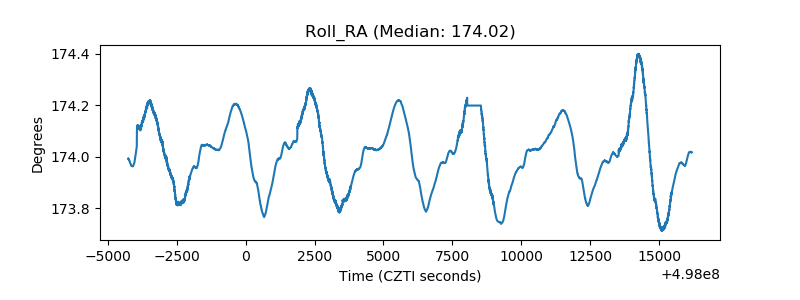 |
| Veto Counter | 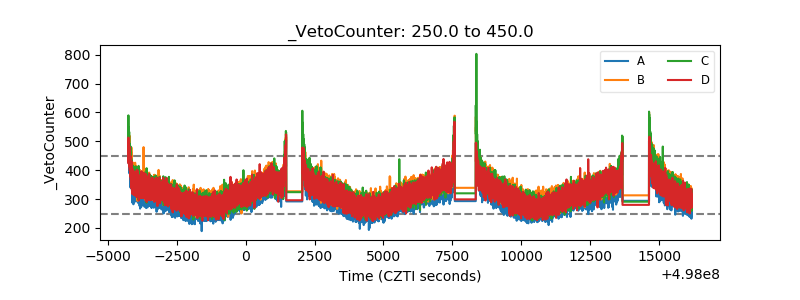 |