| Param | Original file | Final file |
|---|---|---|
| Filename | modeM0/AS1A14_126T15_9000006516_54325cztM0_level2.fits | modeM0/AS1A14_126T15_9000006516_54325cztM0_level2_quad_clean.evt |
| Size (bytes) | 605,986,560 | 90,587,520 |
| Size | 577.9 MB | 86.4 MB |
| Events in quadrant A | 3,182,579 | 638,708 |
| Events in quadrant B | 3,126,083 | 686,624 |
| Events in quadrant C | 5,337,683 | 590,745 |
| Events in quadrant D | 10,266,795 | 361,202 |
| Mode SS | |||
|---|---|---|---|
| Quadrant | BADHDUFLAG | Total packets | Discarded packets |
| A | 0 | 136 | 0 |
| B | 0 | 136 | 0 |
| C | 0 | 136 | 0 |
| D | 0 | 136 | 0 |
| Mode M0 | |||
|---|---|---|---|
| Quadrant | BADHDUFLAG | Total packets | Discarded packets |
| A | 0 | 14511 | 2 |
| B | 0 | 14126 | 2 |
| C | 0 | 20974 | 2 |
| D | 0 | 35097 | 2 |
| Mode M9 | |||
|---|---|---|---|
| Quadrant | BADHDUFLAG | Total packets | Discarded packets |
| A | 0 | 15 | 0 |
| B | 0 | 16 | 0 |
| C | 0 | 16 | 0 |
| D | 0 | 16 | 0 |
| Quadrant | Total seconds | Saturated seconds | Saturation percentage |
|---|---|---|---|
| A | 6675 | 103 | 1.543071% |
| B | 6675 | 52 | 0.779026% |
| C | 6675 | 489 | 7.325843% |
| D | 6675 | 2697 | 40.404494% |
Noise dominated data is calculated using 1-second bins in cleaned event files. If a bin has >2000 counts, and if more than 50% of those come from <1% of pixels, then it is considered to be noise-dominated and hence unusable.
| Quadrant | # 1 sec bins | Bins with >0 counts | Bins with >2000 counts | High rate bins dominated by noise | Noise dominated (total time) | Noise dominated (detector-on time) | Marked lightcurve |
|---|---|---|---|---|---|---|---|
| A | 7705 | 6676 | 67 | 67 | 0.87% | 1.00% | 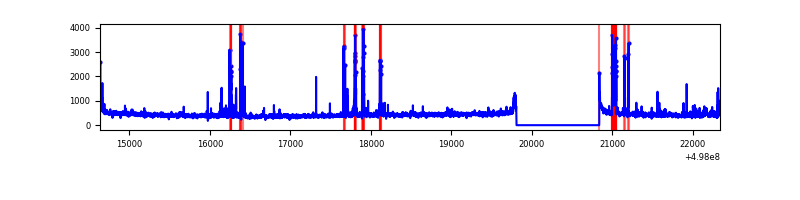 |
| B | 7705 | 6676 | 16 | 16 | 0.21% | 0.24% | 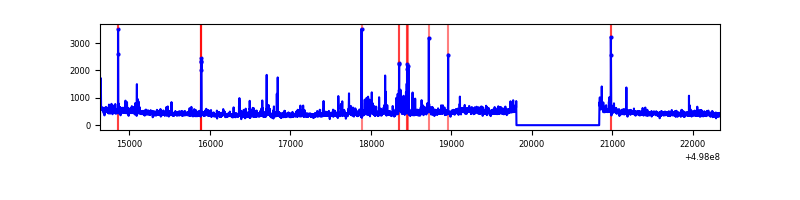 |
| C | 7705 | 6676 | 465 | 465 | 6.04% | 6.97% | 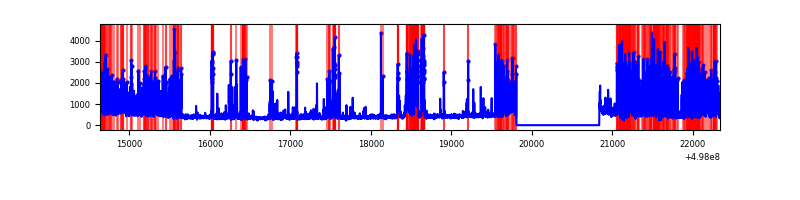 |
| D | 7705 | 6676 | 2544 | 2544 | 33.02% | 38.11% | 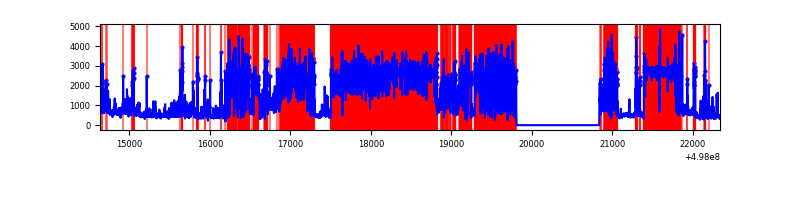 |
Top three noisy pixels from each quadrant. If the there are fewer than three noisy pixels in the level2.evt file, extra rows are filled as -1
| Pixel properties | Quadrant properties | ||||||
|---|---|---|---|---|---|---|---|
| Quadrant | DetID | PixID | Counts | Sigma | Mean | Median | Sigma |
| A | 7 | 29 | 232908 | 1349.54 | 698 | 681 | 172.1 |
| A | 0 | 8 | 142434 | 823.77 | 698 | 681 | 172.1 |
| A | 4 | 3 | 20986 | 118.0 | 698 | 681 | 172.1 |
| B | 0 | 171 | 121117 | 811.93 | 697 | 671 | 148.3 |
| B | 7 | 0 | 76225 | 509.31 | 697 | 671 | 148.3 |
| B | 10 | 245 | 52752 | 351.08 | 697 | 671 | 148.3 |
| C | 1 | 16 | 1838480 | 10029.06 | 665 | 658 | 183.2 |
| C | 1 | 241 | 412795 | 2249.04 | 665 | 658 | 183.2 |
| C | 14 | 254 | 193249 | 1050.97 | 665 | 658 | 183.2 |
| D | 8 | 176 | 5062527 | 32692.22 | 542 | 517 | 154.8 |
| D | 2 | 172 | 1468751 | 9482.37 | 542 | 517 | 154.8 |
| D | 3 | 12 | 1240500 | 8008.24 | 542 | 517 | 154.8 |
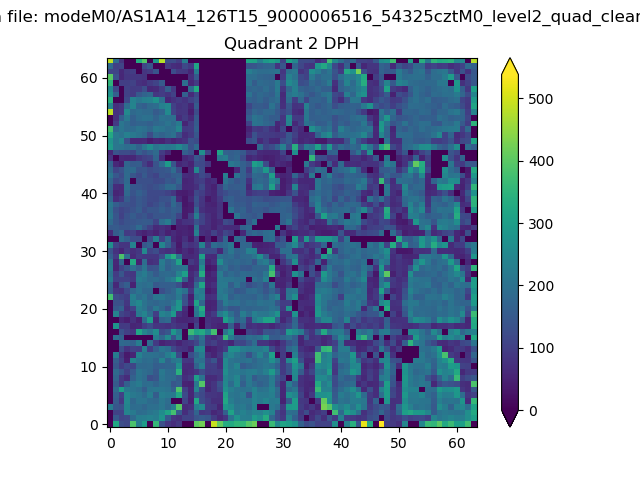
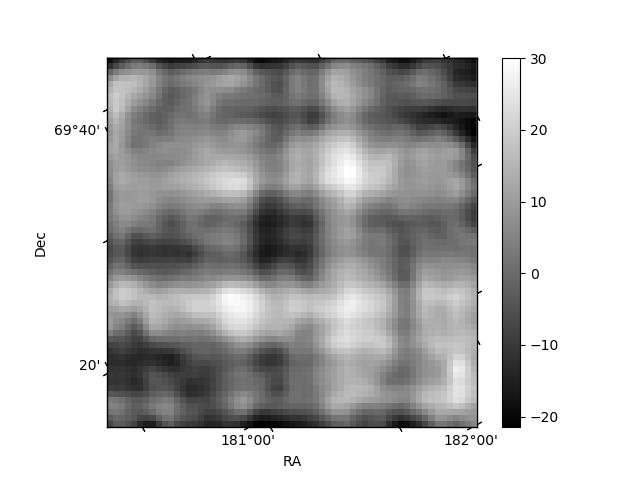
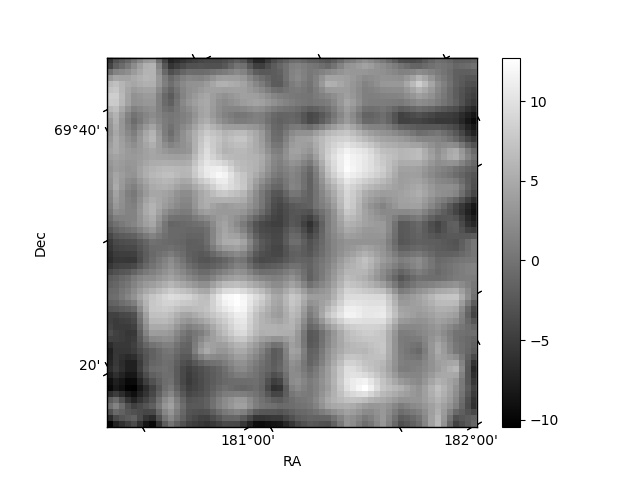
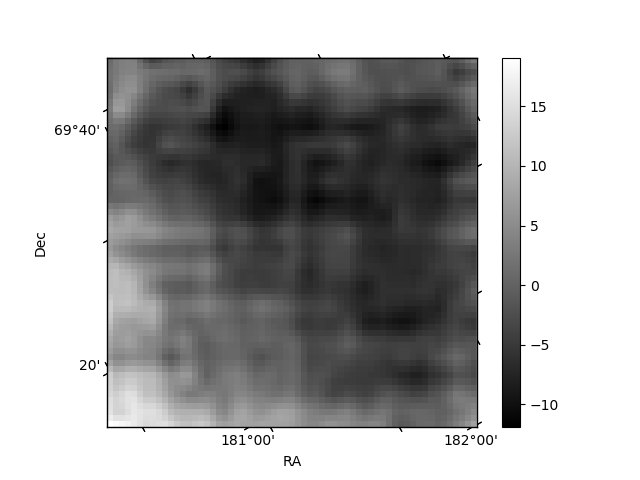
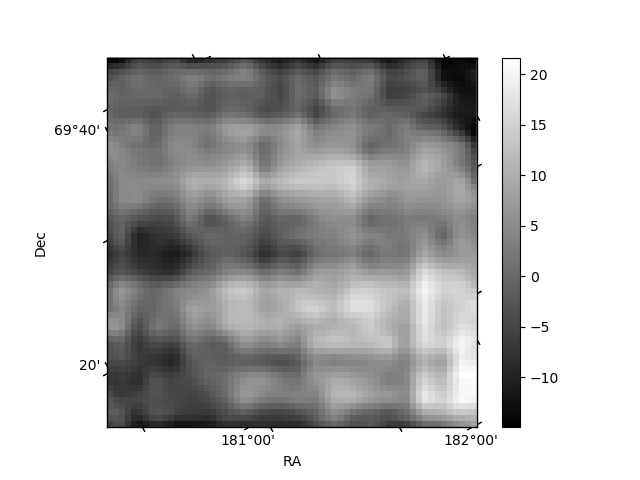
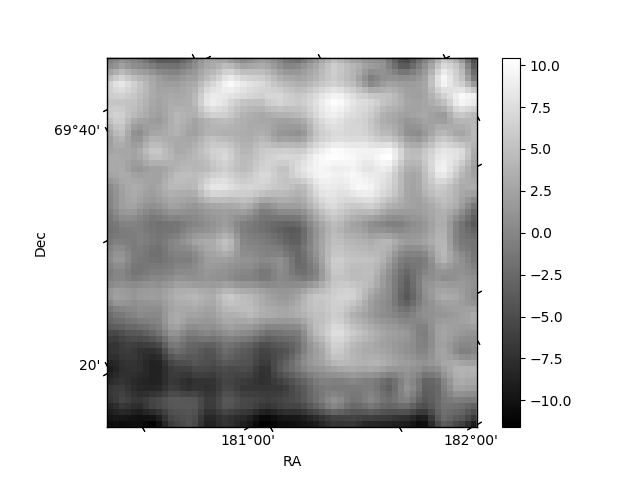
Histogram calculated using DETX and DETY for each event in the final _common_clean file
| Quadrant A | 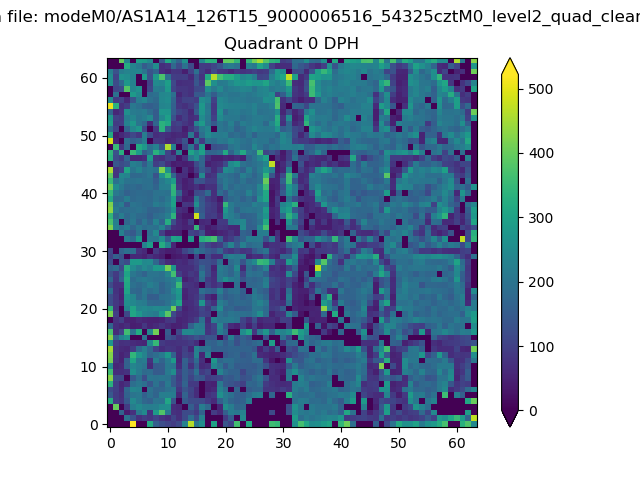 |
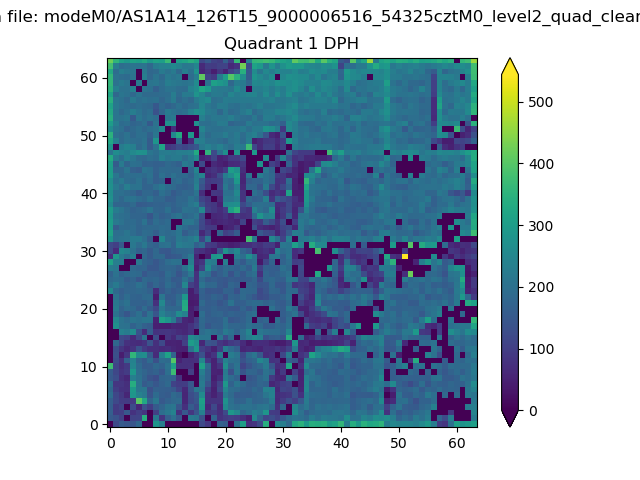 |
Quadrant B |
|---|---|---|---|
| Quadrant D | 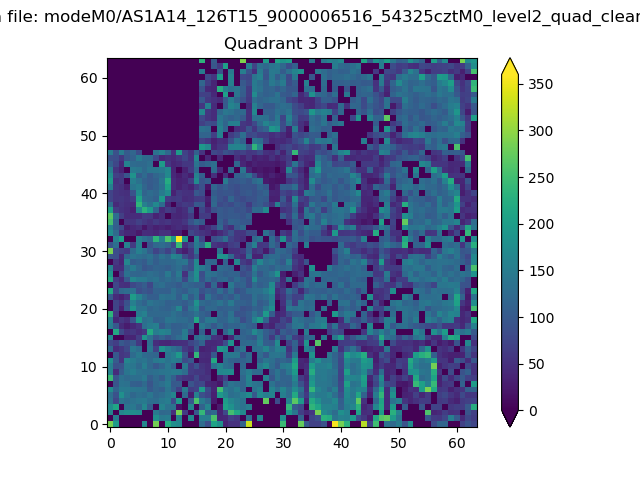 |
 |
Quadrant C |
| Plot type | Count rate plots | Images |
|---|---|---|
| Comparison with Poisson distribution Blue bars denote a histogram of data divided into 1 sec bins. Red curve is a Poisson curve with rate = median count rate of data. |
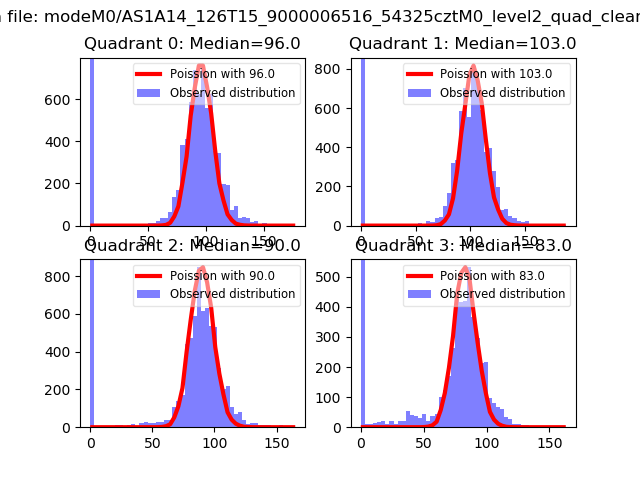 |
 |
| Quadrant-wise count rates Data is divided into 100 sec bins |
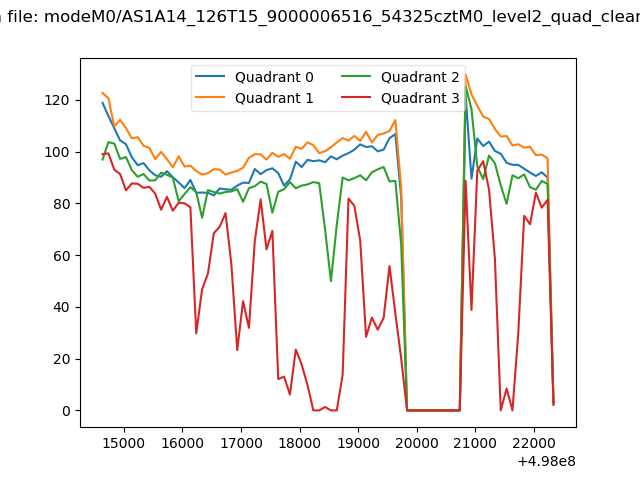 |
|
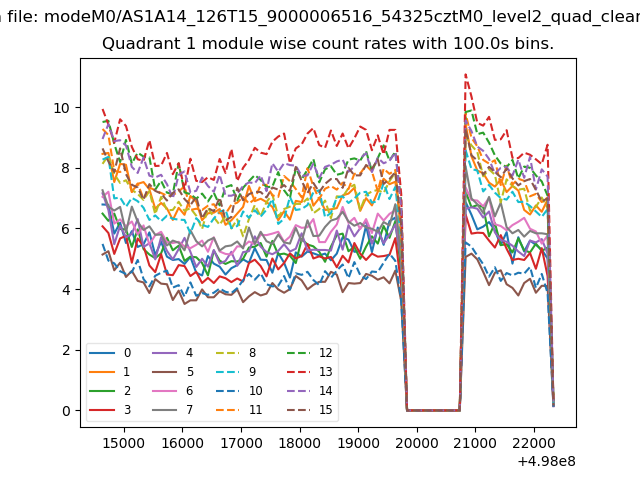
| Module-wise count rates for Quadrant A Data is divided into 100 sec bins |
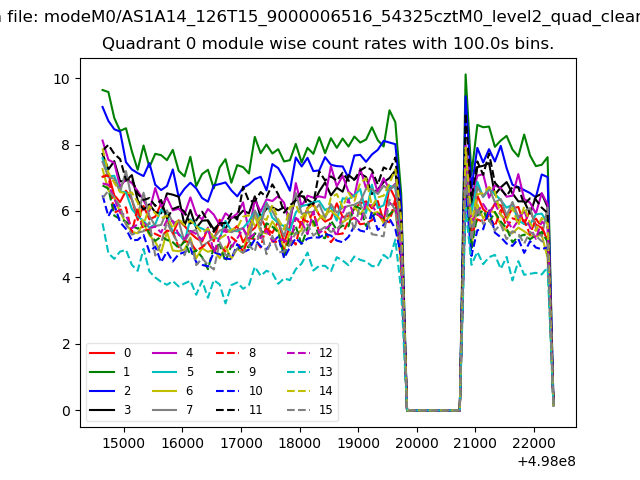 |
 |
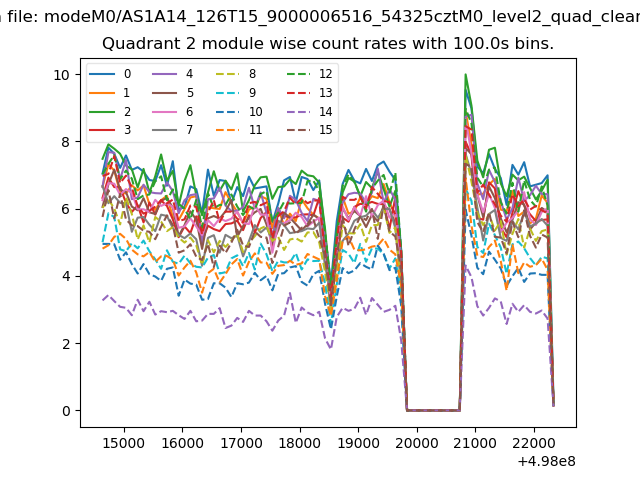
| Module-wise count rates for Quadrant B Data is divided into 100 sec bins |
 |
 |
| Module-wise count rates for Quadrant C Data is divided into 100 sec bins |
 |
 |
| Module-wise count rates for Quadrant D Data is divided into 100 sec bins |
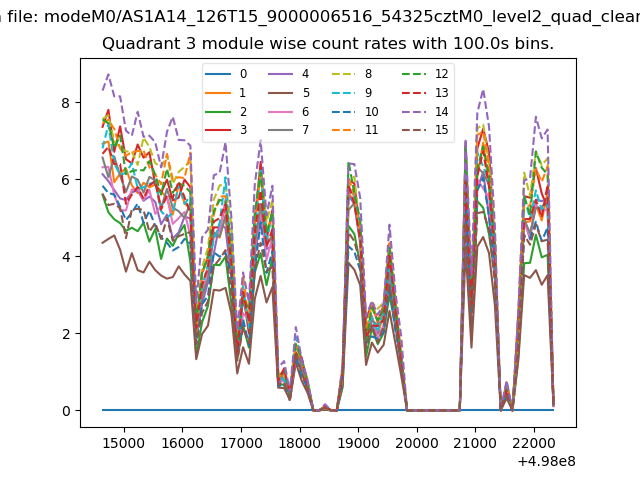 |
 |
| Parameter | Plot |
|---|---|
| CZT HV Monitor | 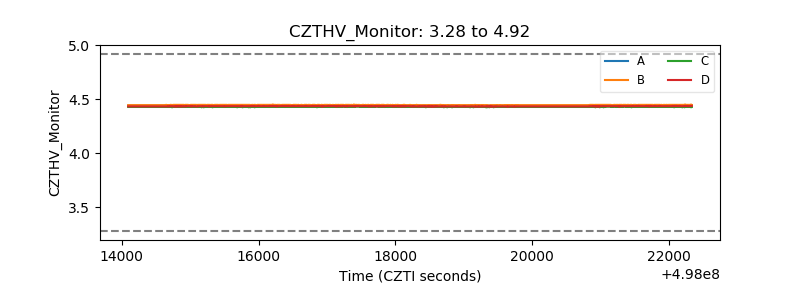 |
| D_VDD | 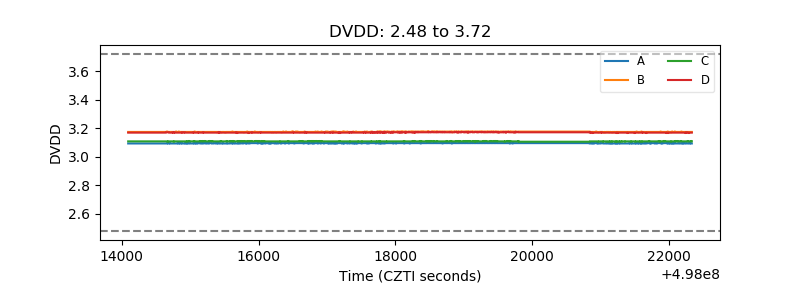 |
| Temperature 1 | 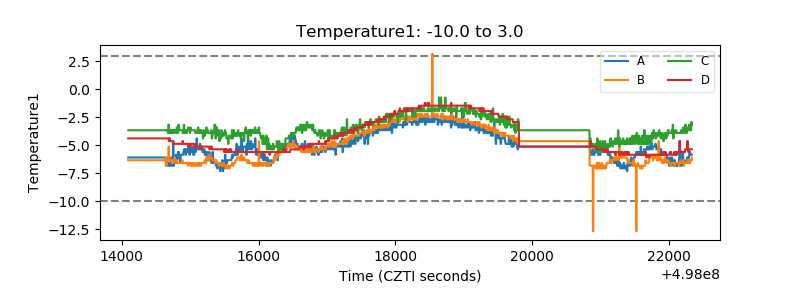 |
| Veto HV Monitor | 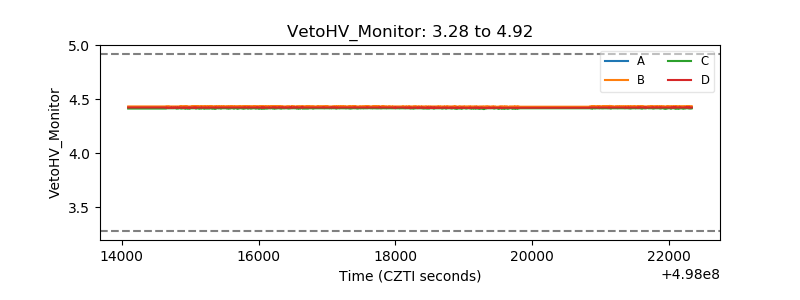 |
| Veto LLD | 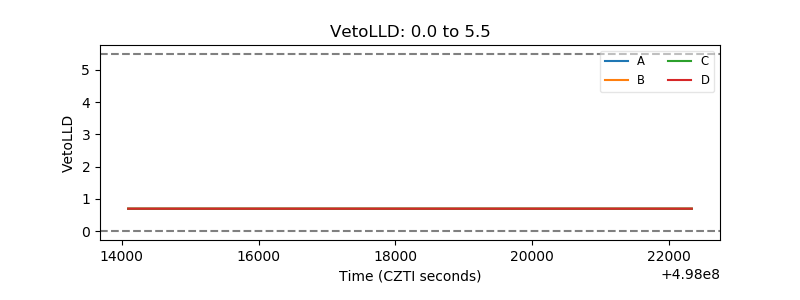 |
| Alpha Counter | 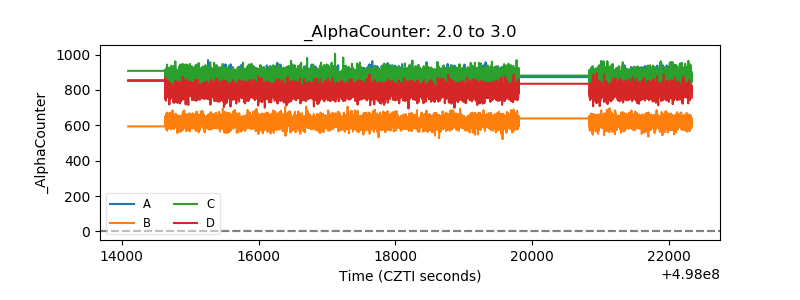 |
| _CPM_Rate | 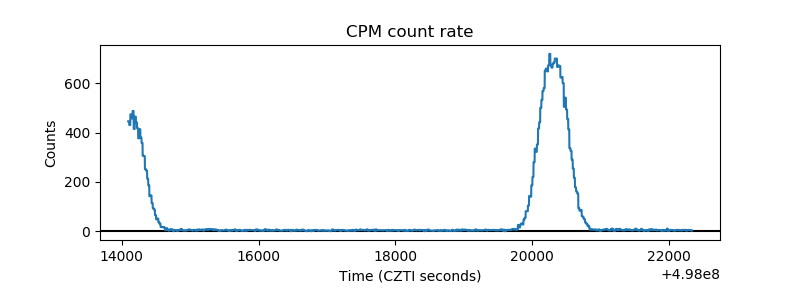 |
| CZT Counter | 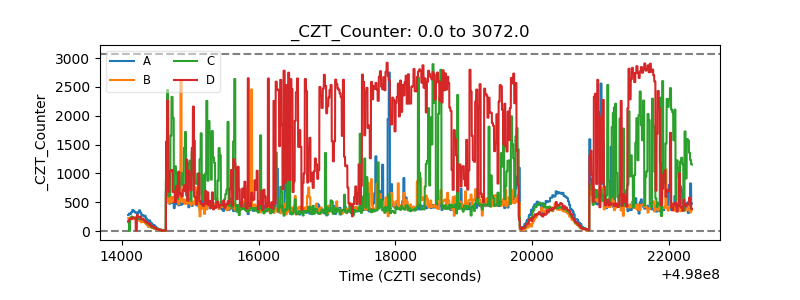 |
| +2.5 Volts monitor | 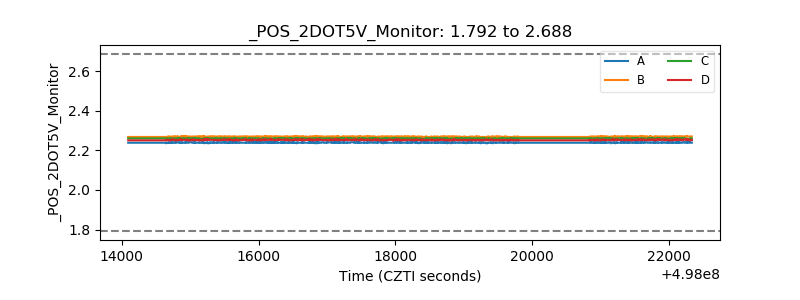 |
| +5 Volts monitor | 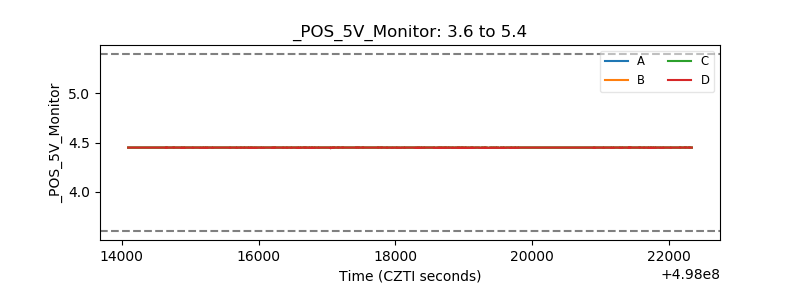 |
| _ROLL_ROT | 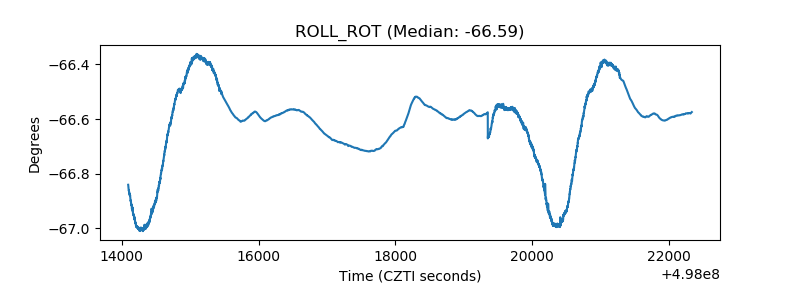 |
| _Roll_DEC | 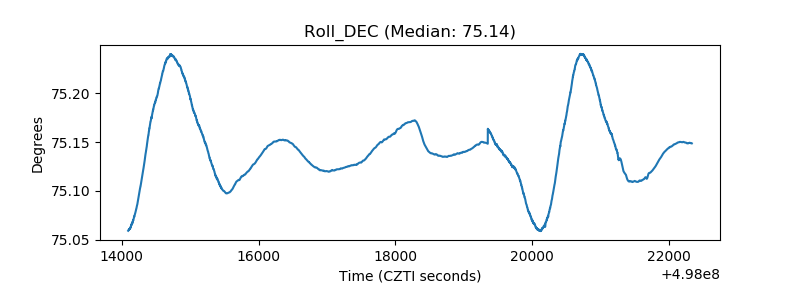 |
| _Roll_RA | 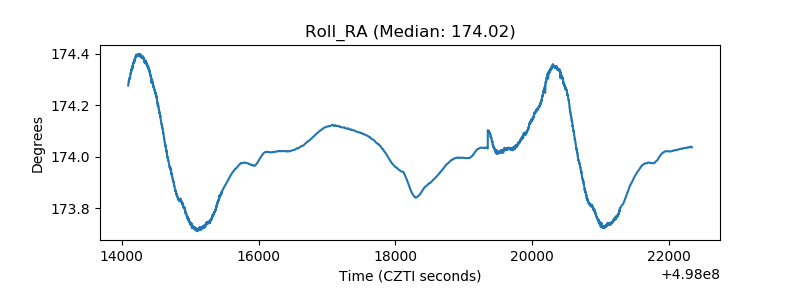 |
| Veto Counter | 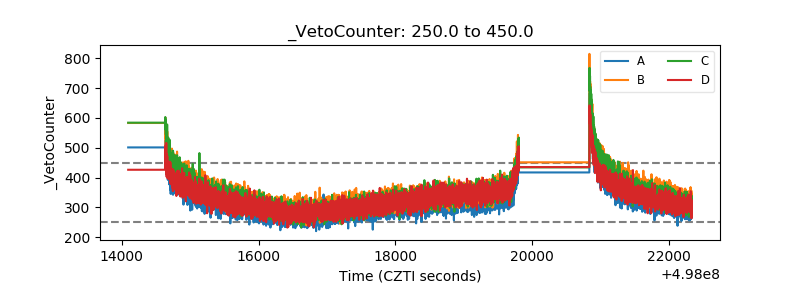 |