| Param | Original file | Final file |
|---|---|---|
| Filename | modeM0/AS1A14_126T15_9000006516_54326cztM0_level2.fits | modeM0/AS1A14_126T15_9000006516_54326cztM0_level2_quad_clean.evt |
| Size (bytes) | 667,100,160 | 74,283,840 |
| Size | 636.2 MB | 70.8 MB |
| Events in quadrant A | 2,601,622 | 567,713 |
| Events in quadrant B | 2,674,526 | 605,627 |
| Events in quadrant C | 8,200,526 | 414,243 |
| Events in quadrant D | 10,766,977 | 256,055 |
| Mode SS | |||
|---|---|---|---|
| Quadrant | BADHDUFLAG | Total packets | Discarded packets |
| A | 0 | 116 | 0 |
| B | 0 | 116 | 0 |
| C | 0 | 116 | 0 |
| D | 0 | 116 | 0 |
| Mode M0 | |||
|---|---|---|---|
| Quadrant | BADHDUFLAG | Total packets | Discarded packets |
| A | 0 | 12105 | 1 |
| B | 0 | 12288 | 1 |
| C | 0 | 28625 | 1 |
| D | 0 | 36011 | 1 |
| Mode M9 | |||
|---|---|---|---|
| Quadrant | BADHDUFLAG | Total packets | Discarded packets |
| A | 0 | 12 | 0 |
| B | 0 | 12 | 0 |
| C | 0 | 12 | 0 |
| D | 0 | 12 | 0 |
| Quadrant | Total seconds | Saturated seconds | Saturation percentage |
|---|---|---|---|
| A | 5805 | 15 | 0.258398% |
| B | 5805 | 32 | 0.551249% |
| C | 5805 | 1622 | 27.941430% |
| D | 5806 | 3072 | 52.910782% |
Noise dominated data is calculated using 1-second bins in cleaned event files. If a bin has >2000 counts, and if more than 50% of those come from <1% of pixels, then it is considered to be noise-dominated and hence unusable.
| Quadrant | # 1 sec bins | Bins with >0 counts | Bins with >2000 counts | High rate bins dominated by noise | Noise dominated (total time) | Noise dominated (detector-on time) | Marked lightcurve |
|---|---|---|---|---|---|---|---|
| A | 6945 | 5806 | 1 | 1 | 0.01% | 0.02% | 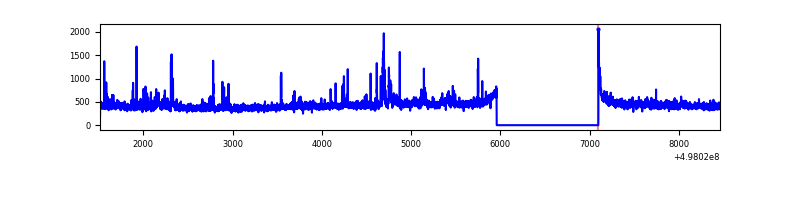 |
| B | 6945 | 5806 | 3 | 3 | 0.04% | 0.05% | 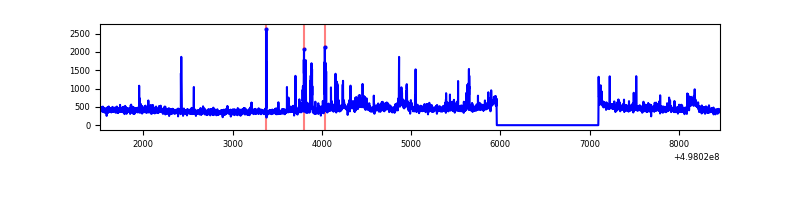 |
| C | 6945 | 5805 | 1579 | 1579 | 22.74% | 27.20% | 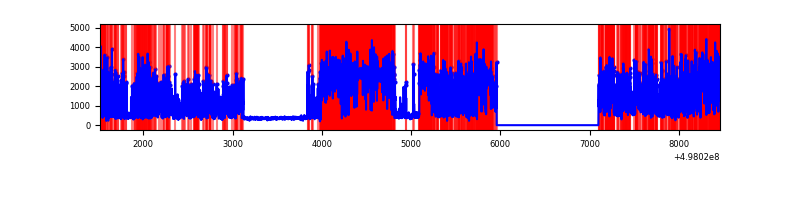 |
| D | 6946 | 5807 | 2863 | 2863 | 41.22% | 49.30% | 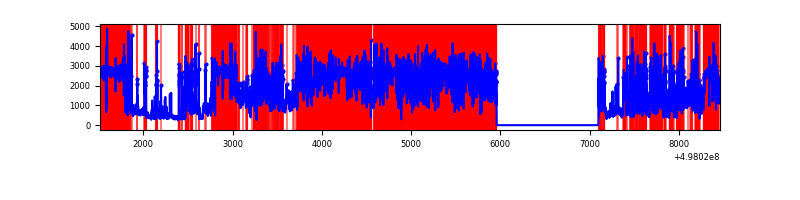 |
Top three noisy pixels from each quadrant. If the there are fewer than three noisy pixels in the level2.evt file, extra rows are filled as -1
| Pixel properties | Quadrant properties | ||||||
|---|---|---|---|---|---|---|---|
| Quadrant | DetID | PixID | Counts | Sigma | Mean | Median | Sigma |
| A | 15 | 174 | 84860 | 562.31 | 607 | 594 | 149.9 |
| A | 7 | 29 | 33661 | 220.66 | 607 | 594 | 149.9 |
| A | 4 | 3 | 28669 | 187.35 | 607 | 594 | 149.9 |
| B | 7 | 0 | 80391 | 614.09 | 602 | 579 | 130.0 |
| B | 10 | 247 | 69211 | 528.07 | 602 | 579 | 130.0 |
| B | 0 | 171 | 36213 | 274.17 | 602 | 579 | 130.0 |
| C | 1 | 16 | 3442483 | 24235.36 | 513 | 506 | 142.0 |
| C | 1 | 241 | 2272094 | 15994.51 | 513 | 506 | 142.0 |
| C | 13 | 3 | 219816 | 1544.19 | 513 | 506 | 142.0 |
| D | 8 | 176 | 7492587 | 61723.95 | 420 | 399 | 121.4 |
| D | 3 | 12 | 861636 | 7095.25 | 420 | 399 | 121.4 |
| D | 15 | 108 | 468840 | 3859.22 | 420 | 399 | 121.4 |
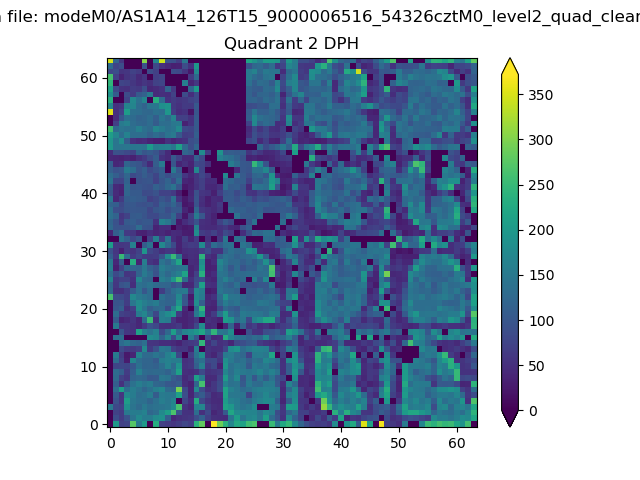
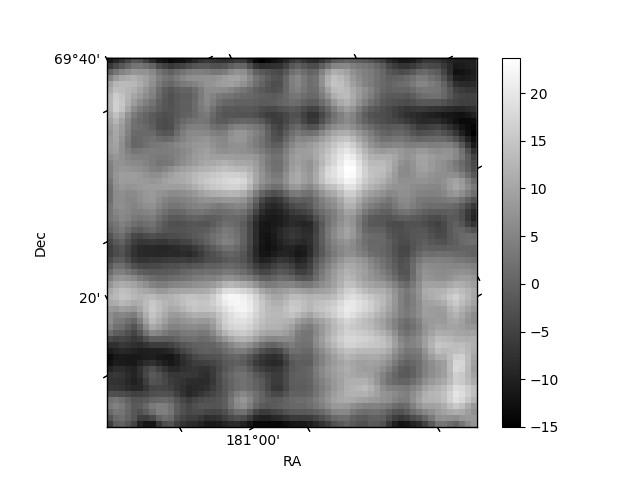
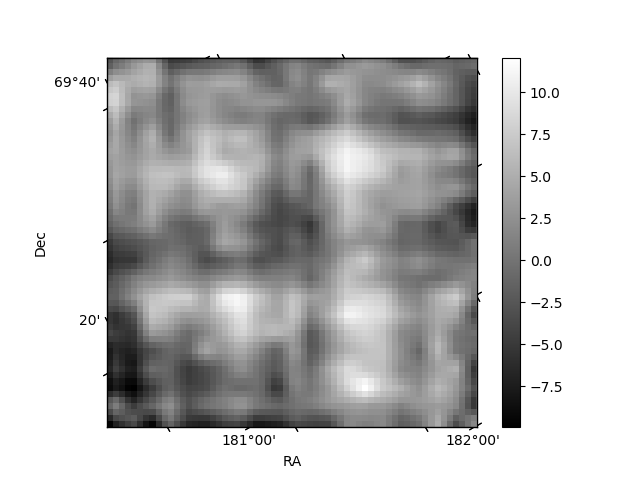
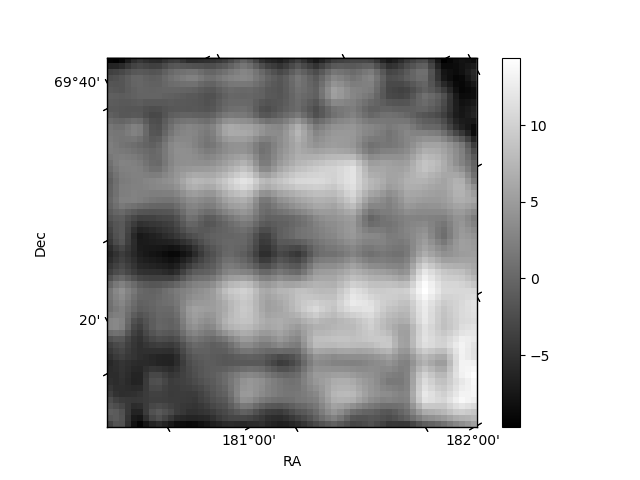
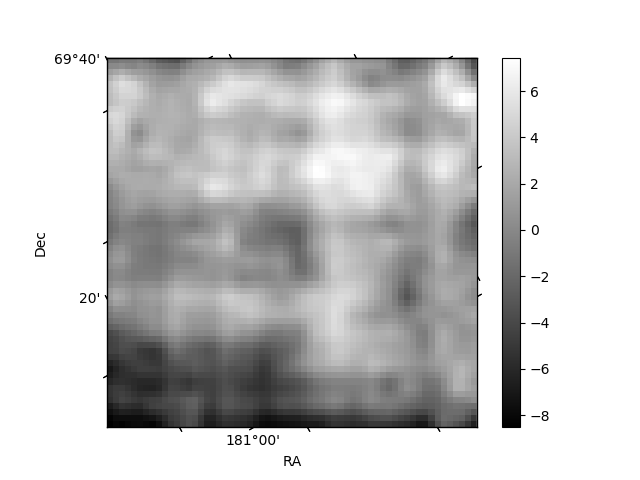
Histogram calculated using DETX and DETY for each event in the final _common_clean file
| Quadrant A | 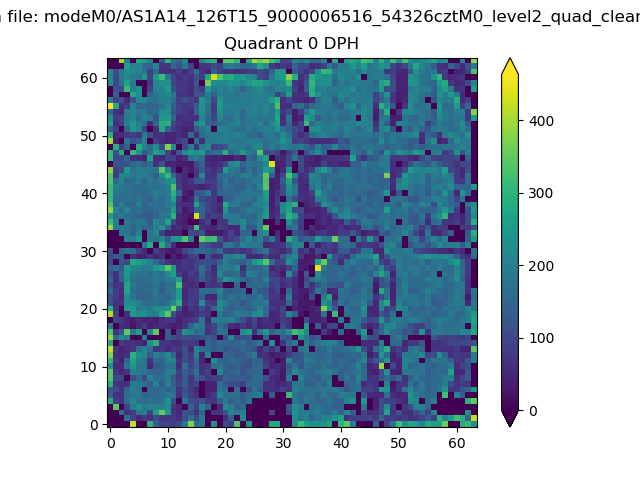 |
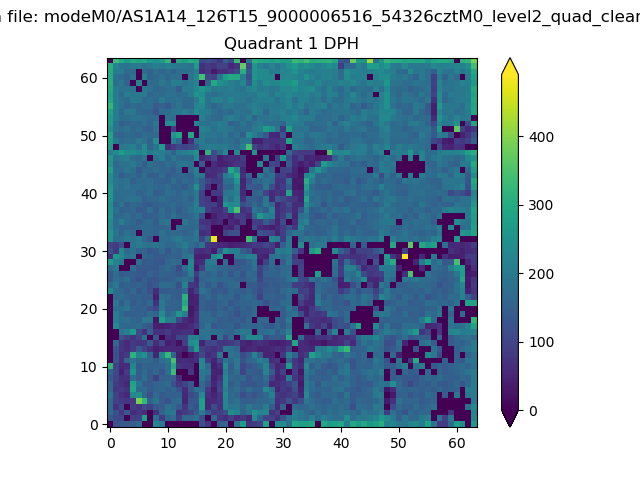 |
Quadrant B |
|---|---|---|---|
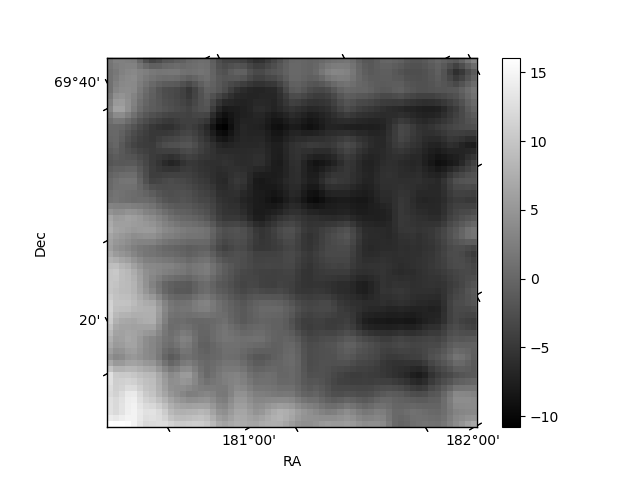
| Quadrant D | 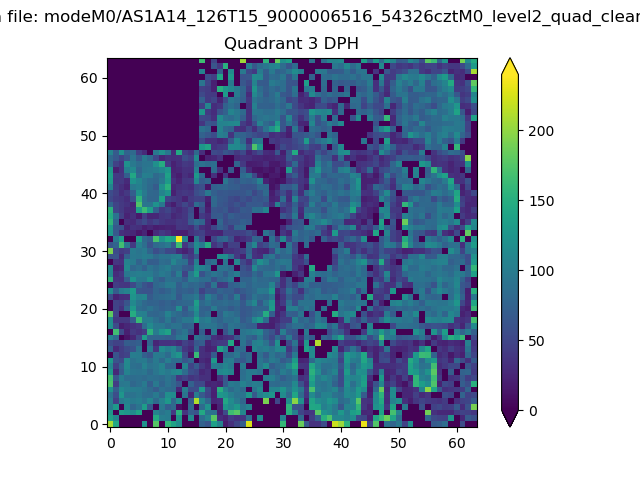 |
 |
Quadrant C |
| Plot type | Count rate plots | Images |
|---|---|---|
| Comparison with Poisson distribution Blue bars denote a histogram of data divided into 1 sec bins. Red curve is a Poisson curve with rate = median count rate of data. |
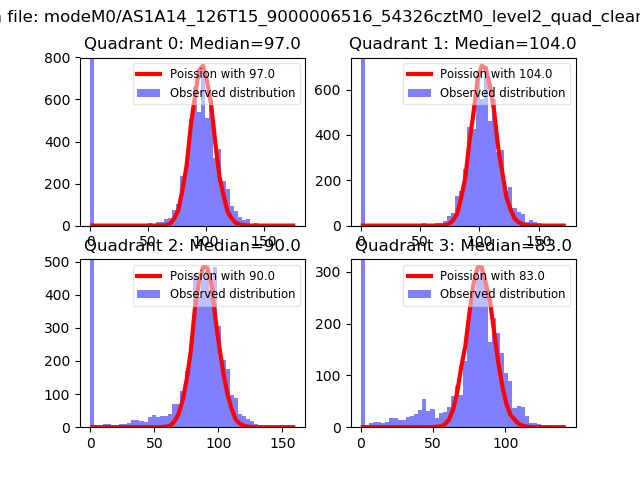 |
 |
| Quadrant-wise count rates Data is divided into 100 sec bins |
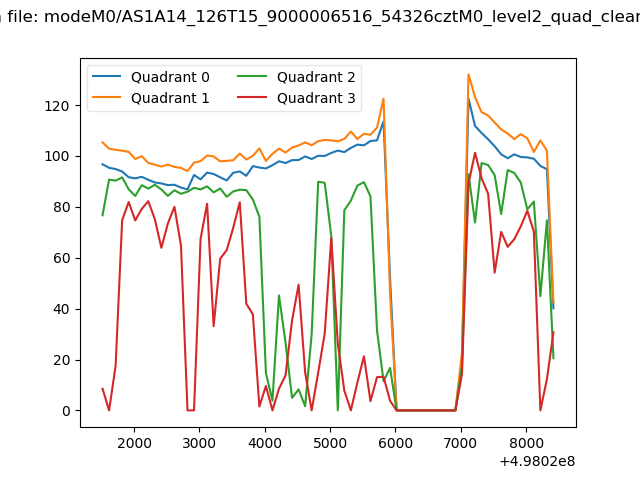 |
|
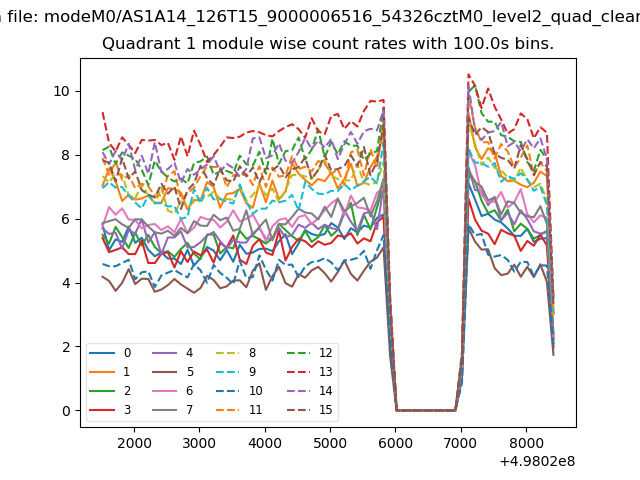
| Module-wise count rates for Quadrant A Data is divided into 100 sec bins |
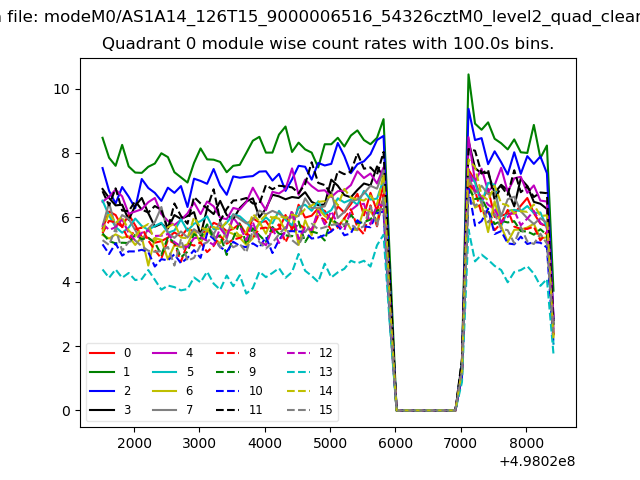 |
 |
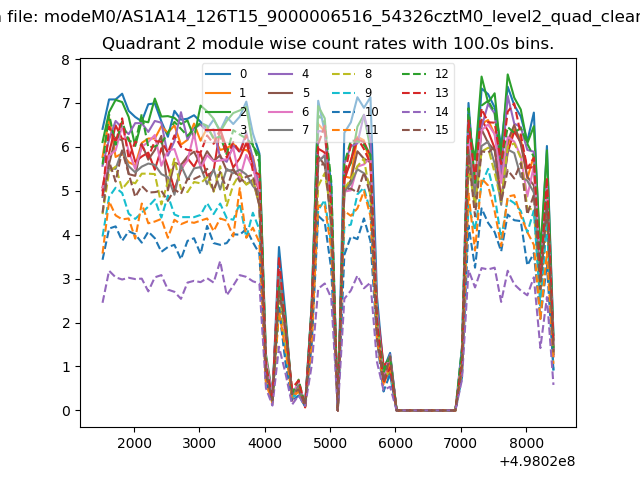
| Module-wise count rates for Quadrant B Data is divided into 100 sec bins |
 |
 |
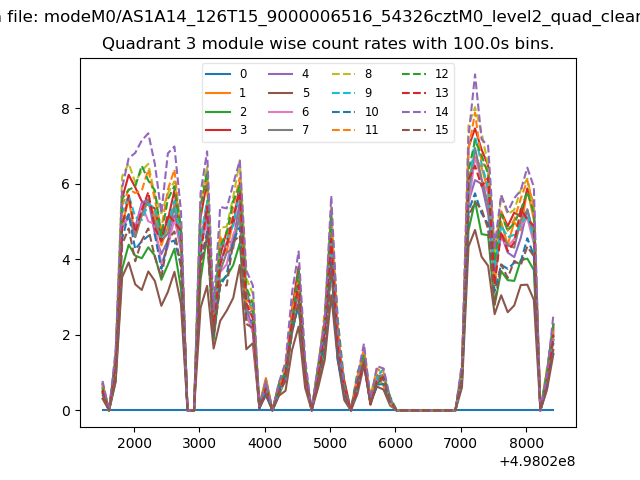
| Module-wise count rates for Quadrant C Data is divided into 100 sec bins |
 |
 |
| Module-wise count rates for Quadrant D Data is divided into 100 sec bins |
 |
 |
| Parameter | Plot |
|---|---|
| CZT HV Monitor | 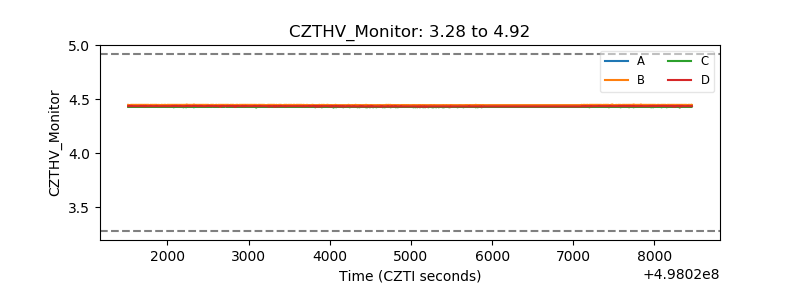 |
| D_VDD | 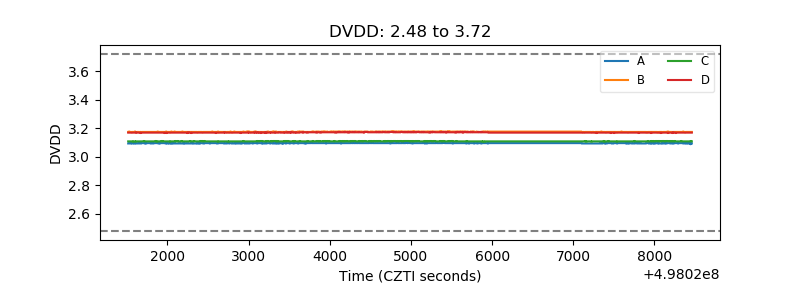 |
| Temperature 1 | 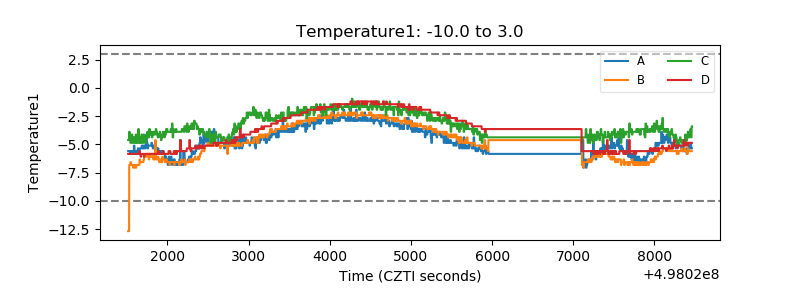 |
| Veto HV Monitor | 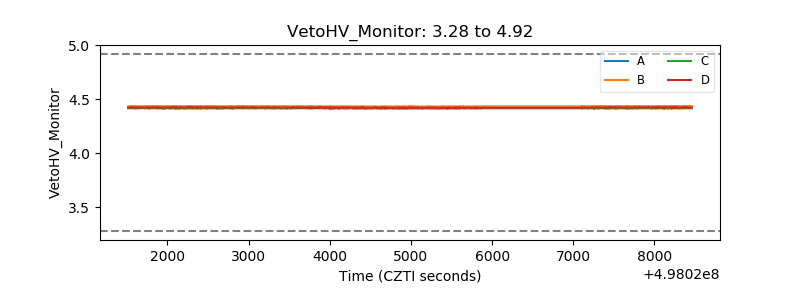 |
| Veto LLD | 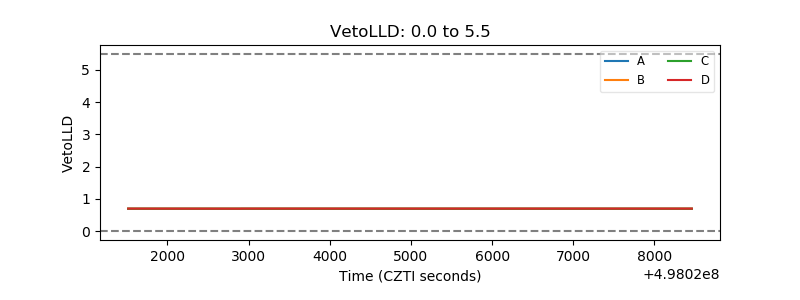 |
| Alpha Counter | 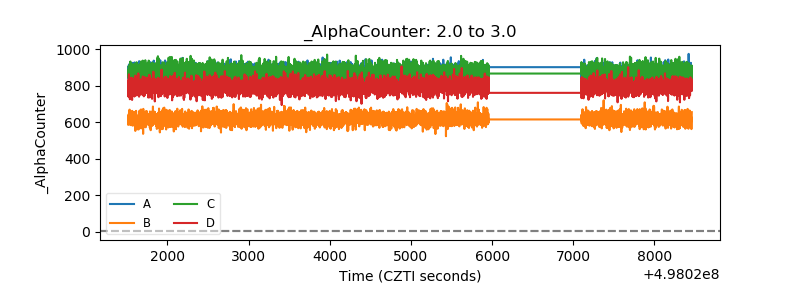 |
| _CPM_Rate | 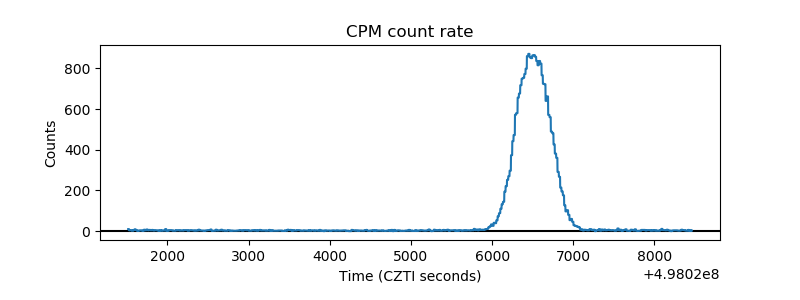 |
| CZT Counter | 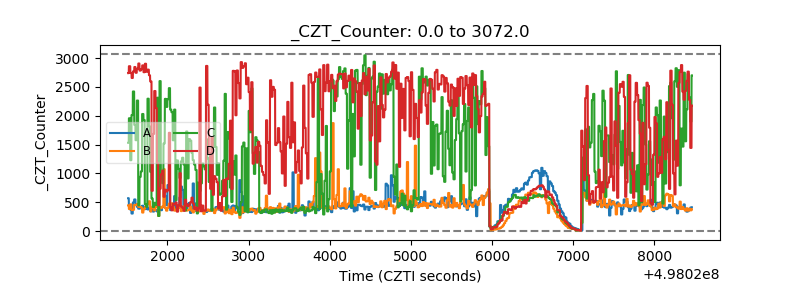 |
| +2.5 Volts monitor |  |
| +5 Volts monitor | 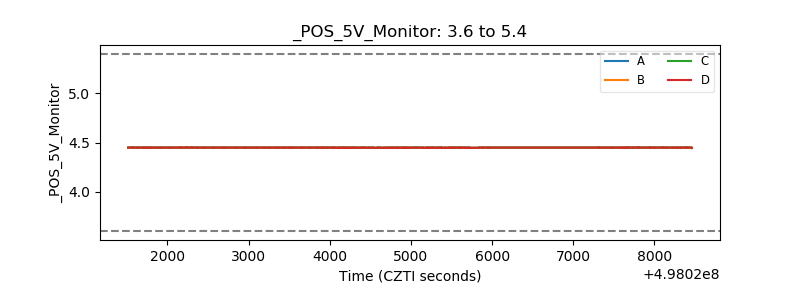 |
| _ROLL_ROT | 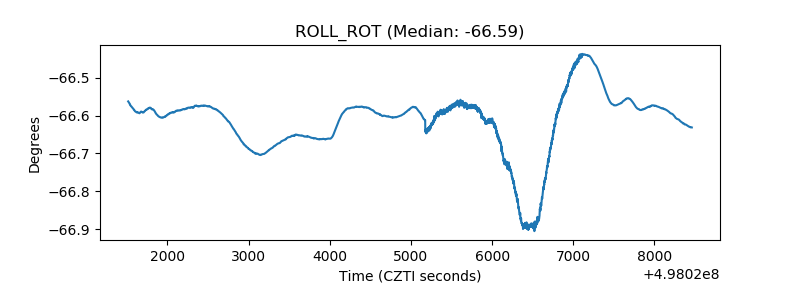 |
| _Roll_DEC | 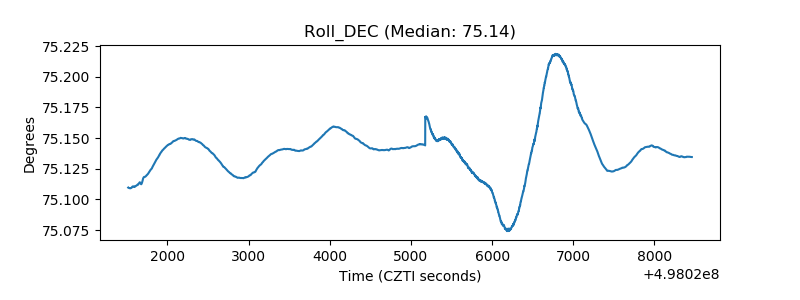 |
| _Roll_RA | 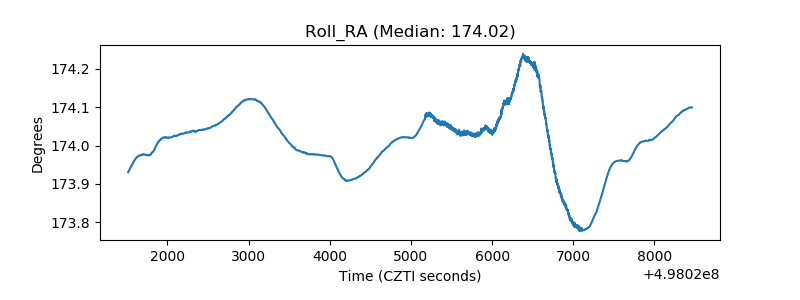 |
| Veto Counter | 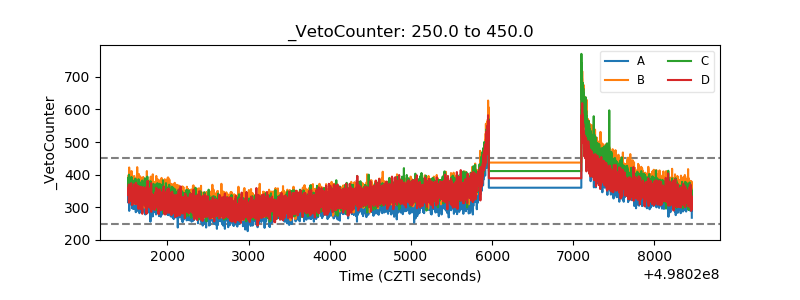 |