| Param | Original file | Final file |
|---|---|---|
| Filename | modeM0/AS1A14_126T15_9000006516_54330cztM0_level2.fits | modeM0/AS1A14_126T15_9000006516_54330cztM0_level2_quad_clean.evt |
| Size (bytes) | 536,221,440 | 96,073,920 |
| Size | 511.4 MB | 91.6 MB |
| Events in quadrant A | 3,193,225 | 667,617 |
| Events in quadrant B | 3,228,873 | 708,755 |
| Events in quadrant C | 7,116,768 | 491,670 |
| Events in quadrant D | 5,771,555 | 557,777 |
| Mode SS | |||
|---|---|---|---|
| Quadrant | BADHDUFLAG | Total packets | Discarded packets |
| A | 0 | 142 | 0 |
| B | 0 | 142 | 0 |
| C | 0 | 142 | 0 |
| D | 0 | 142 | 0 |
| Mode M0 | |||
|---|---|---|---|
| Quadrant | BADHDUFLAG | Total packets | Discarded packets |
| A | 0 | 14683 | 1 |
| B | 0 | 14724 | 1 |
| C | 0 | 26353 | 1 |
| D | 0 | 22120 | 1 |
| Mode M9 | |||
|---|---|---|---|
| Quadrant | BADHDUFLAG | Total packets | Discarded packets |
| A | 0 | 6 | 0 |
| B | 0 | 6 | 0 |
| C | 0 | 6 | 0 |
| D | 0 | 6 | 0 |
| Quadrant | Total seconds | Saturated seconds | Saturation percentage |
|---|---|---|---|
| A | 6929 | 91 | 1.313321% |
| B | 6929 | 88 | 1.270025% |
| C | 6930 | 1577 | 22.756133% |
| D | 6930 | 544 | 7.849928% |
Noise dominated data is calculated using 1-second bins in cleaned event files. If a bin has >2000 counts, and if more than 50% of those come from <1% of pixels, then it is considered to be noise-dominated and hence unusable.
| Quadrant | # 1 sec bins | Bins with >0 counts | Bins with >2000 counts | High rate bins dominated by noise | Noise dominated (total time) | Noise dominated (detector-on time) | Marked lightcurve |
|---|---|---|---|---|---|---|---|
| A | 7594 | 6930 | 11 | 11 | 0.14% | 0.16% | 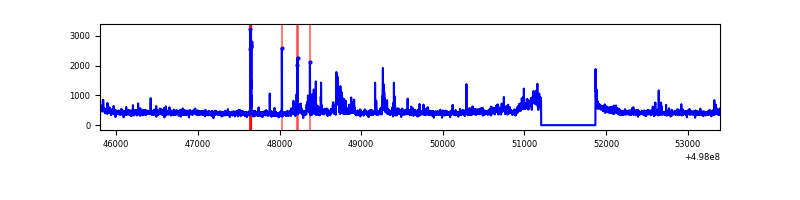 |
| B | 7594 | 6930 | 19 | 19 | 0.25% | 0.27% | 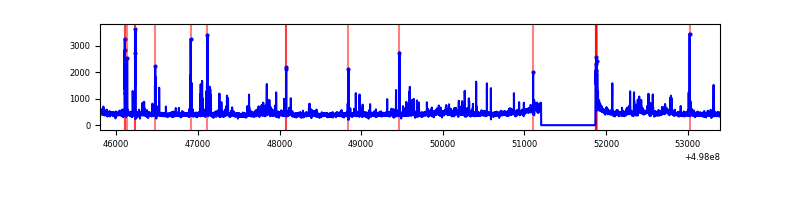 |
| C | 7595 | 6931 | 1539 | 1539 | 20.26% | 22.20% | 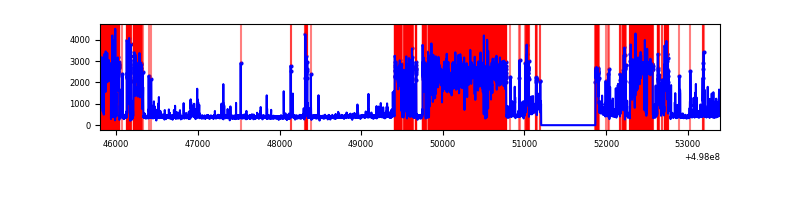 |
| D | 7595 | 6931 | 492 | 492 | 6.48% | 7.10% | 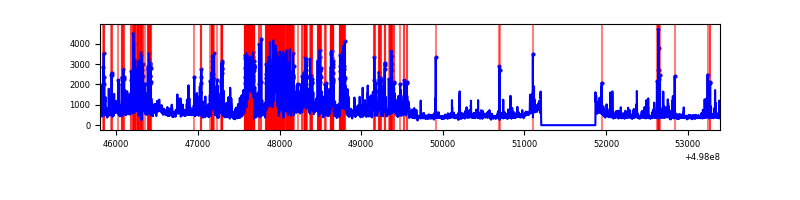 |
Top three noisy pixels from each quadrant. If the there are fewer than three noisy pixels in the level2.evt file, extra rows are filled as -1
| Pixel properties | Quadrant properties | ||||||
|---|---|---|---|---|---|---|---|
| Quadrant | DetID | PixID | Counts | Sigma | Mean | Median | Sigma |
| A | 15 | 174 | 102560 | 562.19 | 734 | 714 | 181.2 |
| A | 5 | 243 | 77296 | 422.73 | 734 | 714 | 181.2 |
| A | 4 | 78 | 71307 | 389.67 | 734 | 714 | 181.2 |
| B | 5 | 172 | 65073 | 416.82 | 718 | 690 | 154.5 |
| B | 1 | 223 | 59247 | 379.11 | 718 | 690 | 154.5 |
| B | 10 | 247 | 46721 | 298.01 | 718 | 690 | 154.5 |
| C | 1 | 241 | 4119187 | 23303.59 | 642 | 634 | 176.7 |
| C | 12 | 252 | 126345 | 711.29 | 642 | 634 | 176.7 |
| C | 14 | 254 | 124766 | 702.36 | 642 | 634 | 176.7 |
| D | 15 | 108 | 1854675 | 9439.41 | 688 | 656 | 196.4 |
| D | 8 | 176 | 602954 | 3066.49 | 688 | 656 | 196.4 |
| D | 2 | 120 | 156277 | 792.32 | 688 | 656 | 196.4 |
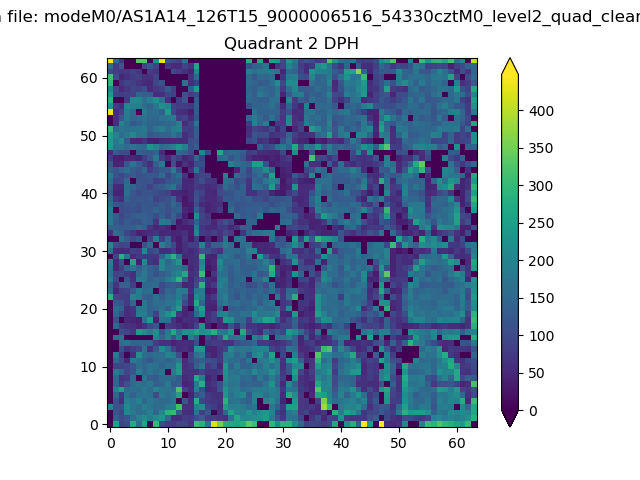
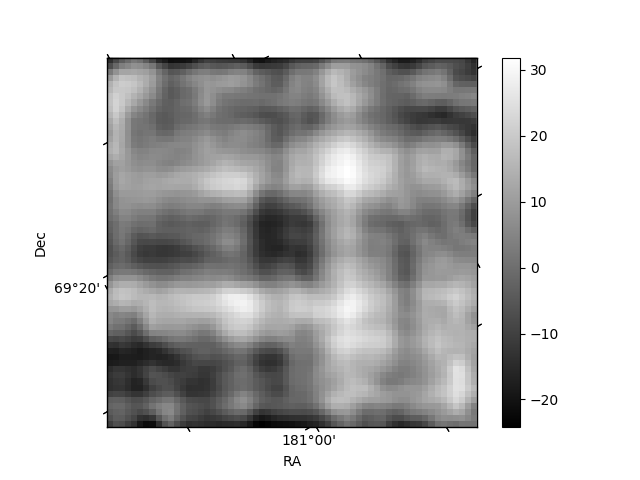
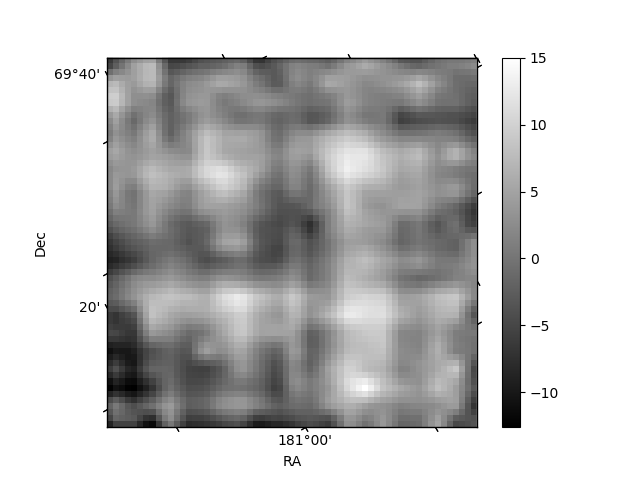
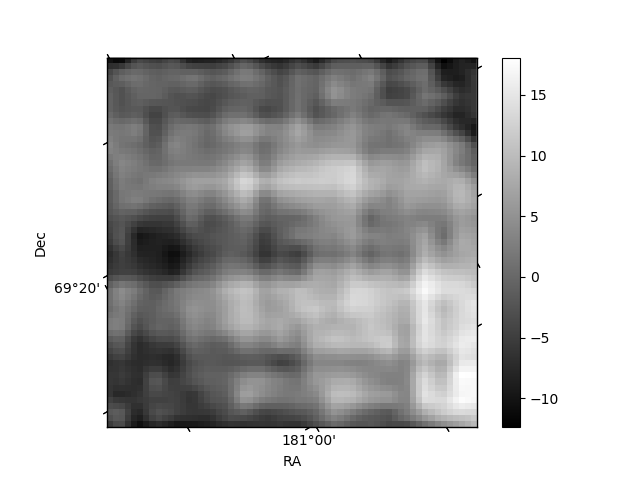
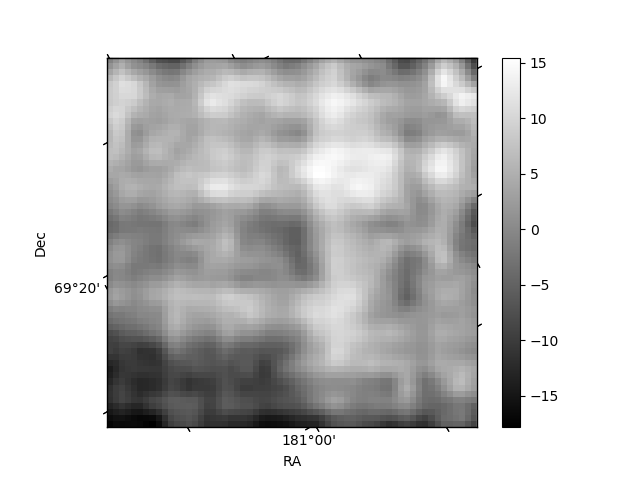
Histogram calculated using DETX and DETY for each event in the final _common_clean file
| Quadrant A | 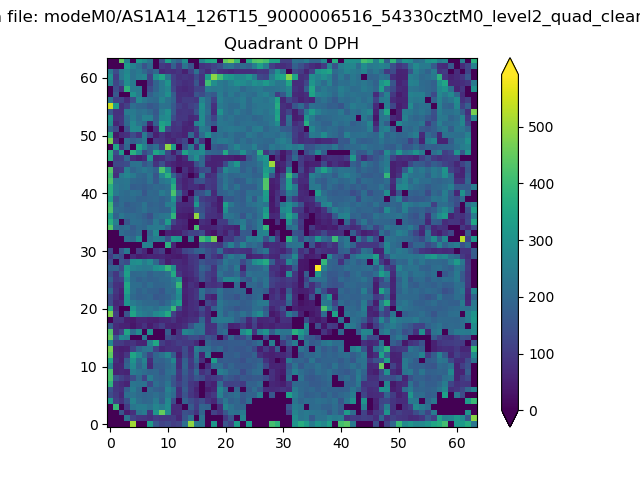 |
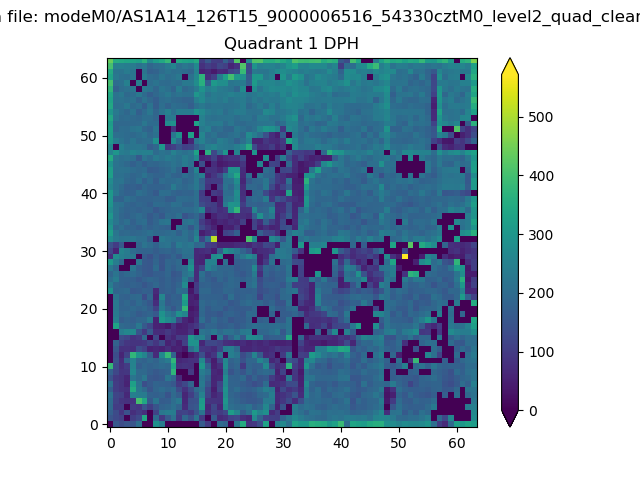 |
Quadrant B |
|---|---|---|---|
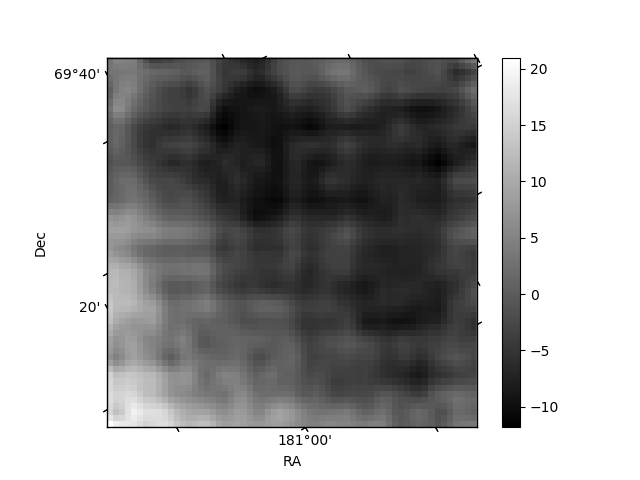
| Quadrant D | 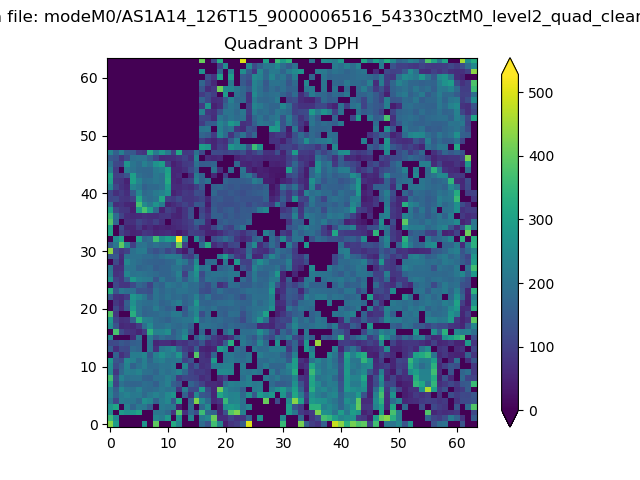 |
 |
Quadrant C |
| Plot type | Count rate plots | Images |
|---|---|---|
| Comparison with Poisson distribution Blue bars denote a histogram of data divided into 1 sec bins. Red curve is a Poisson curve with rate = median count rate of data. |
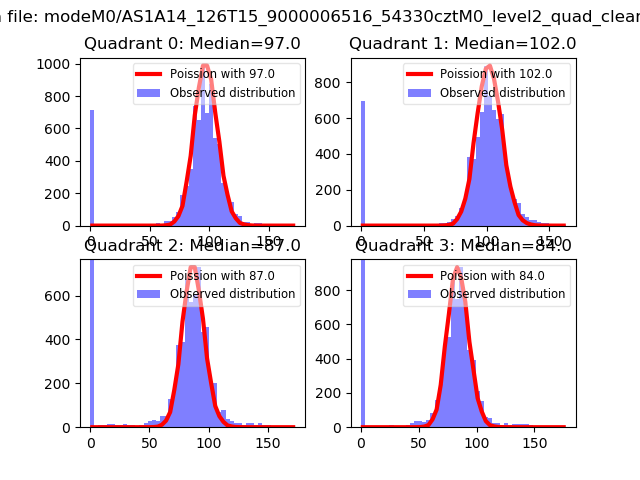 |
 |
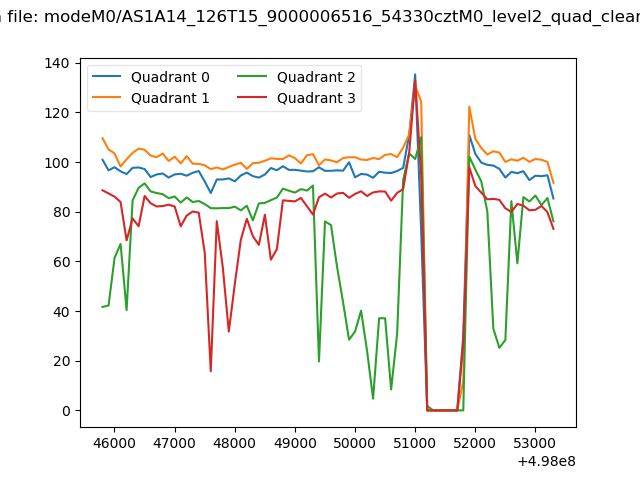
| Quadrant-wise count rates Data is divided into 100 sec bins |
 |
|
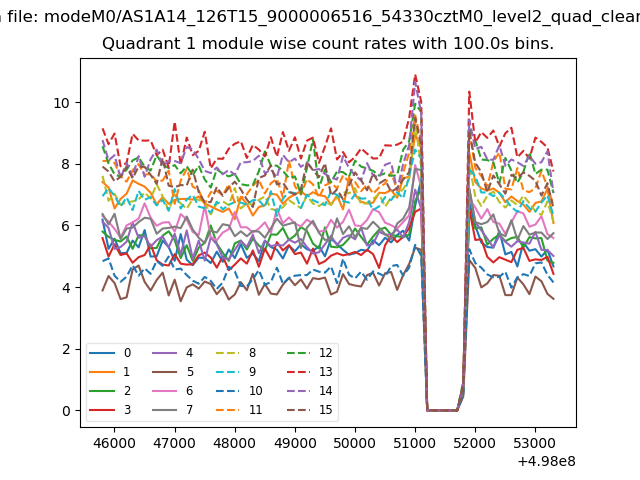
| Module-wise count rates for Quadrant A Data is divided into 100 sec bins |
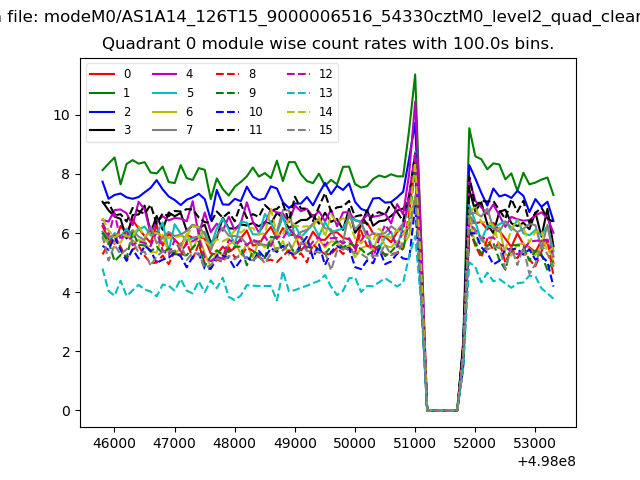 |
 |
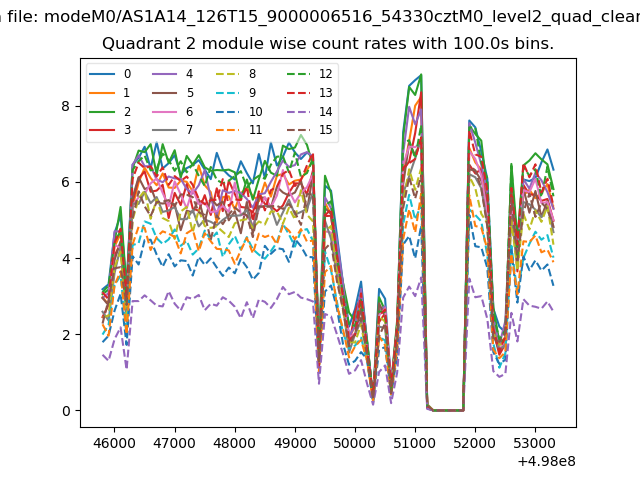
| Module-wise count rates for Quadrant B Data is divided into 100 sec bins |
 |
 |
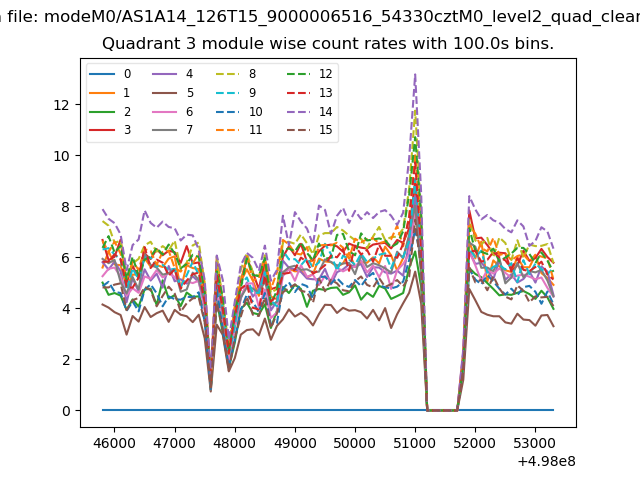
| Module-wise count rates for Quadrant C Data is divided into 100 sec bins |
 |
 |
| Module-wise count rates for Quadrant D Data is divided into 100 sec bins |
 |
 |
| Parameter | Plot |
|---|---|
| CZT HV Monitor | 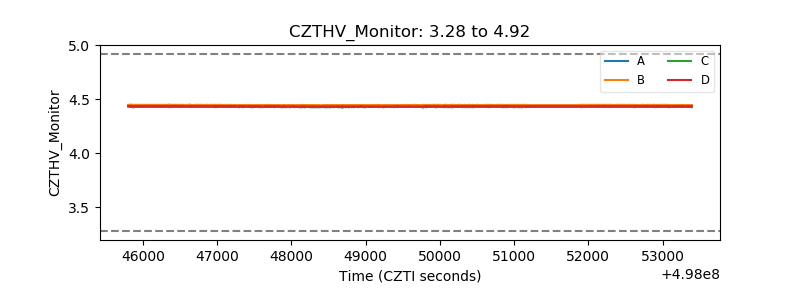 |
| D_VDD | 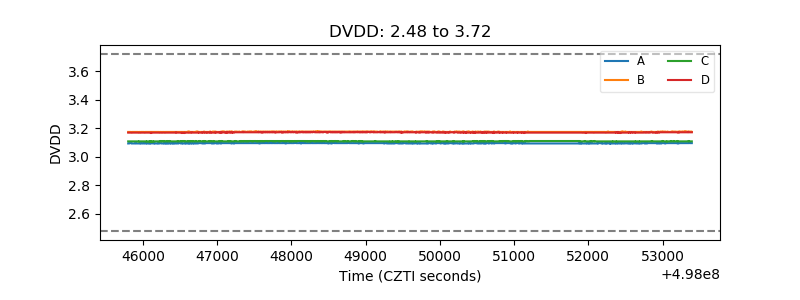 |
| Temperature 1 | 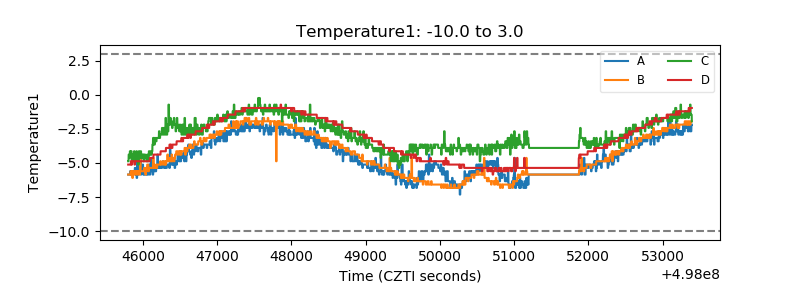 |
| Veto HV Monitor | 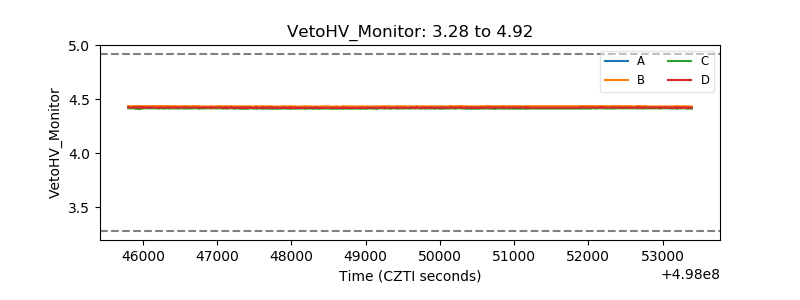 |
| Veto LLD | 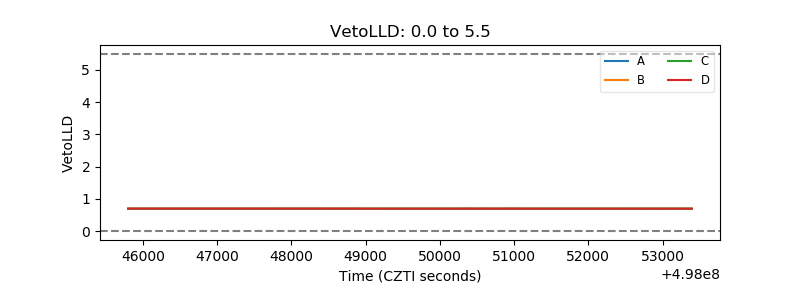 |
| Alpha Counter | 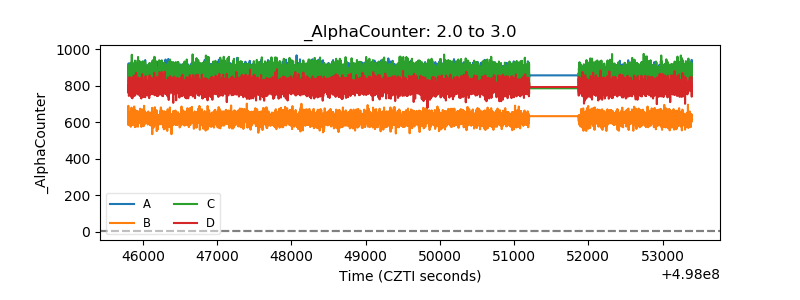 |
| _CPM_Rate | 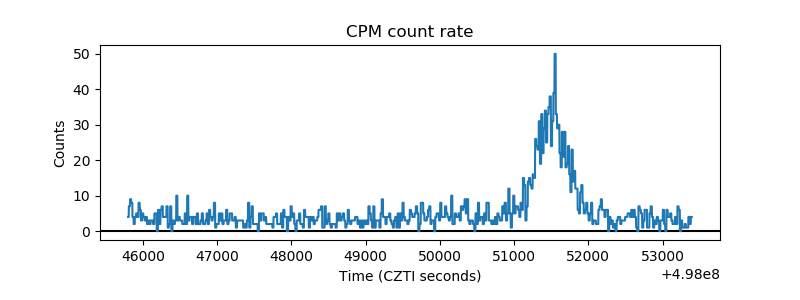 |
| CZT Counter | 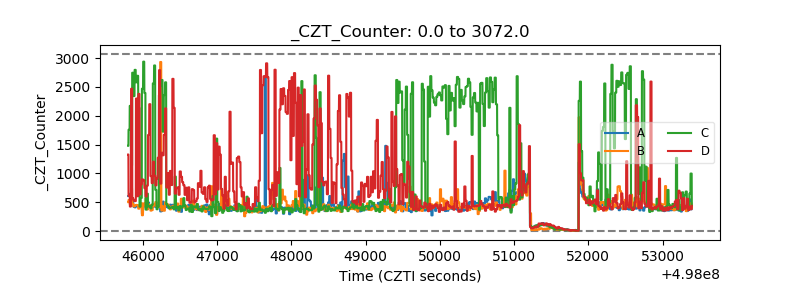 |
| +2.5 Volts monitor |  |
| +5 Volts monitor |  |
| _ROLL_ROT | 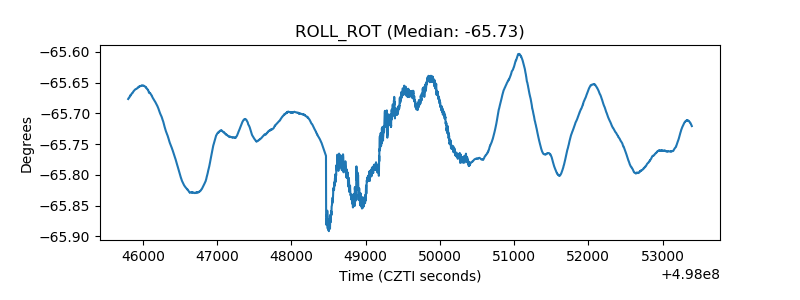 |
| _Roll_DEC | 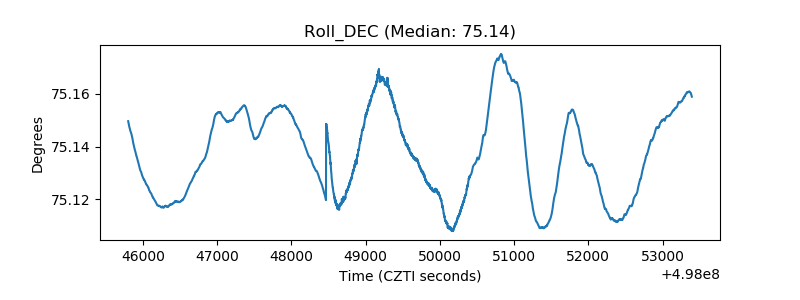 |
| _Roll_RA | 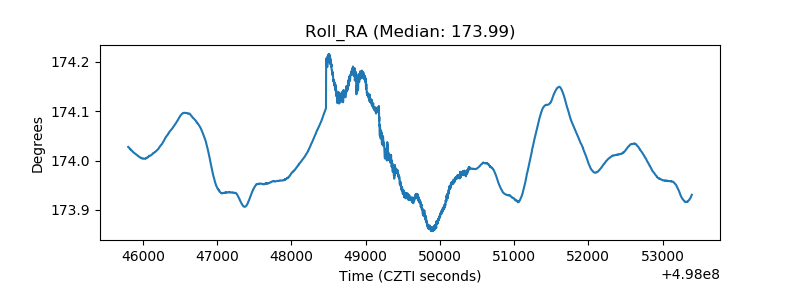 |
| Veto Counter | 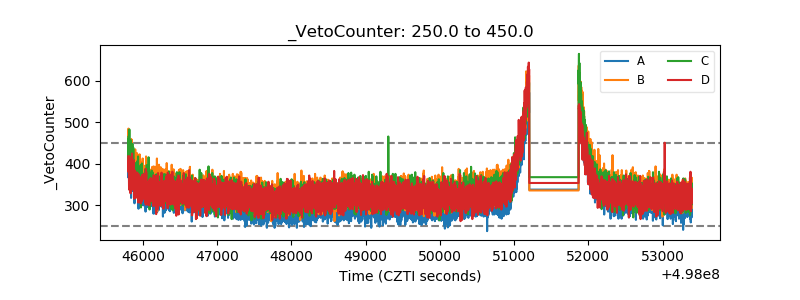 |