| Param | Original file | Final file |
|---|---|---|
| Filename | modeM0/AS1A14_126T15_9000006516_54331cztM0_level2.fits | modeM0/AS1A14_126T15_9000006516_54331cztM0_level2_quad_clean.evt |
| Size (bytes) | 715,703,040 | 91,578,240 |
| Size | 682.5 MB | 87.3 MB |
| Events in quadrant A | 3,710,037 | 683,660 |
| Events in quadrant B | 4,493,166 | 690,869 |
| Events in quadrant C | 6,764,241 | 518,803 |
| Events in quadrant D | 10,971,345 | 381,957 |
| Mode SS | |||
|---|---|---|---|
| Quadrant | BADHDUFLAG | Total packets | Discarded packets |
| A | 0 | 144 | 0 |
| B | 0 | 144 | 0 |
| C | 0 | 144 | 0 |
| D | 0 | 144 | 0 |
| Mode M0 | |||
|---|---|---|---|
| Quadrant | BADHDUFLAG | Total packets | Discarded packets |
| A | 0 | 16211 | 0 |
| B | 0 | 18615 | 0 |
| C | 0 | 25409 | 0 |
| D | 0 | 37416 | 0 |
| Quadrant | Total seconds | Saturated seconds | Saturation percentage |
|---|---|---|---|
| A | 7139 | 60 | 0.840454% |
| B | 7139 | 456 | 6.387449% |
| C | 7140 | 1363 | 19.089636% |
| D | 7140 | 2842 | 39.803922% |
Noise dominated data is calculated using 1-second bins in cleaned event files. If a bin has >2000 counts, and if more than 50% of those come from <1% of pixels, then it is considered to be noise-dominated and hence unusable.
| Quadrant | # 1 sec bins | Bins with >0 counts | Bins with >2000 counts | High rate bins dominated by noise | Noise dominated (total time) | Noise dominated (detector-on time) | Marked lightcurve |
|---|---|---|---|---|---|---|---|
| A | 7139 | 7139 | 26 | 26 | 0.36% | 0.36% | 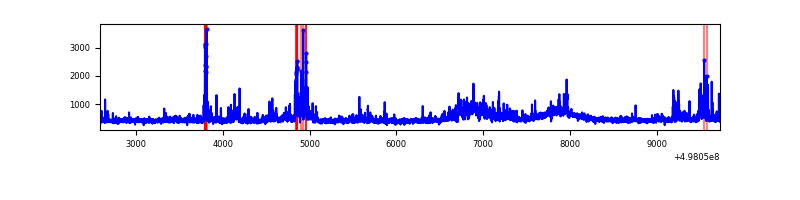 |
| B | 7139 | 7139 | 292 | 292 | 4.09% | 4.09% | 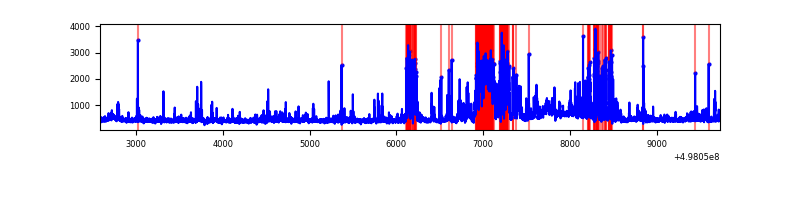 |
| C | 7139 | 7139 | 1235 | 1235 | 17.30% | 17.30% | 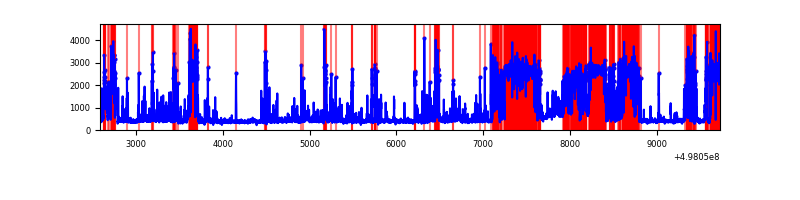 |
| D | 7140 | 7140 | 2782 | 2782 | 38.96% | 38.96% | 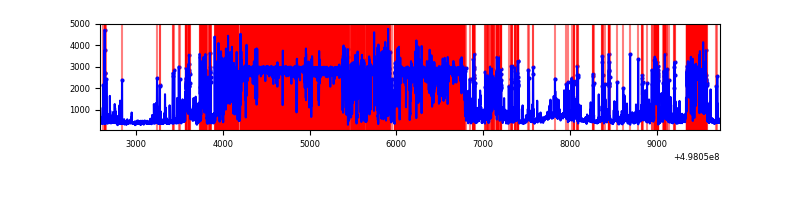 |
Top three noisy pixels from each quadrant. If the there are fewer than three noisy pixels in the level2.evt file, extra rows are filled as -1
| Pixel properties | Quadrant properties | ||||||
|---|---|---|---|---|---|---|---|
| Quadrant | DetID | PixID | Counts | Sigma | Mean | Median | Sigma |
| A | 5 | 243 | 472555 | 2533.7 | 758 | 740 | 186.2 |
| A | 15 | 174 | 135740 | 724.97 | 758 | 740 | 186.2 |
| A | 4 | 78 | 56917 | 301.68 | 758 | 740 | 186.2 |
| B | 5 | 185 | 1226975 | 7891.35 | 728 | 701 | 155.4 |
| B | 0 | 171 | 62260 | 396.15 | 728 | 701 | 155.4 |
| B | 4 | 216 | 52305 | 332.08 | 728 | 701 | 155.4 |
| C | 1 | 241 | 3468097 | 19156.3 | 664 | 656 | 181.0 |
| C | 12 | 2 | 299834 | 1652.85 | 664 | 656 | 181.0 |
| C | 14 | 254 | 141213 | 776.52 | 664 | 656 | 181.0 |
| D | 15 | 108 | 7912842 | 49163.91 | 569 | 543 | 160.9 |
| D | 8 | 176 | 362188 | 2247.12 | 569 | 543 | 160.9 |
| D | 3 | 12 | 117645 | 727.63 | 569 | 543 | 160.9 |
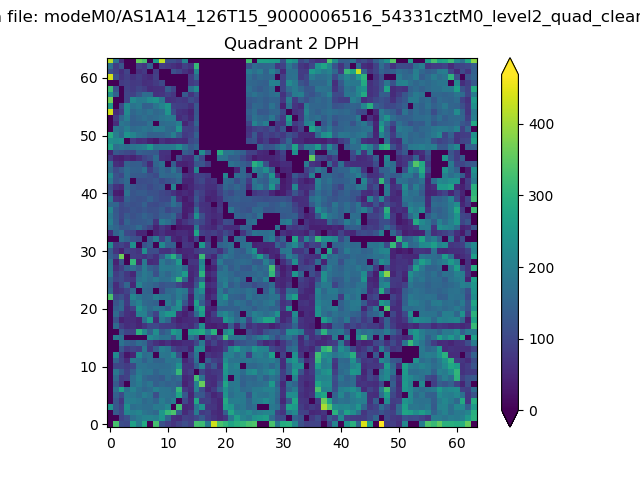
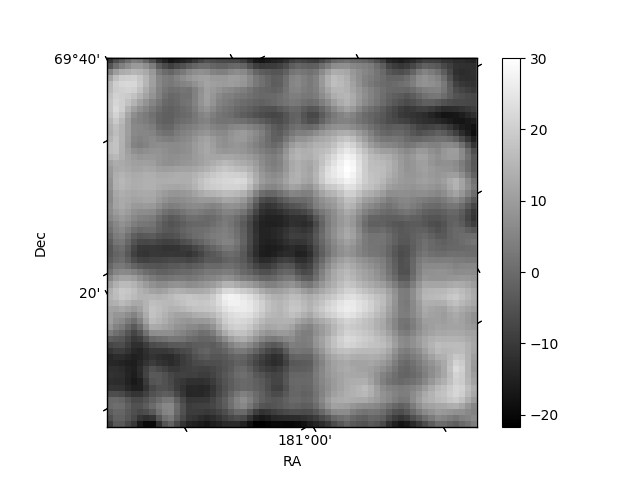
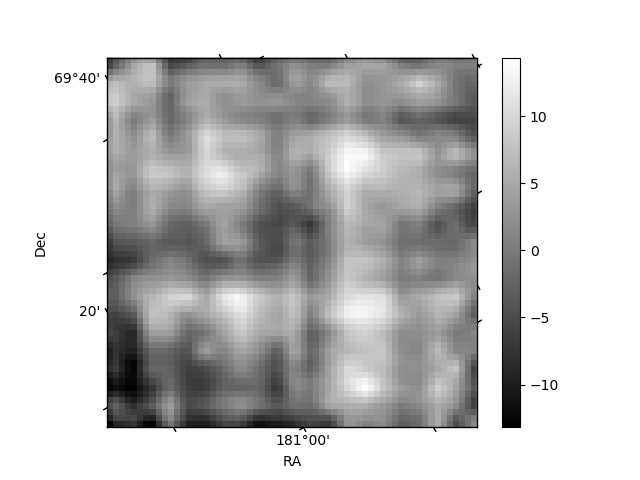
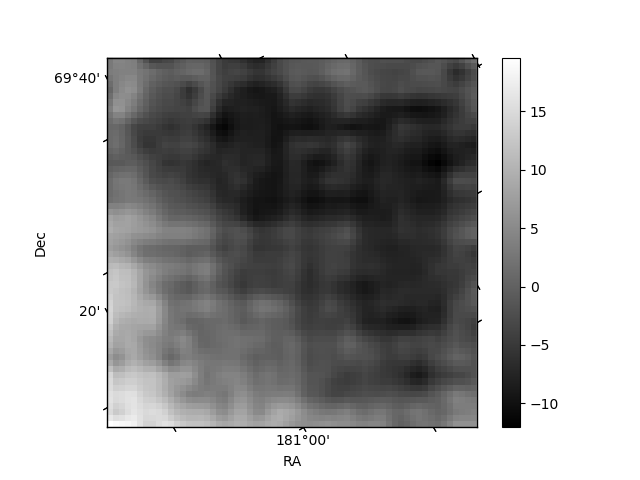
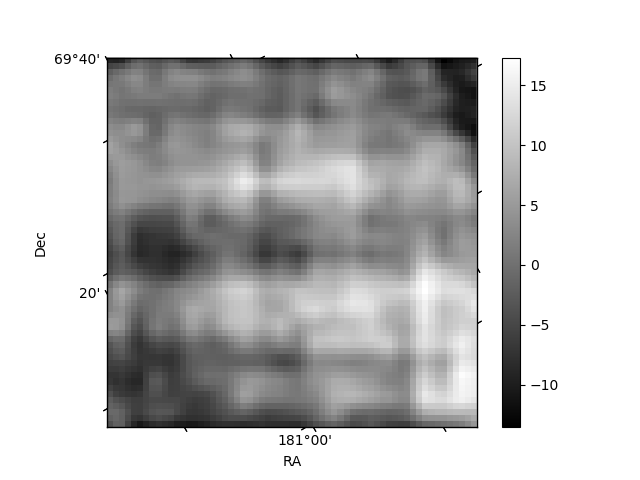
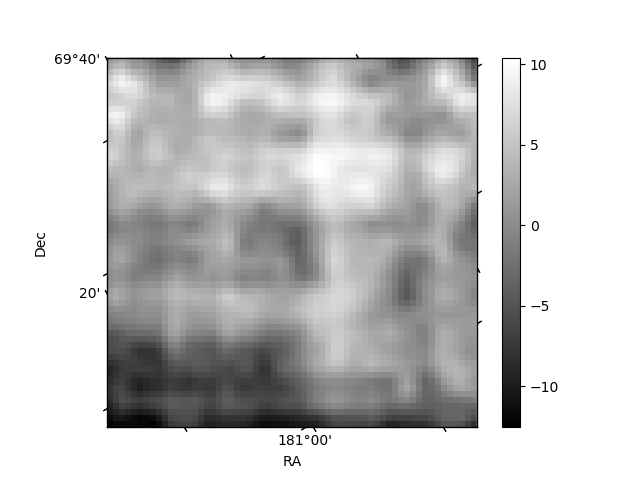
Histogram calculated using DETX and DETY for each event in the final _common_clean file
| Quadrant A | 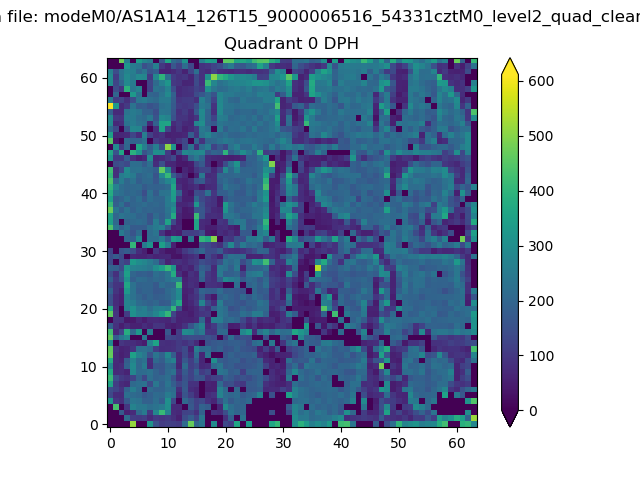 |
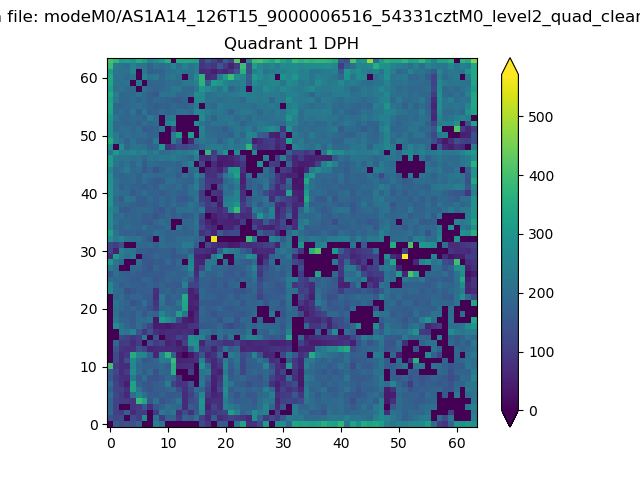 |
Quadrant B |
|---|---|---|---|
| Quadrant D | 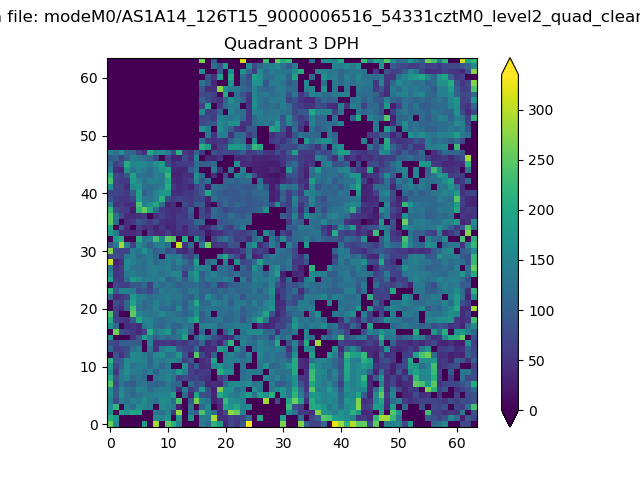 |
 |
Quadrant C |
| Plot type | Count rate plots | Images |
|---|---|---|
| Comparison with Poisson distribution Blue bars denote a histogram of data divided into 1 sec bins. Red curve is a Poisson curve with rate = median count rate of data. |
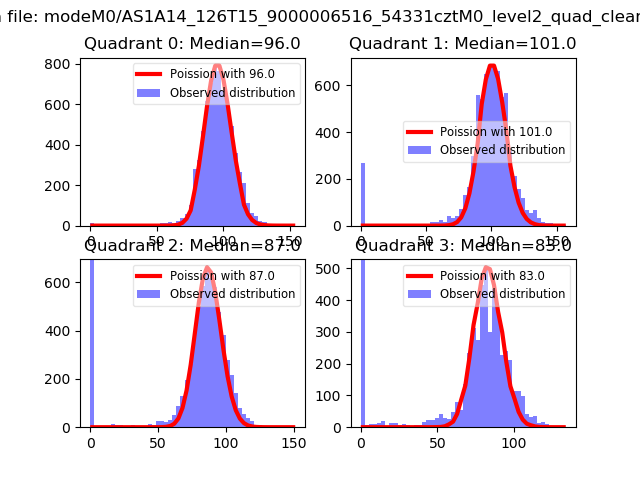 |
 |
| Quadrant-wise count rates Data is divided into 100 sec bins |
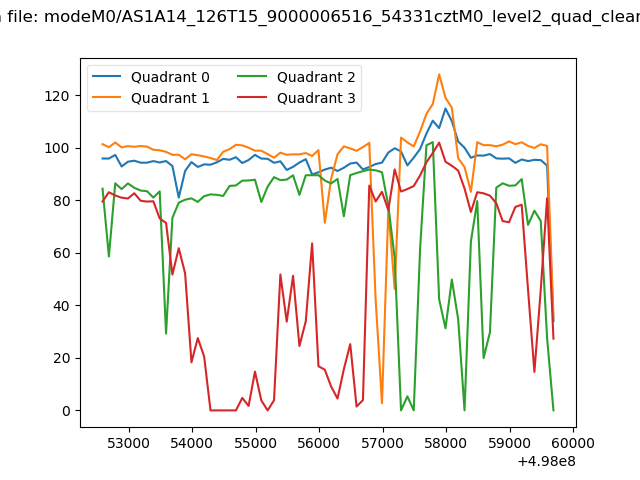 |
|
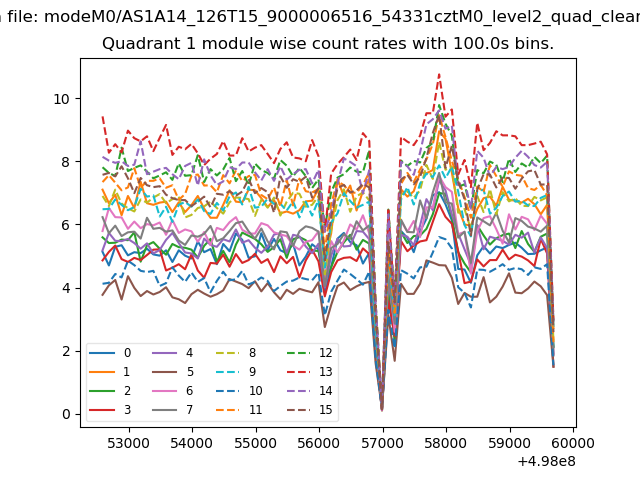
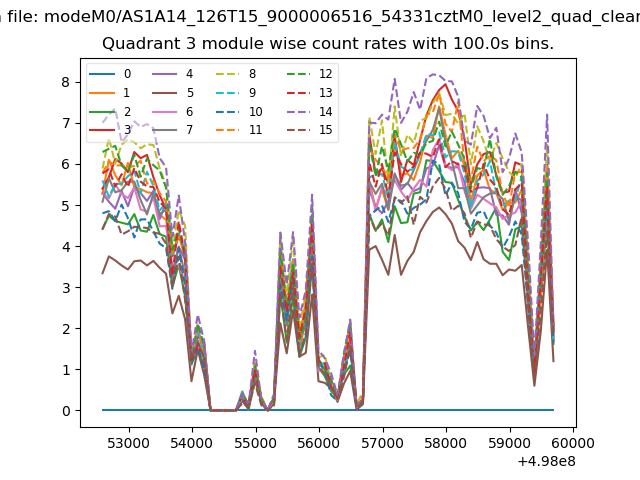
| Module-wise count rates for Quadrant A Data is divided into 100 sec bins |
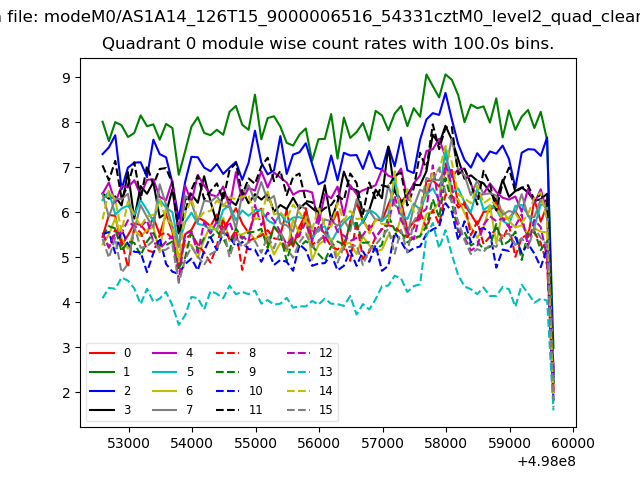 |
 |
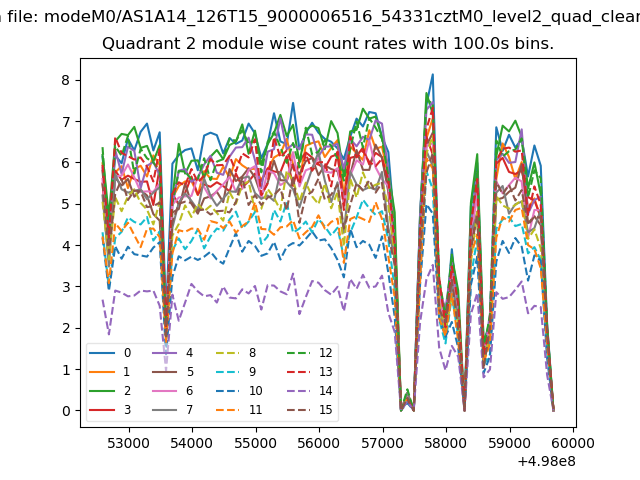
| Module-wise count rates for Quadrant B Data is divided into 100 sec bins |
 |
 |
| Module-wise count rates for Quadrant C Data is divided into 100 sec bins |
 |
 |
| Module-wise count rates for Quadrant D Data is divided into 100 sec bins |
 |
 |
| Parameter | Plot |
|---|---|
| CZT HV Monitor | 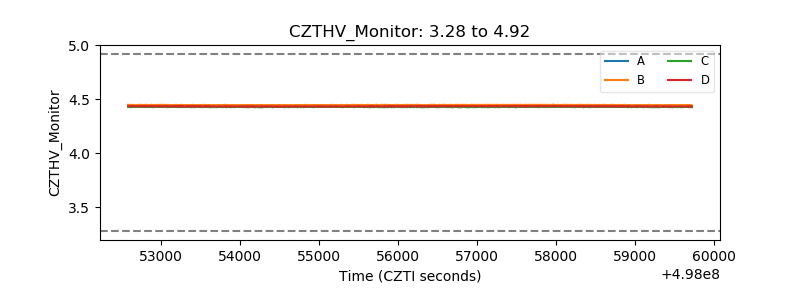 |
| D_VDD | 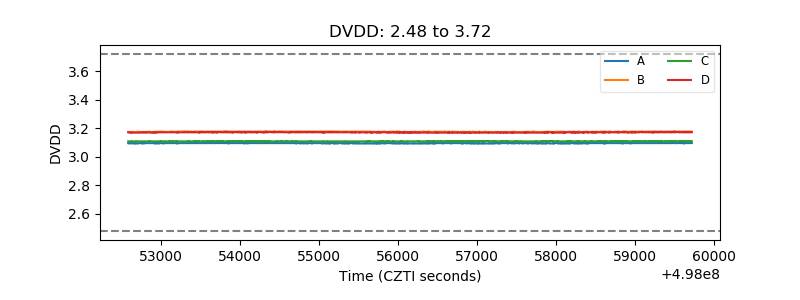 |
| Temperature 1 | 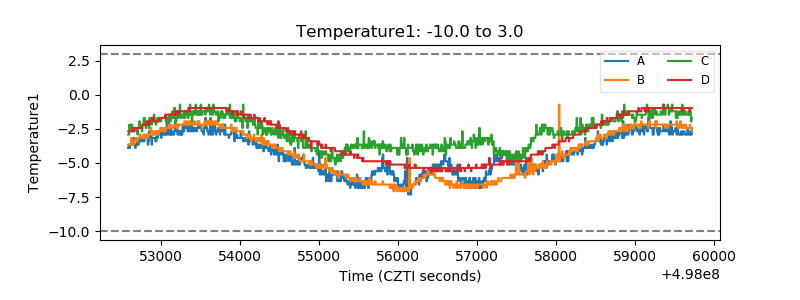 |
| Veto HV Monitor | 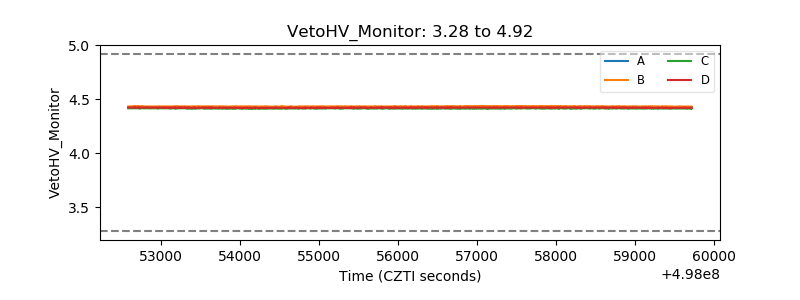 |
| Veto LLD | 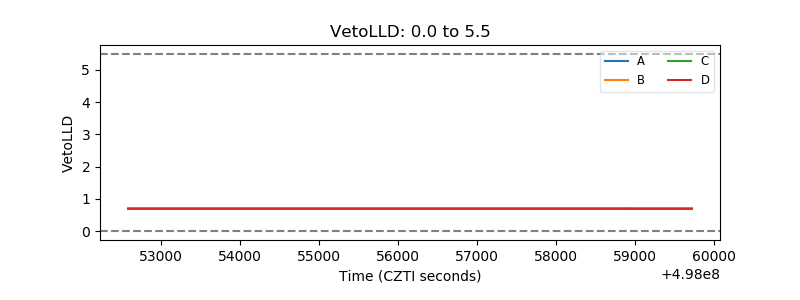 |
| Alpha Counter | 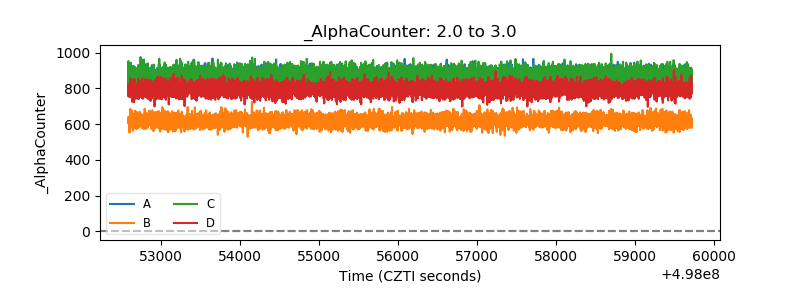 |
| _CPM_Rate | 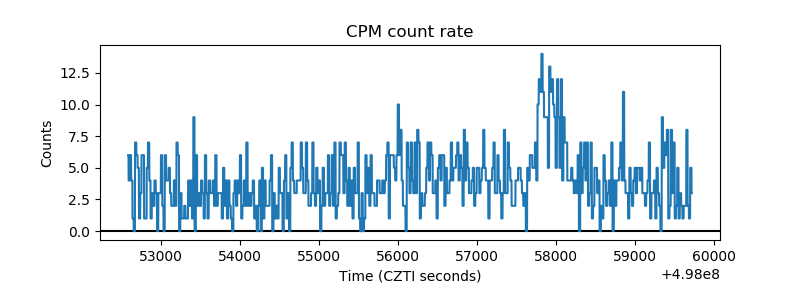 |
| CZT Counter | 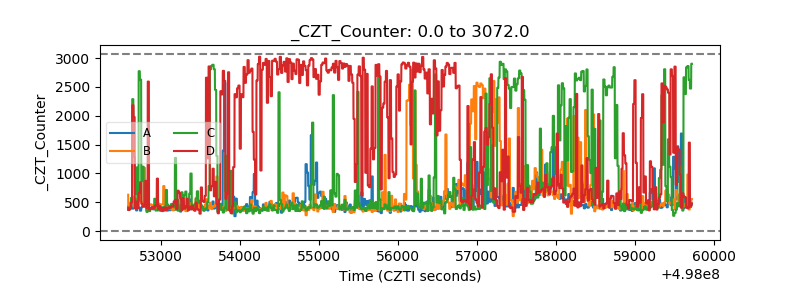 |
| +2.5 Volts monitor |  |
| +5 Volts monitor |  |
| _ROLL_ROT | 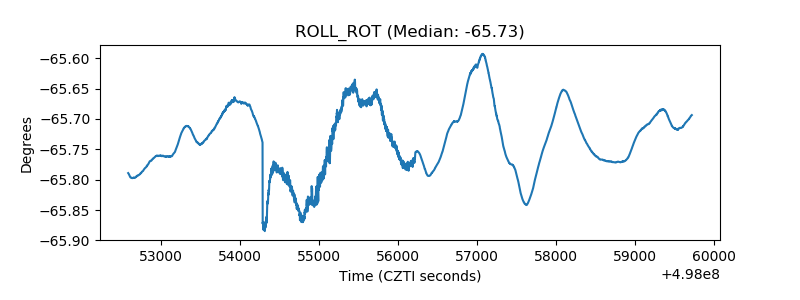 |
| _Roll_DEC | 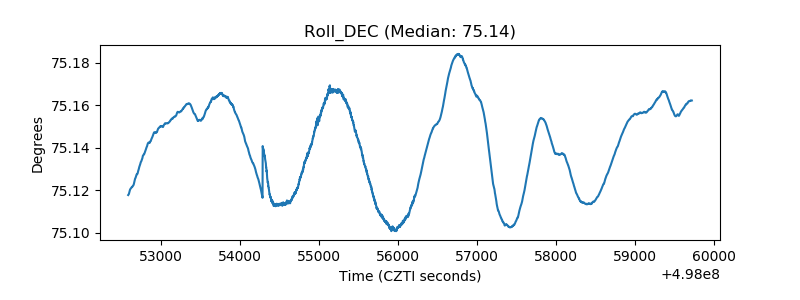 |
| _Roll_RA | 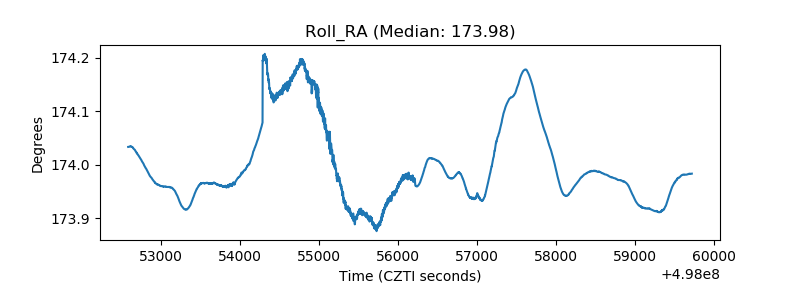 |
| Veto Counter | 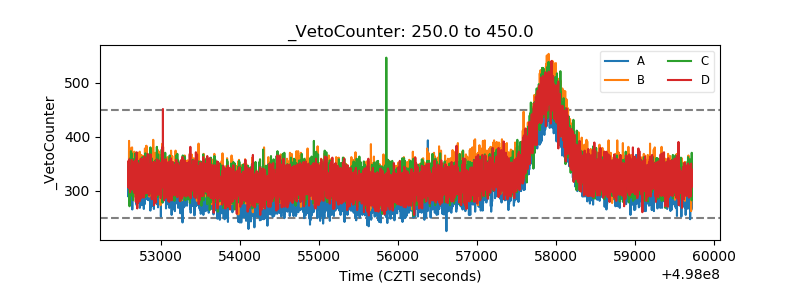 |