| Param | Original file | Final file |
|---|---|---|
| Filename | modeM0/AS1A14_126T15_9000006516_54332cztM0_level2.fits | modeM0/AS1A14_126T15_9000006516_54332cztM0_level2_quad_clean.evt |
| Size (bytes) | 641,079,360 | 97,669,440 |
| Size | 611.4 MB | 93.1 MB |
| Events in quadrant A | 3,362,654 | 701,986 |
| Events in quadrant B | 3,410,475 | 741,916 |
| Events in quadrant C | 5,061,158 | 596,068 |
| Events in quadrant D | 11,323,371 | 403,722 |
| Mode SS | |||
|---|---|---|---|
| Quadrant | BADHDUFLAG | Total packets | Discarded packets |
| A | 0 | 148 | 0 |
| B | 0 | 148 | 0 |
| C | 0 | 148 | 0 |
| D | 0 | 148 | 0 |
| Mode M0 | |||
|---|---|---|---|
| Quadrant | BADHDUFLAG | Total packets | Discarded packets |
| A | 0 | 15383 | 0 |
| B | 0 | 15470 | 0 |
| C | 0 | 20623 | 0 |
| D | 0 | 38650 | 0 |
| Quadrant | Total seconds | Saturated seconds | Saturation percentage |
|---|---|---|---|
| A | 7376 | 7 | 0.094902% |
| B | 7376 | 30 | 0.406725% |
| C | 7376 | 709 | 9.612256% |
| D | 7376 | 2813 | 38.137202% |
Noise dominated data is calculated using 1-second bins in cleaned event files. If a bin has >2000 counts, and if more than 50% of those come from <1% of pixels, then it is considered to be noise-dominated and hence unusable.
| Quadrant | # 1 sec bins | Bins with >0 counts | Bins with >2000 counts | High rate bins dominated by noise | Noise dominated (total time) | Noise dominated (detector-on time) | Marked lightcurve |
|---|---|---|---|---|---|---|---|
| A | 7376 | 7376 | 2 | 2 | 0.03% | 0.03% | 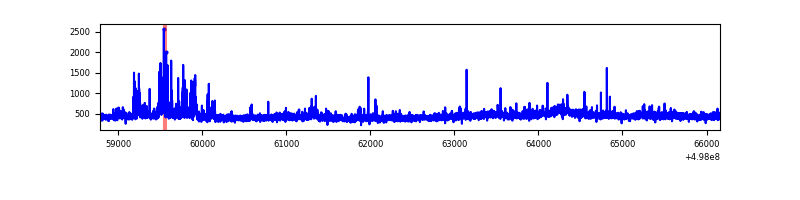 |
| B | 7376 | 7376 | 15 | 15 | 0.20% | 0.20% | 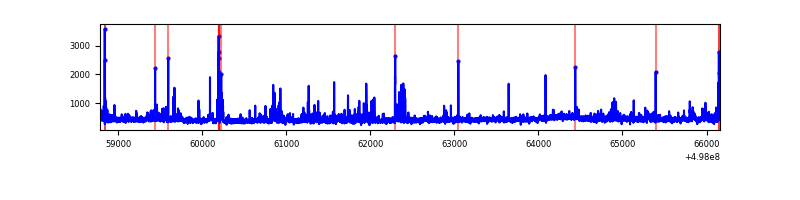 |
| C | 7376 | 7376 | 655 | 655 | 8.88% | 8.88% | 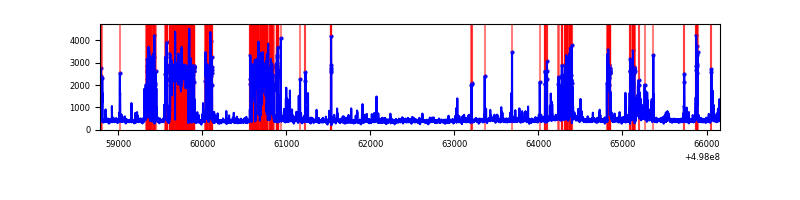 |
| D | 7376 | 7376 | 2736 | 2736 | 37.09% | 37.09% | 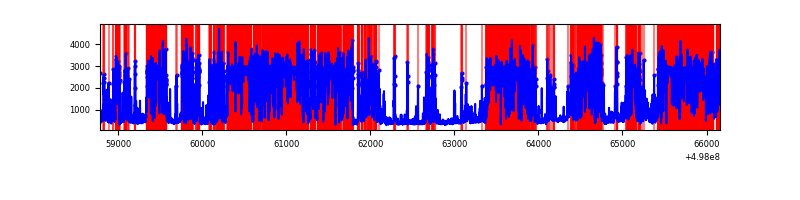 |
Top three noisy pixels from each quadrant. If the there are fewer than three noisy pixels in the level2.evt file, extra rows are filled as -1
| Pixel properties | Quadrant properties | ||||||
|---|---|---|---|---|---|---|---|
| Quadrant | DetID | PixID | Counts | Sigma | Mean | Median | Sigma |
| A | 5 | 243 | 164798 | 856.18 | 772 | 751 | 191.6 |
| A | 4 | 78 | 48031 | 246.76 | 772 | 751 | 191.6 |
| A | 11 | 3 | 37908 | 193.93 | 772 | 751 | 191.6 |
| B | 5 | 172 | 90273 | 553.78 | 756 | 727 | 161.7 |
| B | 4 | 21 | 63172 | 386.18 | 756 | 727 | 161.7 |
| B | 5 | 185 | 48784 | 297.2 | 756 | 727 | 161.7 |
| C | 1 | 241 | 1838856 | 9544.19 | 707 | 699 | 192.6 |
| C | 14 | 254 | 159795 | 826.07 | 707 | 699 | 192.6 |
| C | 15 | 147 | 83637 | 430.64 | 707 | 699 | 192.6 |
| D | 15 | 108 | 8219614 | 47915.36 | 599 | 572 | 171.5 |
| D | 8 | 176 | 360669 | 2099.29 | 599 | 572 | 171.5 |
| D | 3 | 12 | 97327 | 564.06 | 599 | 572 | 171.5 |
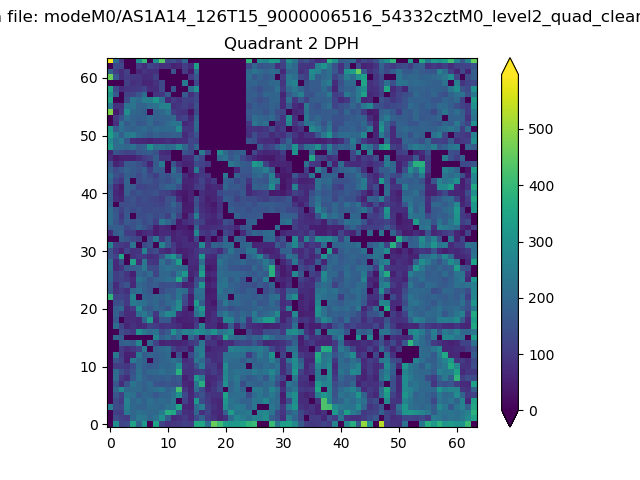
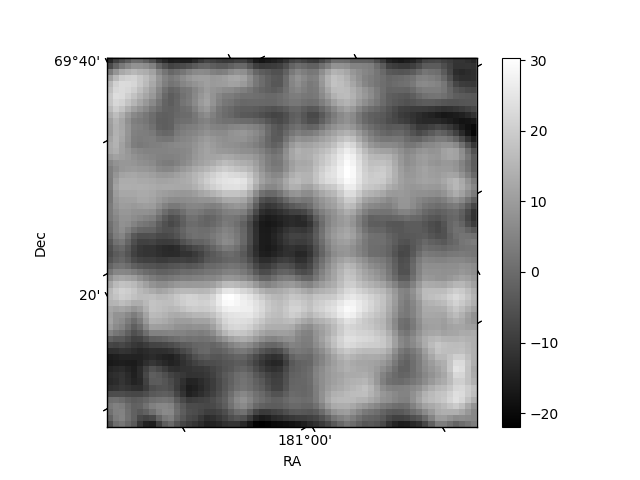
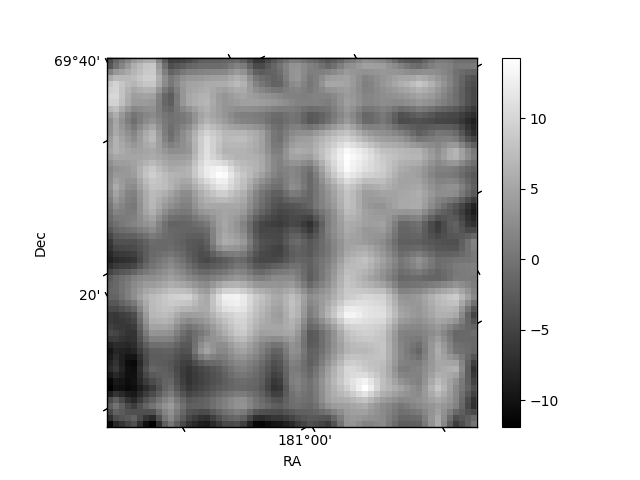
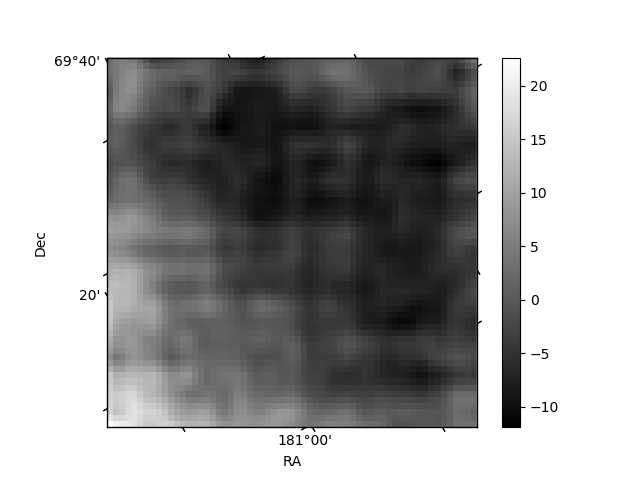
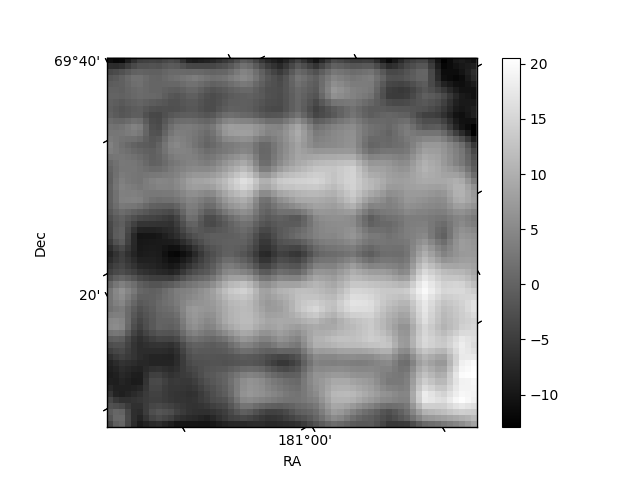
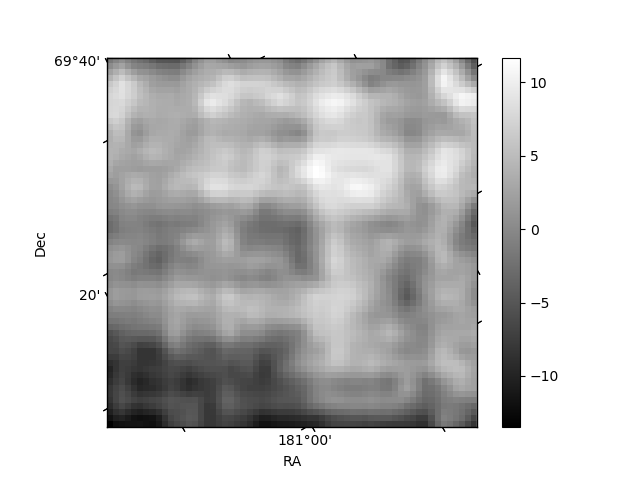
Histogram calculated using DETX and DETY for each event in the final _common_clean file
| Quadrant A | 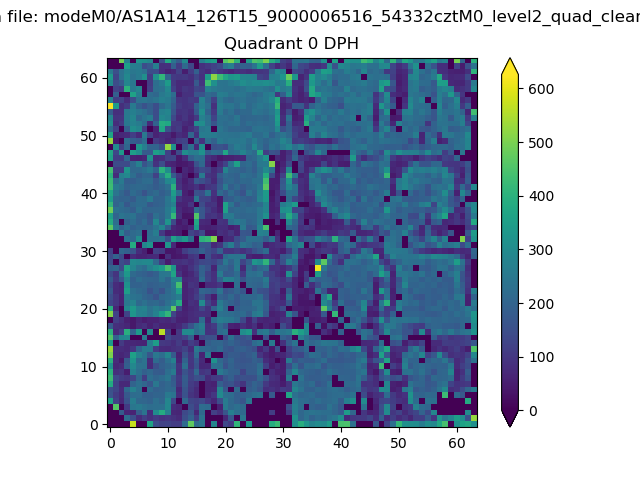 |
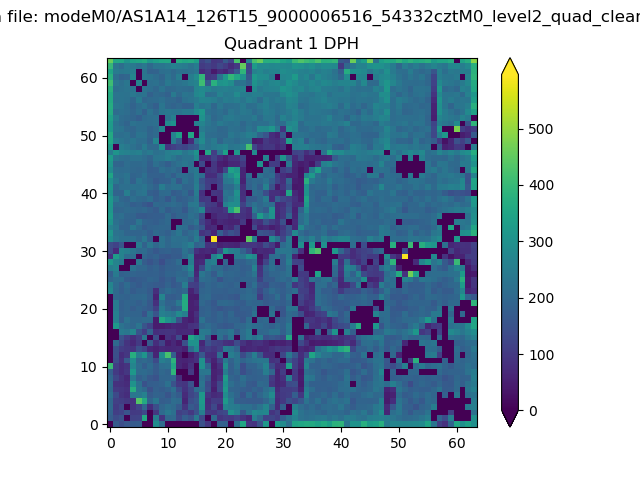 |
Quadrant B |
|---|---|---|---|
| Quadrant D | 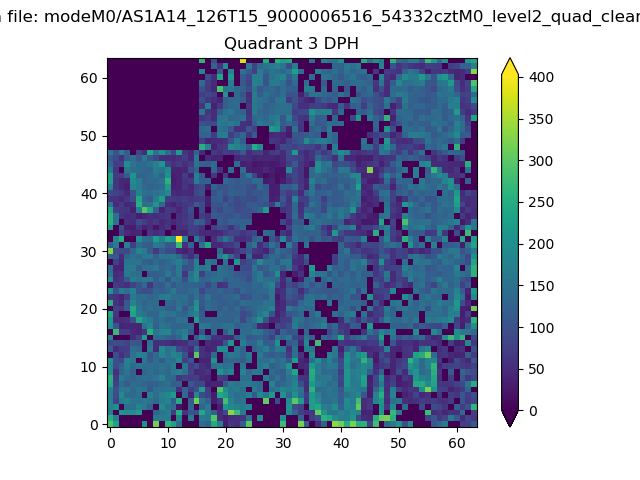 |
 |
Quadrant C |
| Plot type | Count rate plots | Images |
|---|---|---|
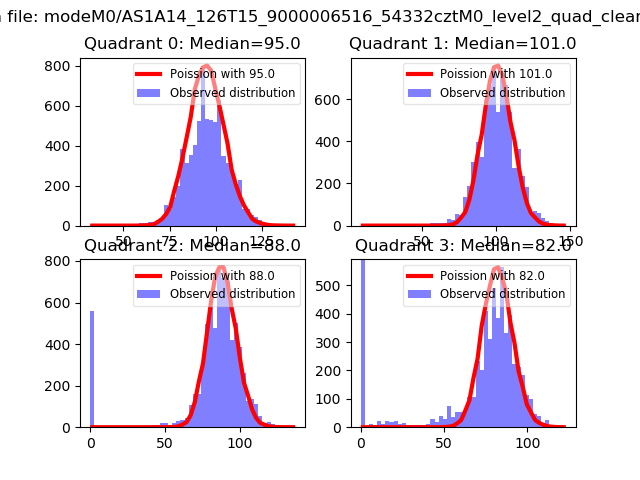
| Comparison with Poisson distribution Blue bars denote a histogram of data divided into 1 sec bins. Red curve is a Poisson curve with rate = median count rate of data. |
 |
 |
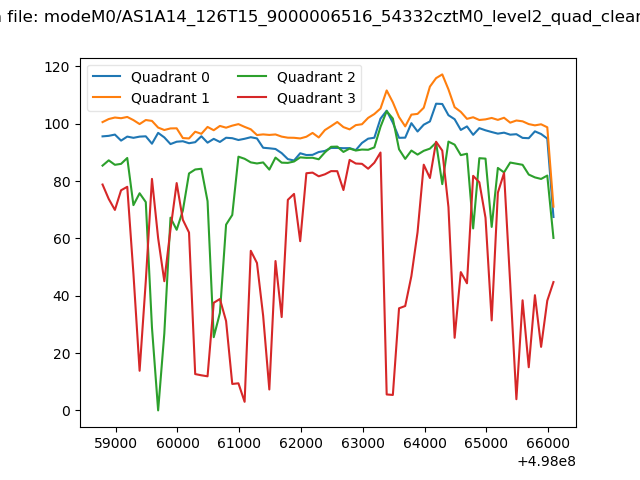
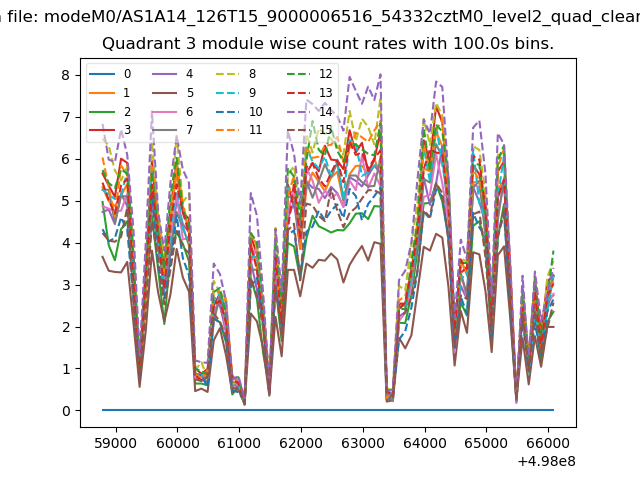
| Quadrant-wise count rates Data is divided into 100 sec bins |
 |
|
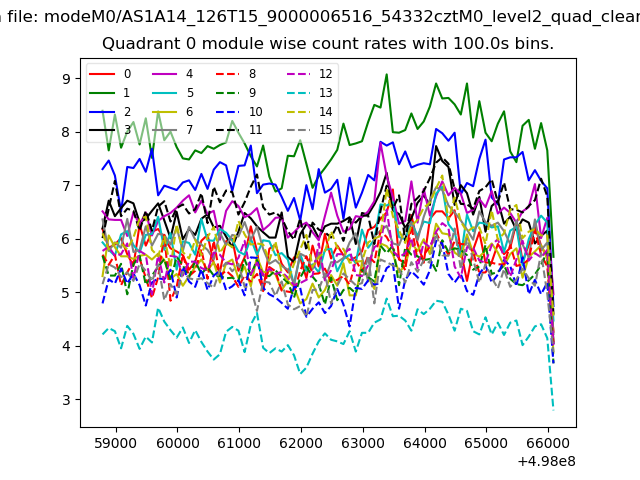
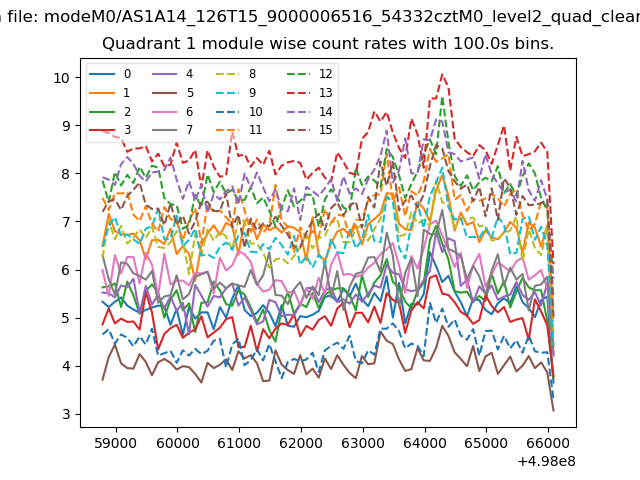
| Module-wise count rates for Quadrant A Data is divided into 100 sec bins |
 |
 |
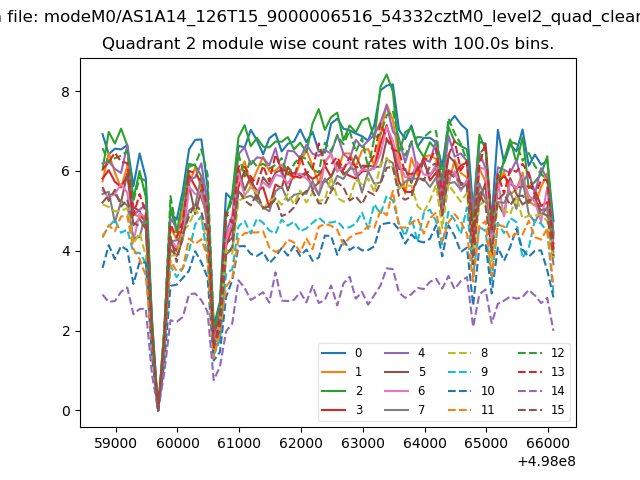
| Module-wise count rates for Quadrant B Data is divided into 100 sec bins |
 |
 |
| Module-wise count rates for Quadrant C Data is divided into 100 sec bins |
 |
 |
| Module-wise count rates for Quadrant D Data is divided into 100 sec bins |
 |
 |
| Parameter | Plot |
|---|---|
| CZT HV Monitor |  |
| D_VDD | 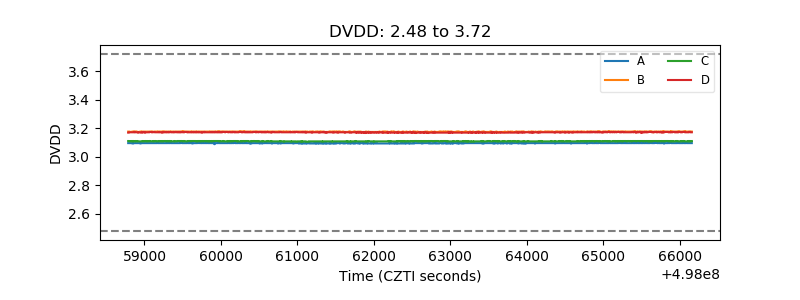 |
| Temperature 1 | 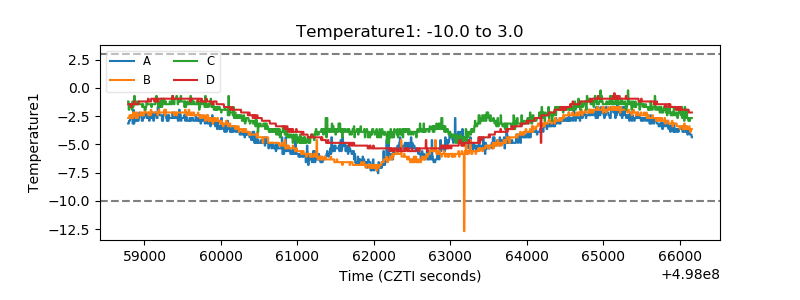 |
| Veto HV Monitor | 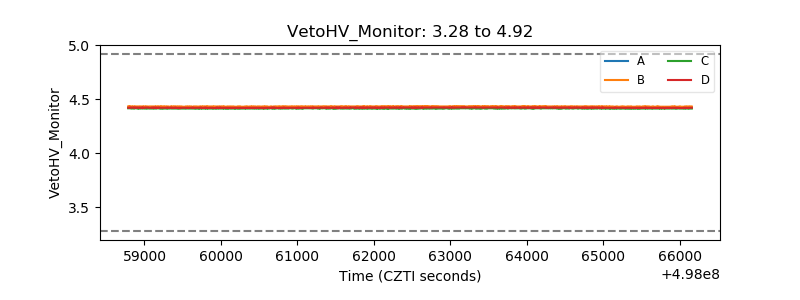 |
| Veto LLD | 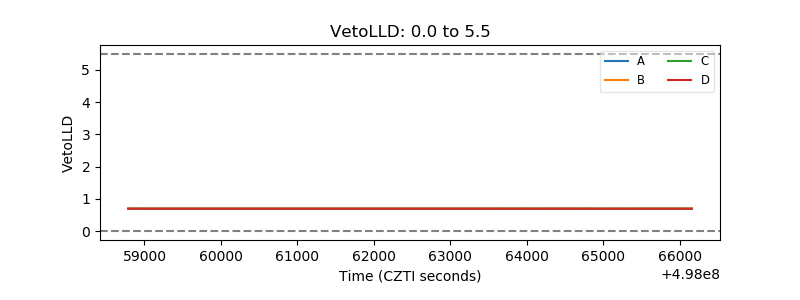 |
| Alpha Counter | 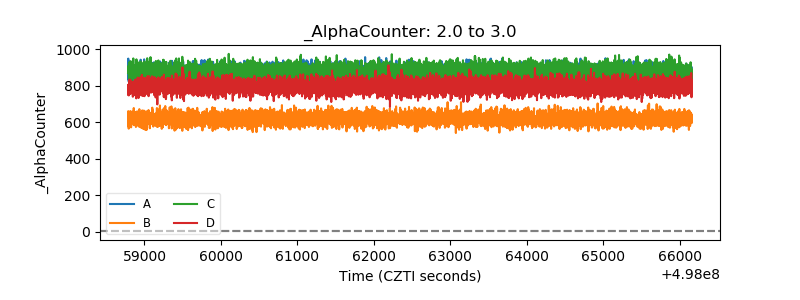 |
| _CPM_Rate | 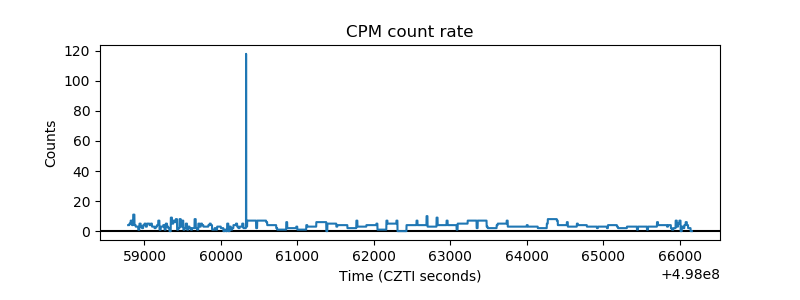 |
| CZT Counter | 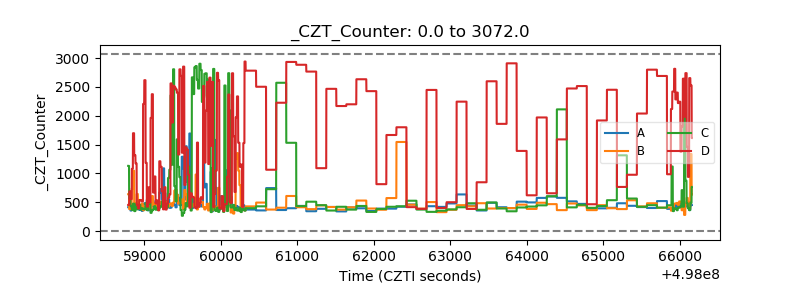 |
| +2.5 Volts monitor |  |
| +5 Volts monitor |  |
| _ROLL_ROT | 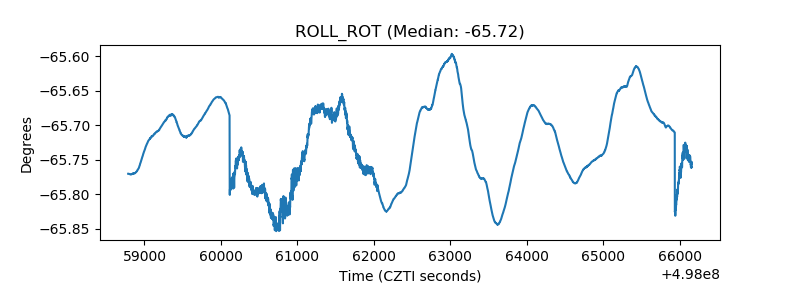 |
| _Roll_DEC | 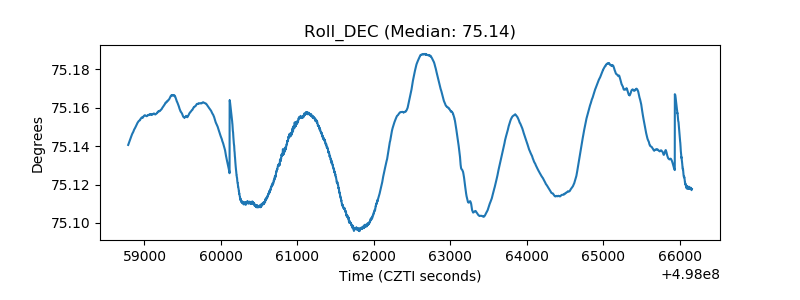 |
| _Roll_RA | 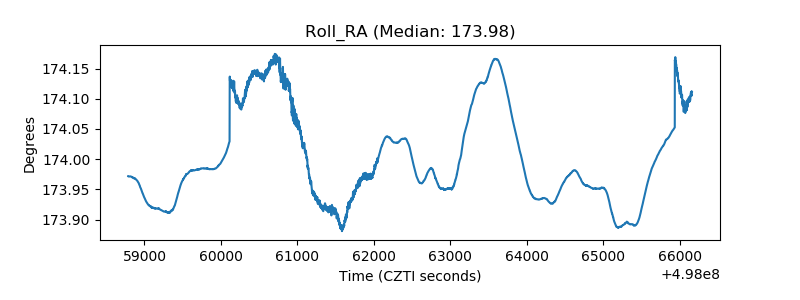 |
| Veto Counter | 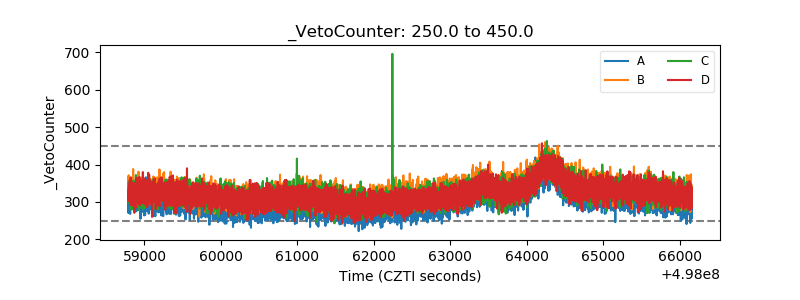 |