| Param | Original file | Final file |
|---|---|---|
| Filename | modeM0/AS1A14_126T15_9000006516_54333cztM0_level2.fits | modeM0/AS1A14_126T15_9000006516_54333cztM0_level2_quad_clean.evt |
| Size (bytes) | 681,082,560 | 93,441,600 |
| Size | 649.5 MB | 89.1 MB |
| Events in quadrant A | 4,218,553 | 656,022 |
| Events in quadrant B | 3,432,534 | 718,804 |
| Events in quadrant C | 3,797,046 | 628,889 |
| Events in quadrant D | 13,209,884 | 329,063 |
| Mode SS | |||
|---|---|---|---|
| Quadrant | BADHDUFLAG | Total packets | Discarded packets |
| A | 0 | 142 | 0 |
| B | 0 | 142 | 0 |
| C | 0 | 142 | 0 |
| D | 0 | 142 | 0 |
| Mode M0 | |||
|---|---|---|---|
| Quadrant | BADHDUFLAG | Total packets | Discarded packets |
| A | 0 | 17689 | 0 |
| B | 0 | 15226 | 0 |
| C | 0 | 16487 | 0 |
| D | 0 | 44040 | 0 |
| Quadrant | Total seconds | Saturated seconds | Saturation percentage |
|---|---|---|---|
| A | 7128 | 291 | 4.082492% |
| B | 7128 | 29 | 0.406846% |
| C | 7129 | 114 | 1.599102% |
| D | 7129 | 3594 | 50.413803% |
Noise dominated data is calculated using 1-second bins in cleaned event files. If a bin has >2000 counts, and if more than 50% of those come from <1% of pixels, then it is considered to be noise-dominated and hence unusable.
| Quadrant | # 1 sec bins | Bins with >0 counts | Bins with >2000 counts | High rate bins dominated by noise | Noise dominated (total time) | Noise dominated (detector-on time) | Marked lightcurve |
|---|---|---|---|---|---|---|---|
| A | 7128 | 7128 | 176 | 176 | 2.47% | 2.47% | 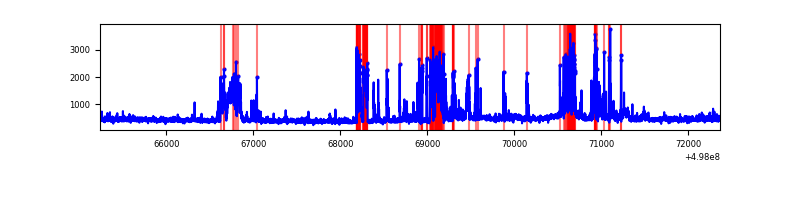 |
| B | 7128 | 7128 | 17 | 17 | 0.24% | 0.24% | 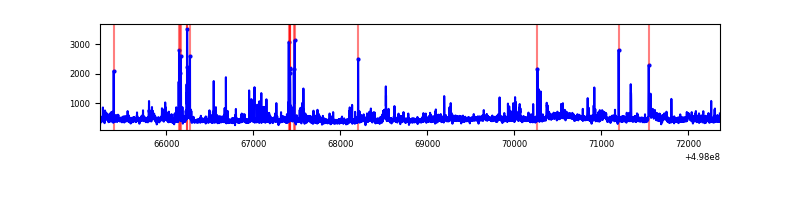 |
| C | 7129 | 7129 | 102 | 102 | 1.43% | 1.43% | 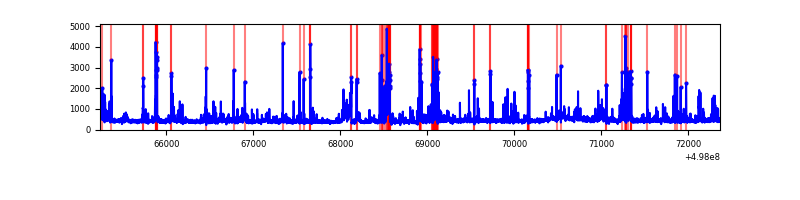 |
| D | 7128 | 7128 | 3400 | 3400 | 47.70% | 47.70% | 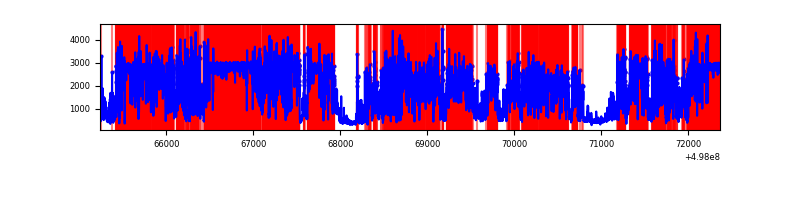 |
Top three noisy pixels from each quadrant. If the there are fewer than three noisy pixels in the level2.evt file, extra rows are filled as -1
| Pixel properties | Quadrant properties | ||||||
|---|---|---|---|---|---|---|---|
| Quadrant | DetID | PixID | Counts | Sigma | Mean | Median | Sigma |
| A | 7 | 14 | 794587 | 4334.26 | 740 | 722 | 183.2 |
| A | 3 | 110 | 114945 | 623.62 | 740 | 722 | 183.2 |
| A | 0 | 8 | 104452 | 566.33 | 740 | 722 | 183.2 |
| B | 10 | 247 | 110759 | 690.13 | 739 | 711 | 159.5 |
| B | 0 | 213 | 84565 | 525.87 | 739 | 711 | 159.5 |
| B | 0 | 171 | 81450 | 506.33 | 739 | 711 | 159.5 |
| C | 14 | 254 | 487934 | 2450.25 | 724 | 717 | 198.8 |
| C | 15 | 157 | 116132 | 580.43 | 724 | 717 | 198.8 |
| C | 12 | 2 | 112361 | 561.46 | 724 | 717 | 198.8 |
| D | 15 | 108 | 7904818 | 50545.43 | 551 | 525 | 156.4 |
| D | 10 | 1 | 2610566 | 16690.38 | 551 | 525 | 156.4 |
| D | 8 | 176 | 171870 | 1095.7 | 551 | 525 | 156.4 |
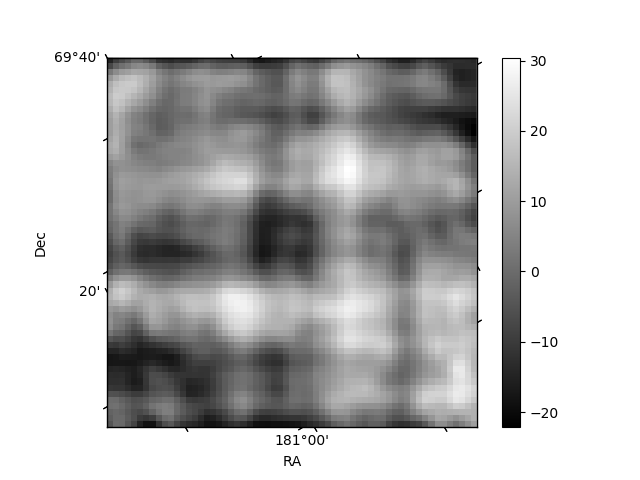
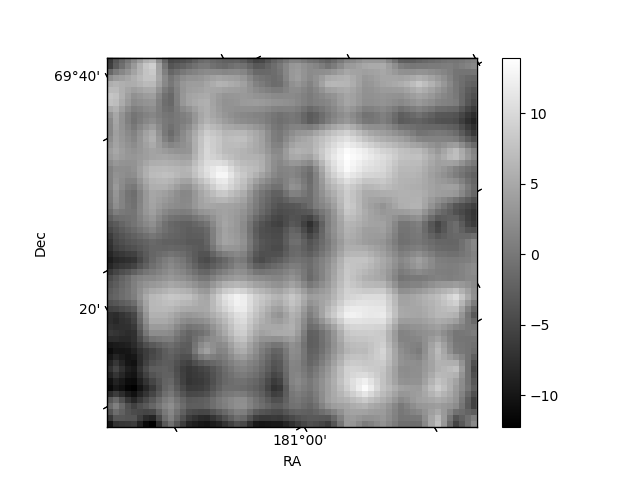
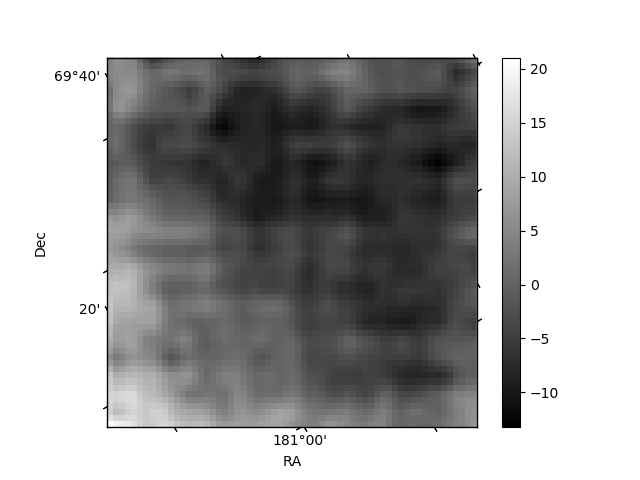
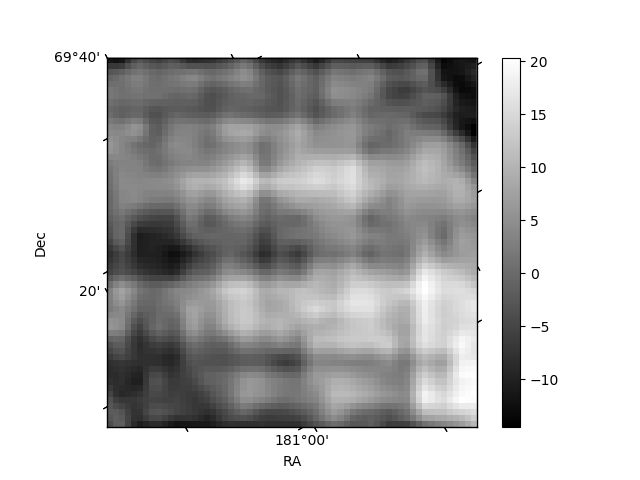
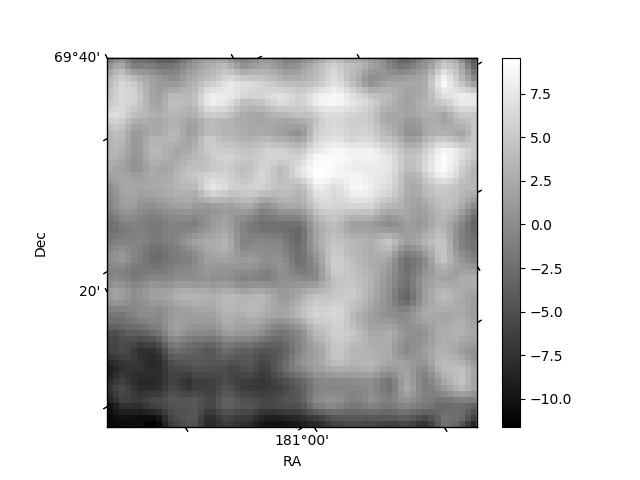
Histogram calculated using DETX and DETY for each event in the final _common_clean file
| Quadrant A | 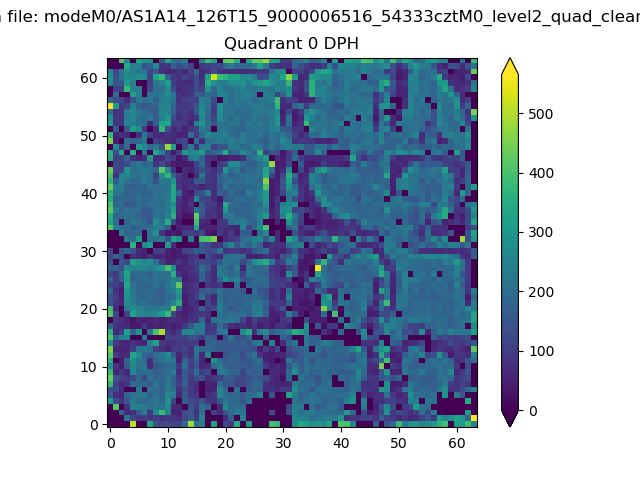 |
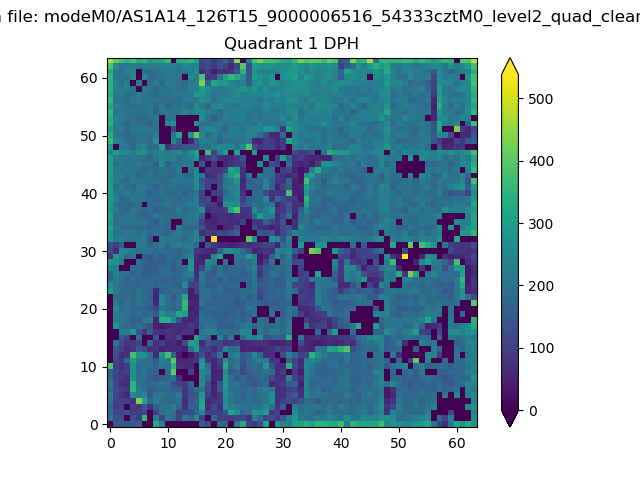 |
Quadrant B |
|---|---|---|---|
| Quadrant D | 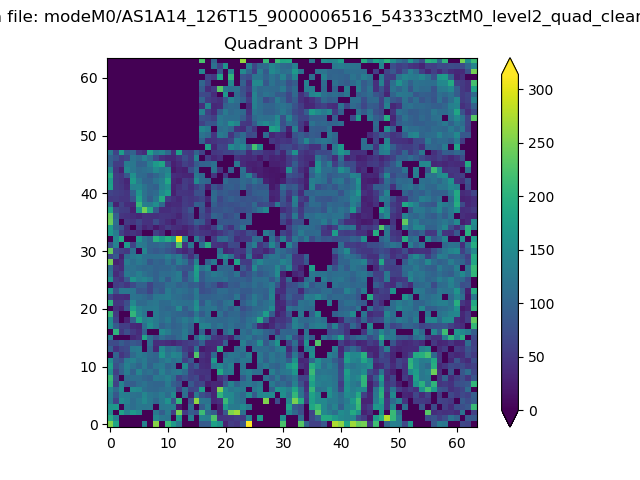 |
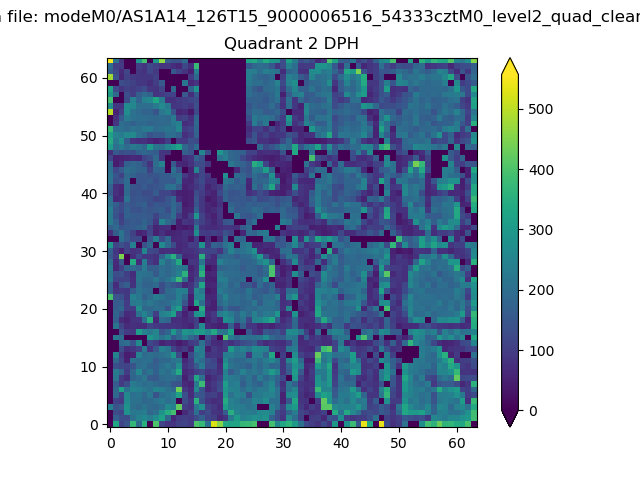 |
Quadrant C |
| Plot type | Count rate plots | Images |
|---|---|---|
| Comparison with Poisson distribution Blue bars denote a histogram of data divided into 1 sec bins. Red curve is a Poisson curve with rate = median count rate of data. |
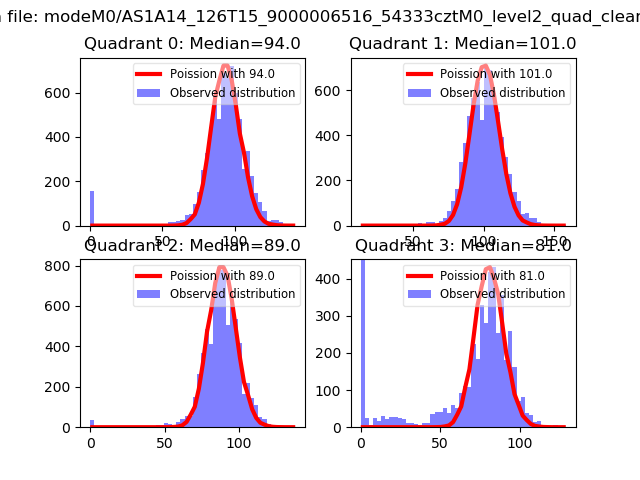 |
 |
| Quadrant-wise count rates Data is divided into 100 sec bins |
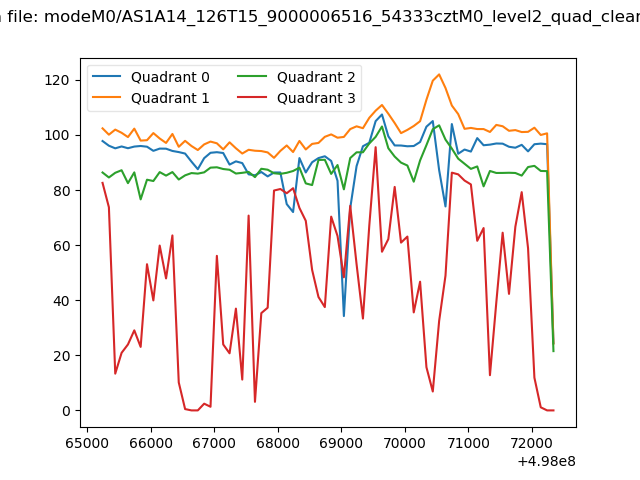 |
|
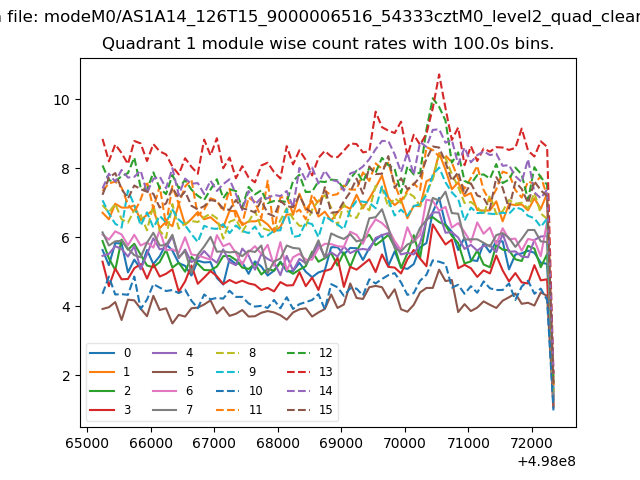
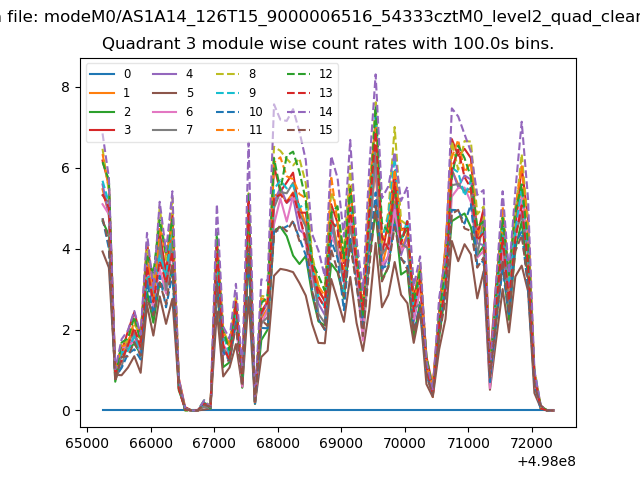
| Module-wise count rates for Quadrant A Data is divided into 100 sec bins |
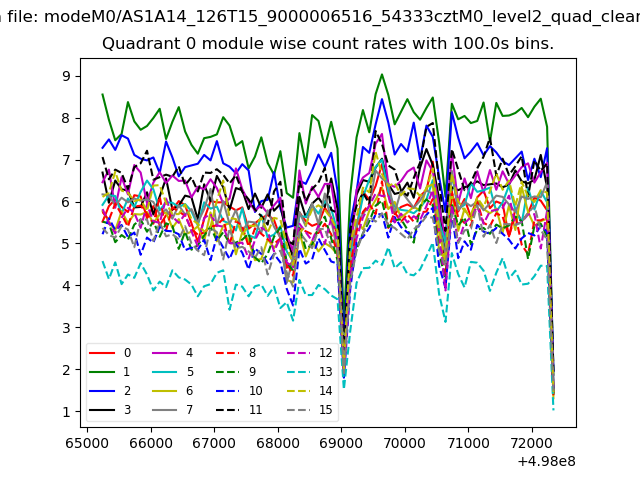 |
 |
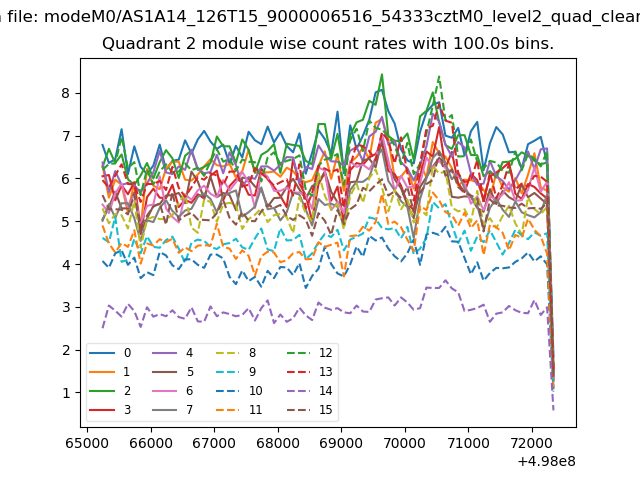
| Module-wise count rates for Quadrant B Data is divided into 100 sec bins |
 |
 |
| Module-wise count rates for Quadrant C Data is divided into 100 sec bins |
 |
 |
| Module-wise count rates for Quadrant D Data is divided into 100 sec bins |
 |
 |
| Parameter | Plot |
|---|---|
| CZT HV Monitor | 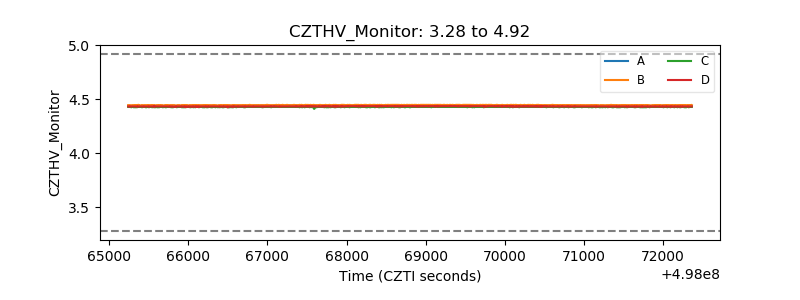 |
| D_VDD | 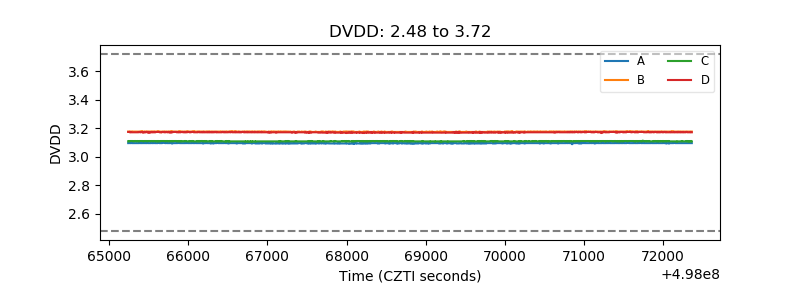 |
| Temperature 1 | 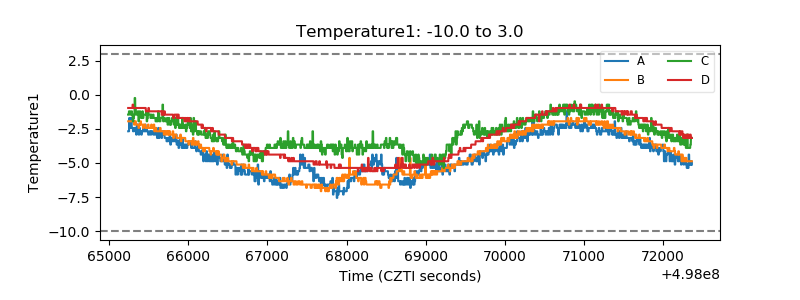 |
| Veto HV Monitor | 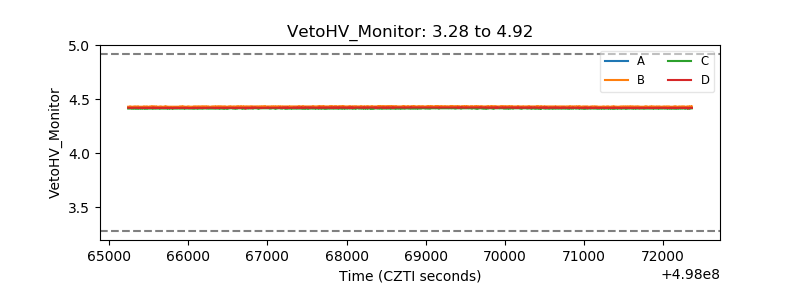 |
| Veto LLD | 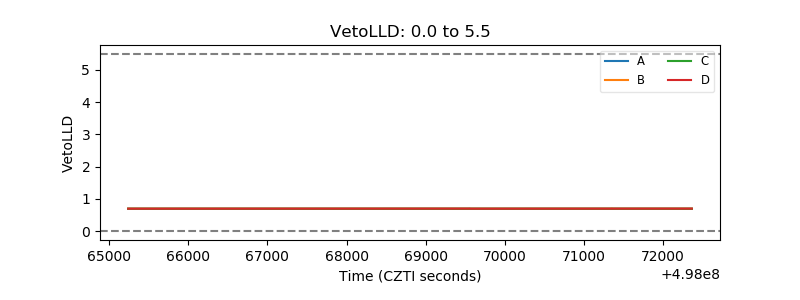 |
| Alpha Counter | 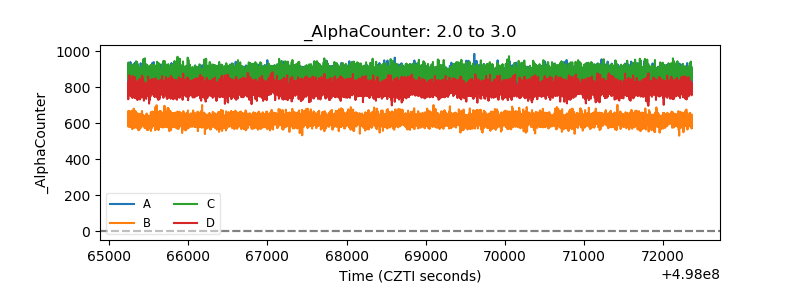 |
| _CPM_Rate | 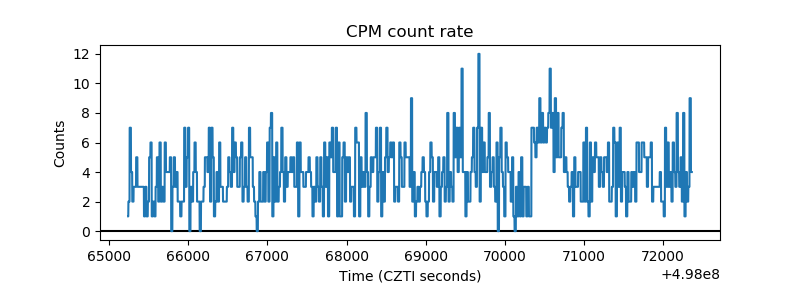 |
| CZT Counter | 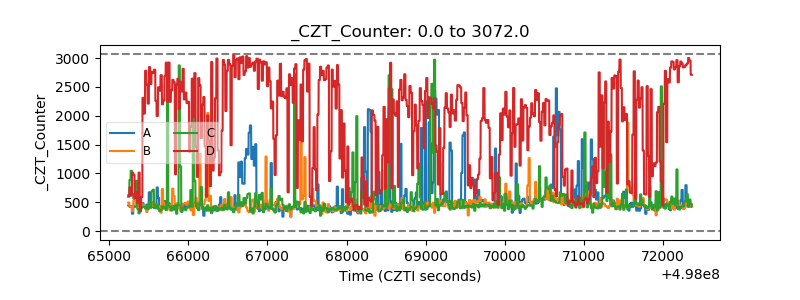 |
| +2.5 Volts monitor | 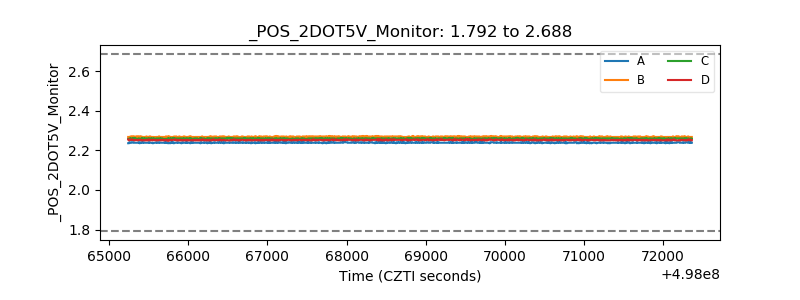 |
| +5 Volts monitor | 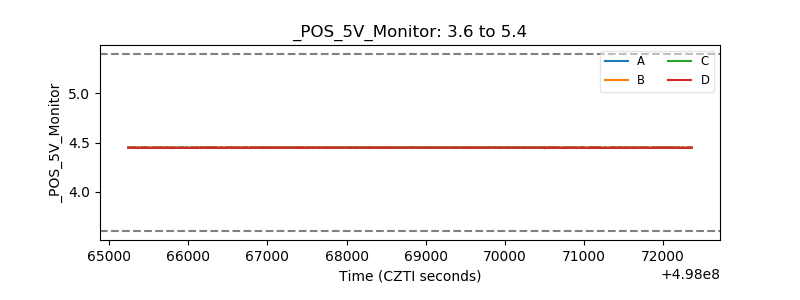 |
| _ROLL_ROT | 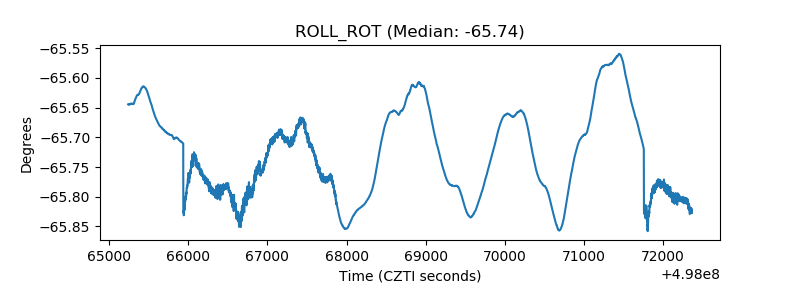 |
| _Roll_DEC | 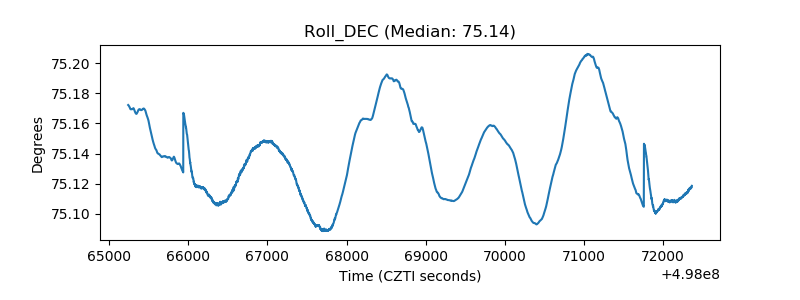 |
| _Roll_RA | 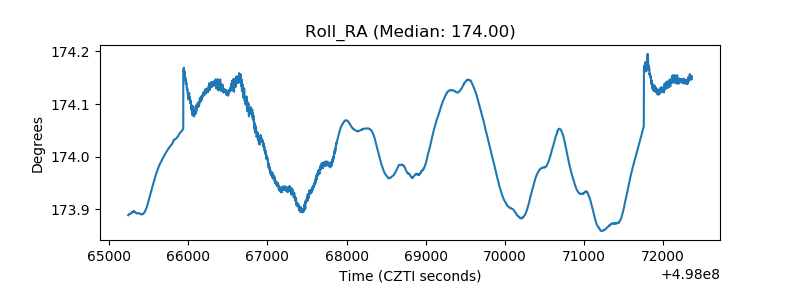 |
| Veto Counter | 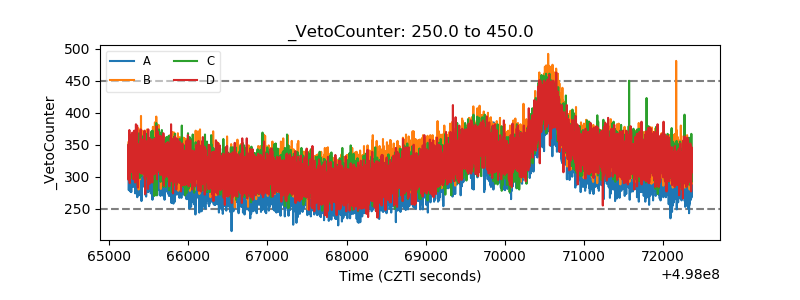 |