| Param | Original file | Final file |
|---|---|---|
| Filename | modeM0/AS1A14_126T15_9000006516_54336cztM0_level2.fits | modeM0/AS1A14_126T15_9000006516_54336cztM0_level2_quad_clean.evt |
| Size (bytes) | 2,012,823,360 | 237,493,440 |
| Size | 1.9 GB | 226.5 MB |
| Events in quadrant A | 11,168,463 | 1,705,410 |
| Events in quadrant B | 10,297,414 | 1,885,165 |
| Events in quadrant C | 12,232,713 | 1,617,541 |
| Events in quadrant D | 39,329,820 | 662,944 |
| Mode SS | |||
|---|---|---|---|
| Quadrant | BADHDUFLAG | Total packets | Discarded packets |
| A | 0 | 386 | 0 |
| B | 0 | 386 | 0 |
| C | 0 | 386 | 0 |
| D | 0 | 386 | 0 |
| Mode M0 | |||
|---|---|---|---|
| Quadrant | BADHDUFLAG | Total packets | Discarded packets |
| A | 0 | 47376 | 2 |
| B | 0 | 43966 | 2 |
| C | 0 | 50319 | 2 |
| D | 0 | 129336 | 2 |
| Mode M9 | |||
|---|---|---|---|
| Quadrant | BADHDUFLAG | Total packets | Discarded packets |
| A | 0 | 12 | 0 |
| B | 0 | 12 | 0 |
| C | 0 | 12 | 0 |
| D | 0 | 12 | 0 |
| Quadrant | Total seconds | Saturated seconds | Saturation percentage |
|---|---|---|---|
| A | 19144 | 1042 | 5.442959% |
| B | 19144 | 398 | 2.078980% |
| C | 19145 | 1060 | 5.536694% |
| D | 19145 | 11910 | 62.209454% |
Noise dominated data is calculated using 1-second bins in cleaned event files. If a bin has >2000 counts, and if more than 50% of those come from <1% of pixels, then it is considered to be noise-dominated and hence unusable.
| Quadrant | # 1 sec bins | Bins with >0 counts | Bins with >2000 counts | High rate bins dominated by noise | Noise dominated (total time) | Noise dominated (detector-on time) | Marked lightcurve |
|---|---|---|---|---|---|---|---|
| A | 20294 | 19146 | 503 | 503 | 2.48% | 2.63% | 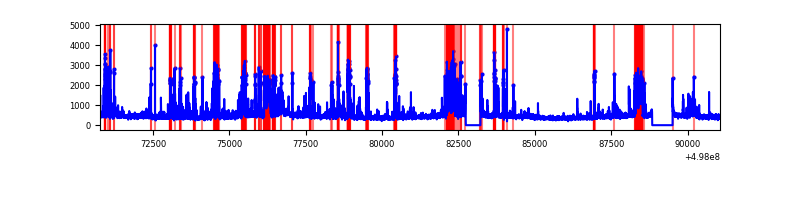 |
| B | 20294 | 19146 | 168 | 168 | 0.83% | 0.88% | 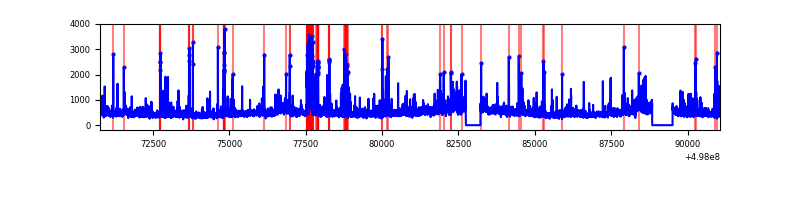 |
| C | 20295 | 19146 | 828 | 828 | 4.08% | 4.32% | 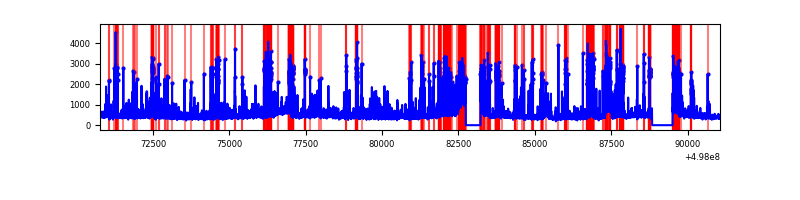 |
| D | 20294 | 19145 | 11634 | 11634 | 57.33% | 60.77% | 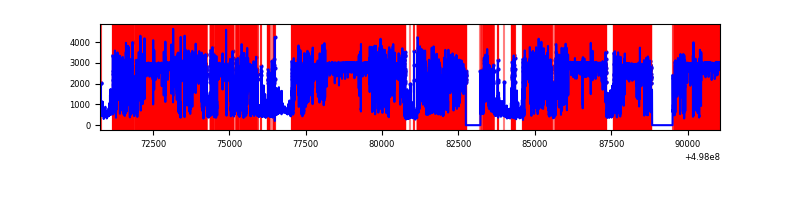 |
Top three noisy pixels from each quadrant. If the there are fewer than three noisy pixels in the level2.evt file, extra rows are filled as -1
| Pixel properties | Quadrant properties | ||||||
|---|---|---|---|---|---|---|---|
| Quadrant | DetID | PixID | Counts | Sigma | Mean | Median | Sigma |
| A | 7 | 14 | 1519259 | 3110.69 | 1985 | 1933 | 487.8 |
| A | 7 | 29 | 483939 | 988.17 | 1985 | 1933 | 487.8 |
| A | 15 | 174 | 372399 | 759.5 | 1985 | 1933 | 487.8 |
| B | 7 | 0 | 956923 | 2241.84 | 1994 | 1919 | 426.0 |
| B | 2 | 249 | 413051 | 965.12 | 1994 | 1919 | 426.0 |
| B | 10 | 247 | 225148 | 524.02 | 1994 | 1919 | 426.0 |
| C | 1 | 241 | 1403285 | 2665.81 | 1930 | 1916 | 525.7 |
| C | 15 | 147 | 888940 | 1687.38 | 1930 | 1916 | 525.7 |
| C | 15 | 157 | 711401 | 1349.65 | 1930 | 1916 | 525.7 |
| D | 15 | 108 | 30067928 | 82152.54 | 1254 | 1190 | 366.0 |
| D | 8 | 176 | 1708045 | 4663.71 | 1254 | 1190 | 366.0 |
| D | 12 | 3 | 683401 | 1864.03 | 1254 | 1190 | 366.0 |
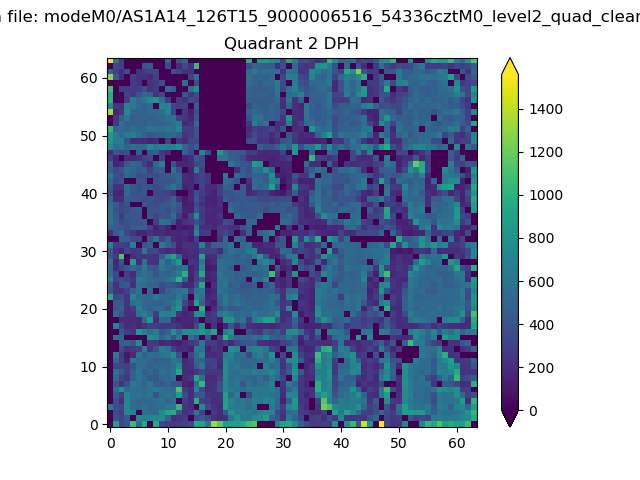
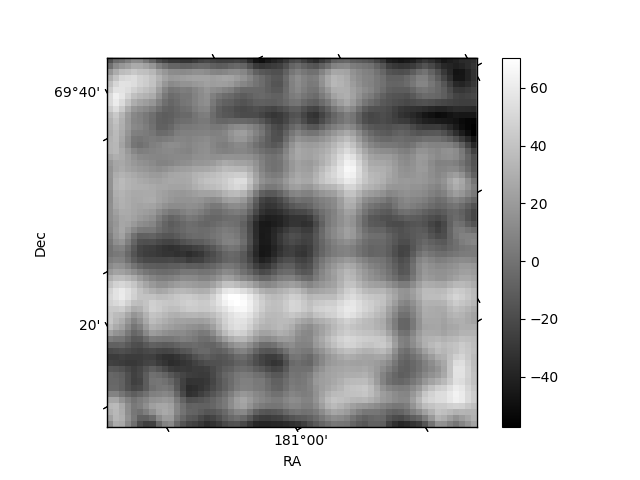
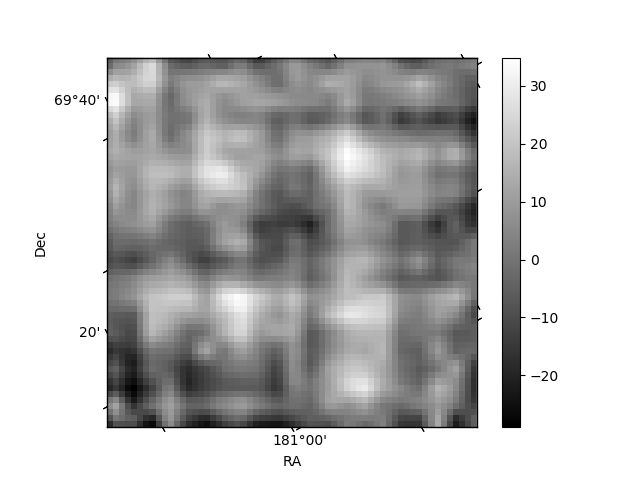
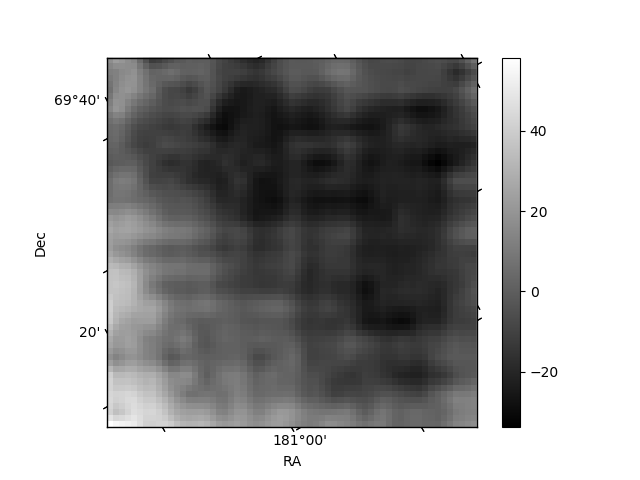
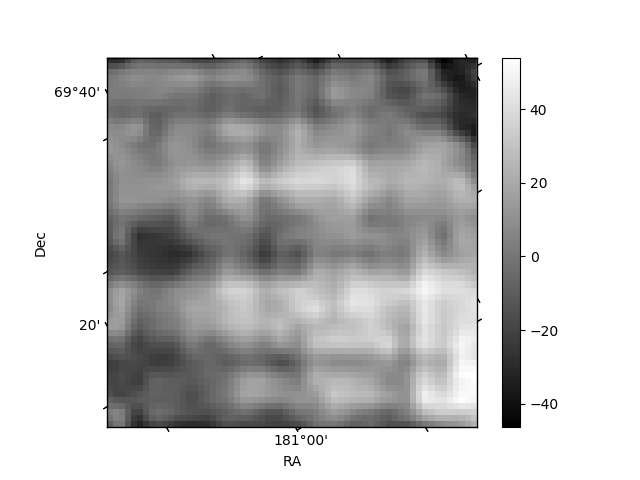
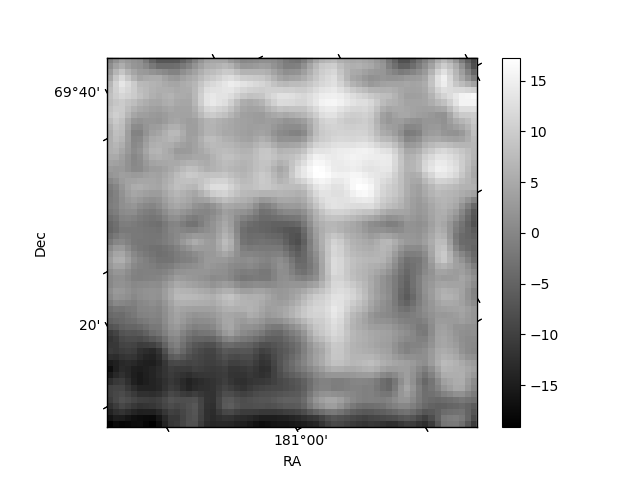
Histogram calculated using DETX and DETY for each event in the final _common_clean file
| Quadrant A | 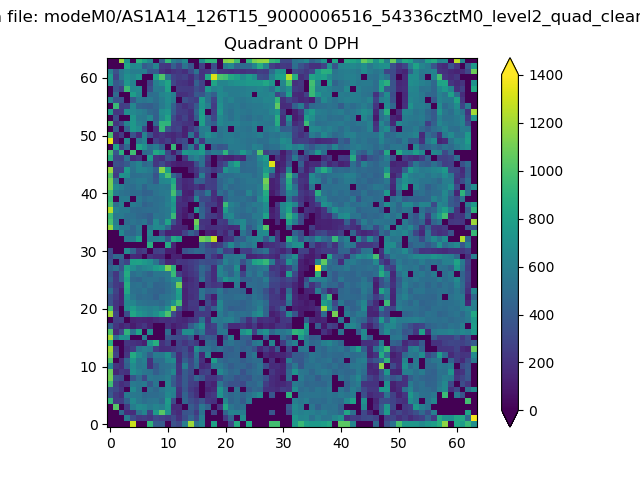 |
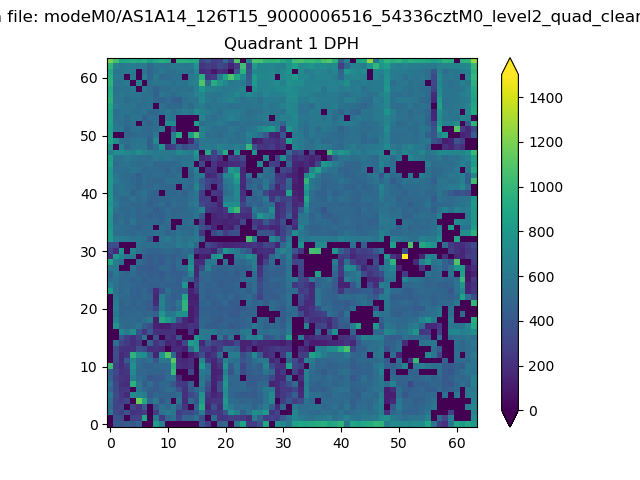 |
Quadrant B |
|---|---|---|---|
| Quadrant D | 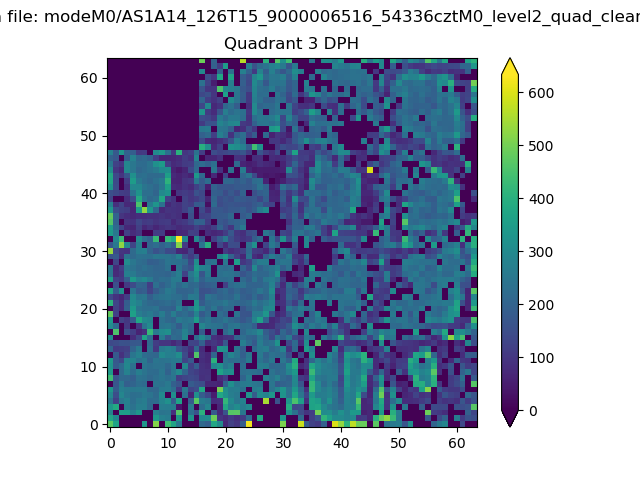 |
 |
Quadrant C |
| Plot type | Count rate plots | Images |
|---|---|---|
| Comparison with Poisson distribution Blue bars denote a histogram of data divided into 1 sec bins. Red curve is a Poisson curve with rate = median count rate of data. |
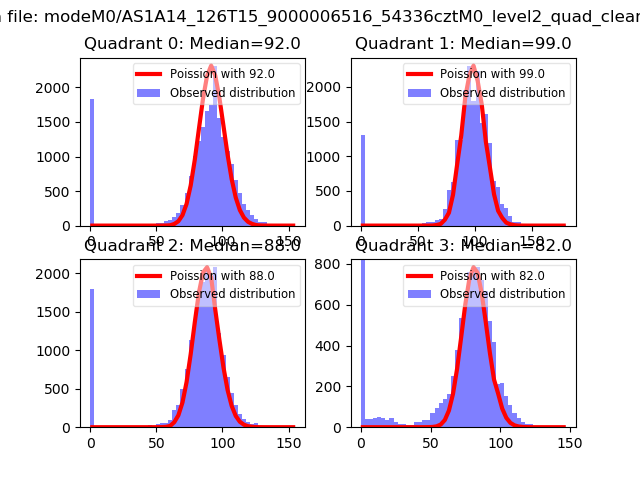 |
 |
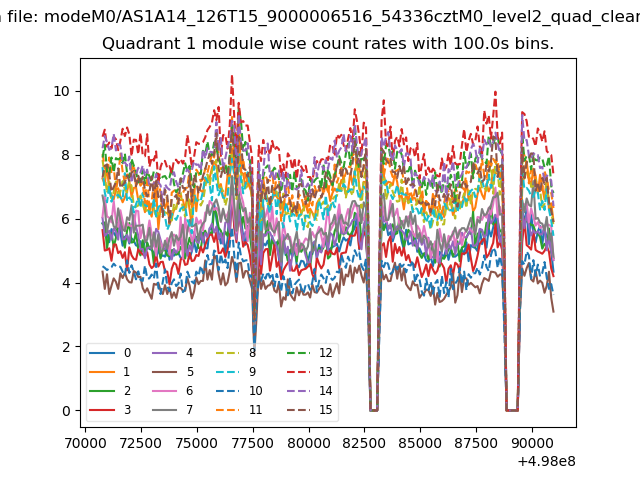
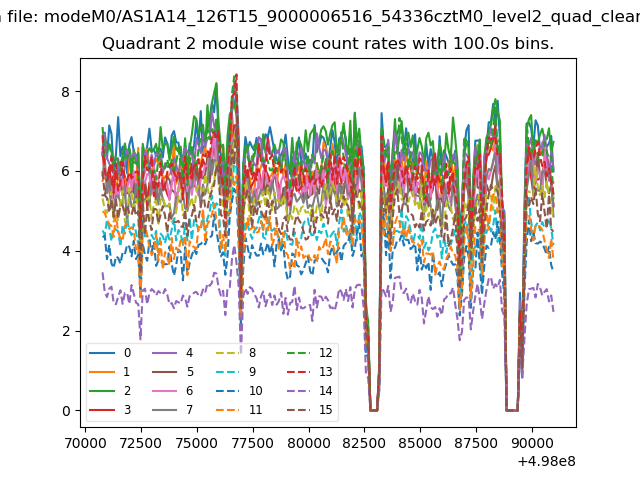
| Quadrant-wise count rates Data is divided into 100 sec bins |
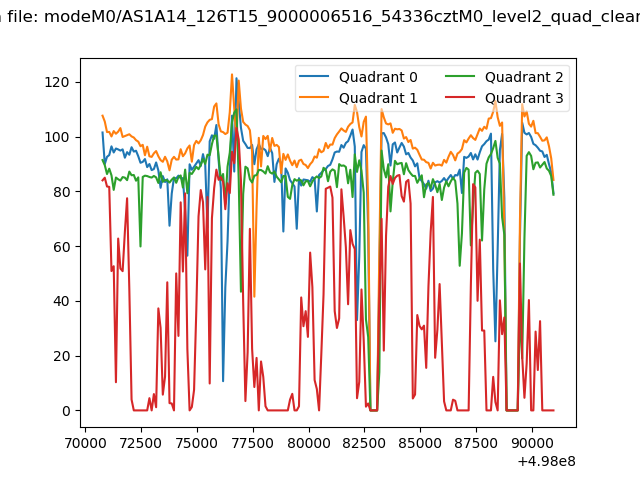 |
|
| Module-wise count rates for Quadrant A Data is divided into 100 sec bins |
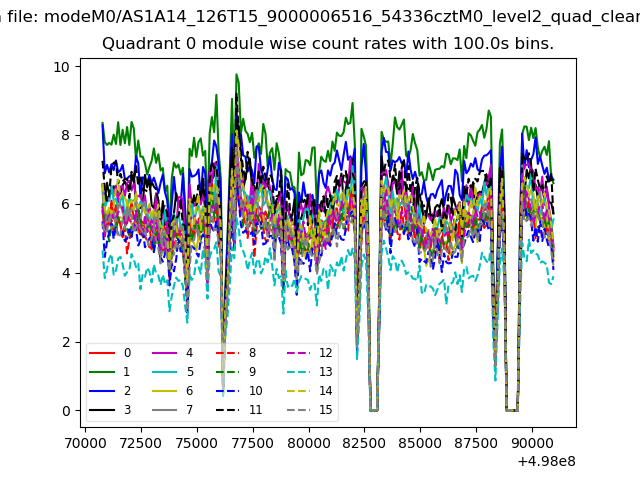 |
 |
| Module-wise count rates for Quadrant B Data is divided into 100 sec bins |
 |
 |
| Module-wise count rates for Quadrant C Data is divided into 100 sec bins |
 |
 |
| Module-wise count rates for Quadrant D Data is divided into 100 sec bins |
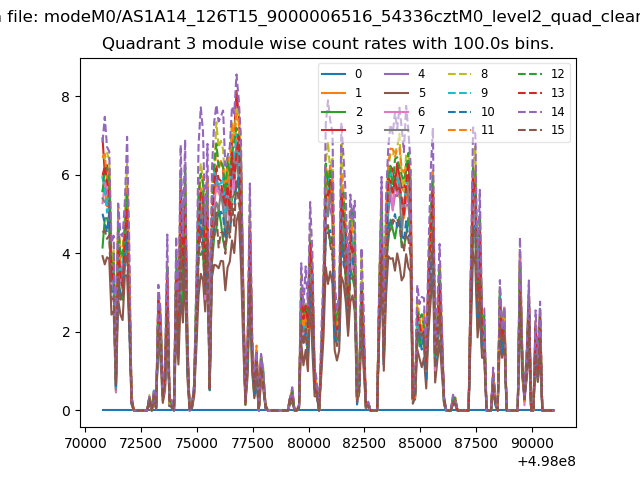 |
 |
| Parameter | Plot |
|---|---|
| CZT HV Monitor | 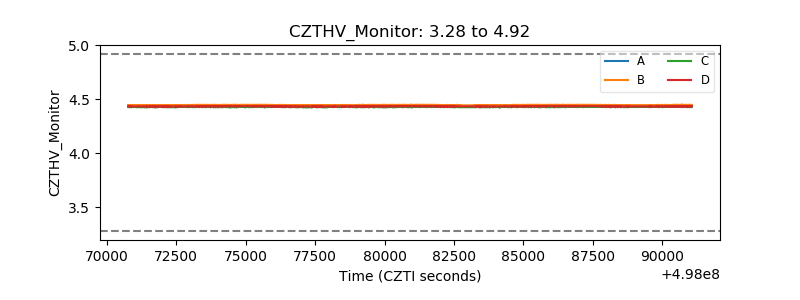 |
| D_VDD | 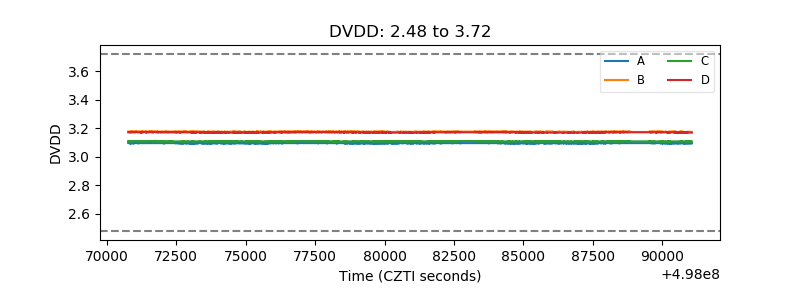 |
| Temperature 1 | 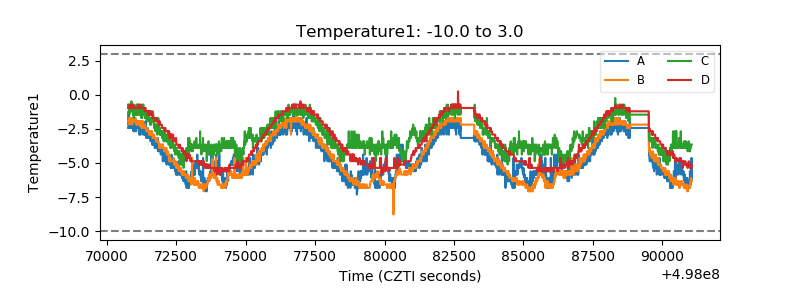 |
| Veto HV Monitor | 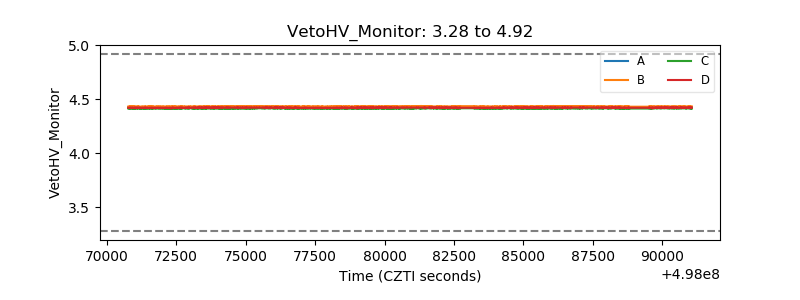 |
| Veto LLD | 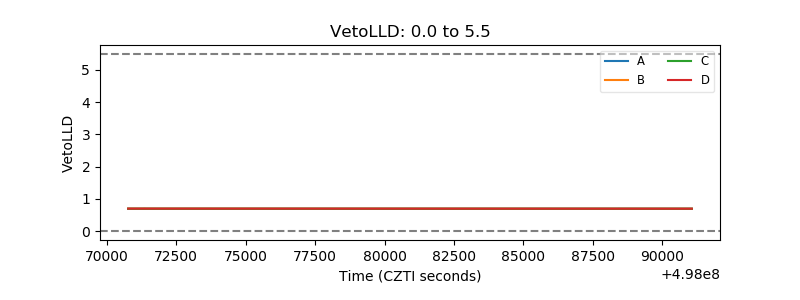 |
| Alpha Counter | 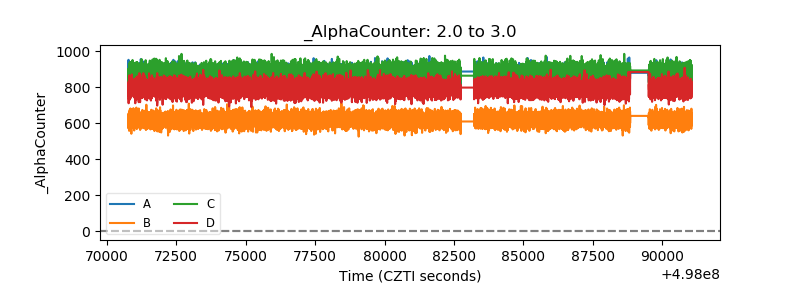 |
| _CPM_Rate | 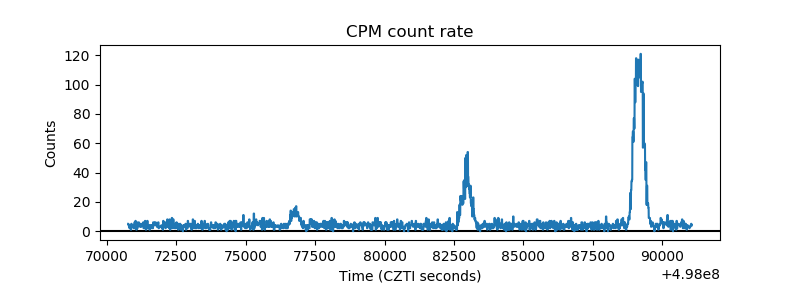 |
| CZT Counter | 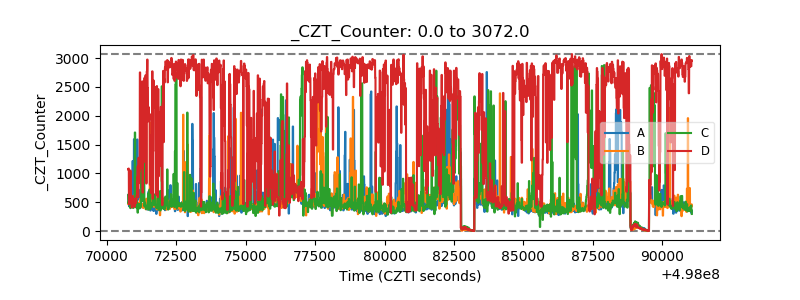 |
| +2.5 Volts monitor |  |
| +5 Volts monitor |  |
| _ROLL_ROT | 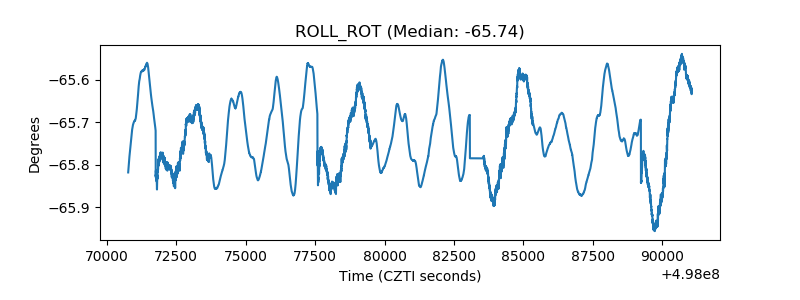 |
| _Roll_DEC | 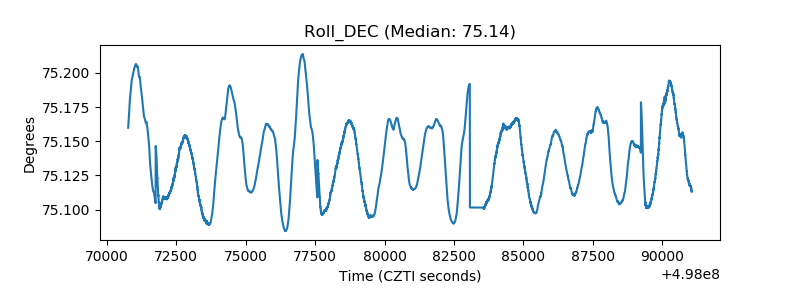 |
| _Roll_RA | 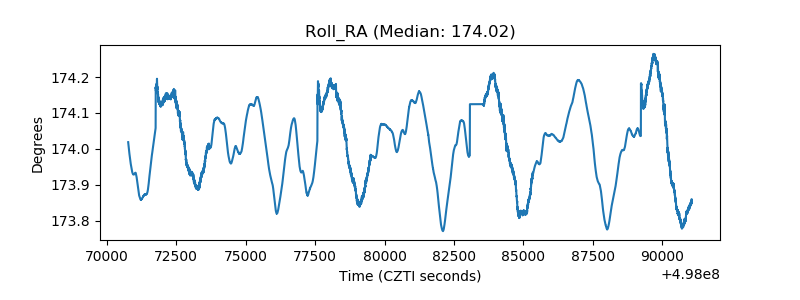 |
| Veto Counter | 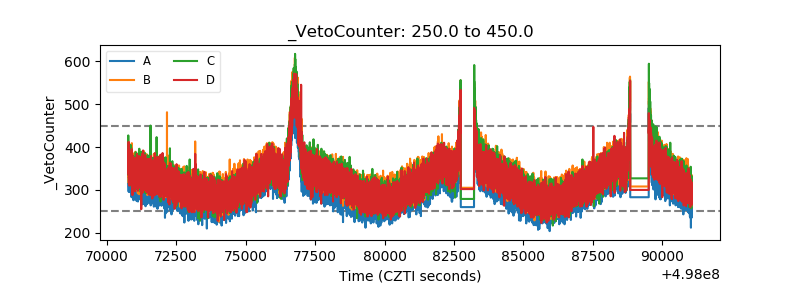 |