| Param | Original file | Final file |
|---|---|---|
| Filename | modeM0/AS1A14_126T15_9000006516_54337cztM0_level2.fits | modeM0/AS1A14_126T15_9000006516_54337cztM0_level2_quad_clean.evt |
| Size (bytes) | 773,400,960 | 90,596,160 |
| Size | 737.6 MB | 86.4 MB |
| Events in quadrant A | 3,372,330 | 684,611 |
| Events in quadrant B | 3,809,261 | 721,981 |
| Events in quadrant C | 6,233,153 | 549,495 |
| Events in quadrant D | 14,653,712 | 283,727 |
| Mode SS | |||
|---|---|---|---|
| Quadrant | BADHDUFLAG | Total packets | Discarded packets |
| A | 0 | 150 | 0 |
| B | 0 | 150 | 0 |
| C | 0 | 150 | 0 |
| D | 0 | 150 | 0 |
| Mode M0 | |||
|---|---|---|---|
| Quadrant | BADHDUFLAG | Total packets | Discarded packets |
| A | 0 | 15488 | 2 |
| B | 0 | 16395 | 2 |
| C | 0 | 23909 | 2 |
| D | 0 | 48243 | 2 |
| Mode M9 | |||
|---|---|---|---|
| Quadrant | BADHDUFLAG | Total packets | Discarded packets |
| A | 0 | 15 | 0 |
| B | 0 | 15 | 0 |
| C | 0 | 15 | 0 |
| D | 0 | 15 | 0 |
| Quadrant | Total seconds | Saturated seconds | Saturation percentage |
|---|---|---|---|
| A | 7221 | 59 | 0.817061% |
| B | 7221 | 125 | 1.731062% |
| C | 7222 | 1220 | 16.892827% |
| D | 7222 | 4248 | 58.820271% |
Noise dominated data is calculated using 1-second bins in cleaned event files. If a bin has >2000 counts, and if more than 50% of those come from <1% of pixels, then it is considered to be noise-dominated and hence unusable.
| Quadrant | # 1 sec bins | Bins with >0 counts | Bins with >2000 counts | High rate bins dominated by noise | Noise dominated (total time) | Noise dominated (detector-on time) | Marked lightcurve |
|---|---|---|---|---|---|---|---|
| A | 8736 | 7223 | 26 | 26 | 0.30% | 0.36% | 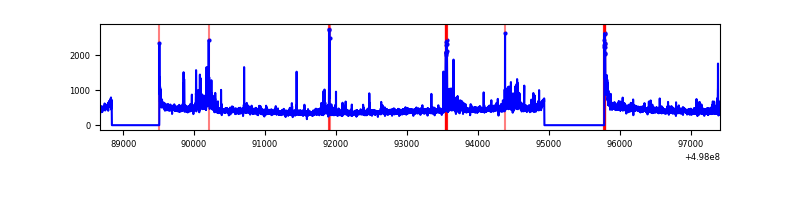 |
| B | 8736 | 7223 | 40 | 40 | 0.46% | 0.55% | 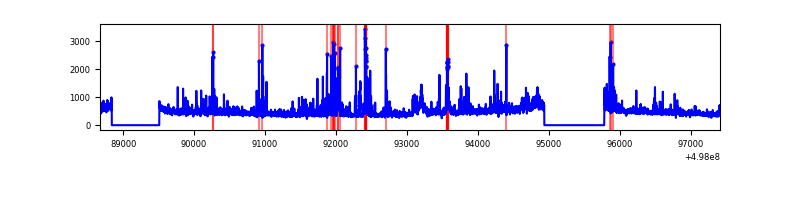 |
| C | 8737 | 7224 | 1141 | 1141 | 13.06% | 15.79% | 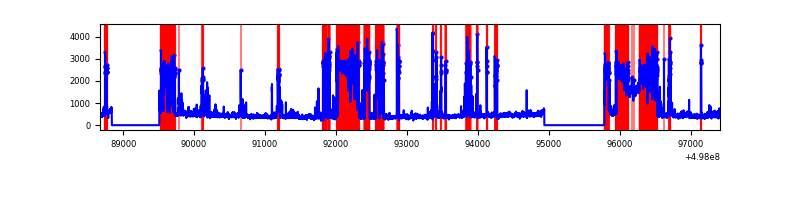 |
| D | 8736 | 7223 | 4199 | 4199 | 48.07% | 58.13% | 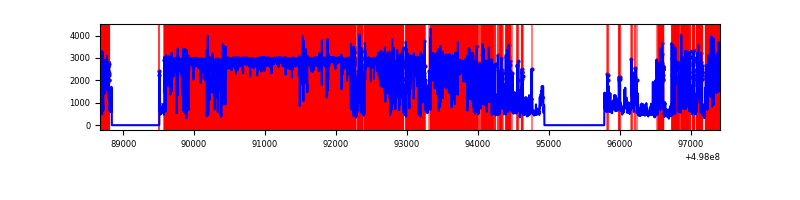 |
Top three noisy pixels from each quadrant. If the there are fewer than three noisy pixels in the level2.evt file, extra rows are filled as -1
| Pixel properties | Quadrant properties | ||||||
|---|---|---|---|---|---|---|---|
| Quadrant | DetID | PixID | Counts | Sigma | Mean | Median | Sigma |
| A | 7 | 14 | 137461 | 729.63 | 760 | 743 | 187.4 |
| A | 5 | 243 | 93077 | 492.76 | 760 | 743 | 187.4 |
| A | 12 | 115 | 59786 | 315.1 | 760 | 743 | 187.4 |
| B | 4 | 171 | 290511 | 1797.67 | 755 | 728 | 161.2 |
| B | 7 | 0 | 183576 | 1134.3 | 755 | 728 | 161.2 |
| B | 0 | 171 | 105006 | 646.89 | 755 | 728 | 161.2 |
| C | 1 | 241 | 3163935 | 16562.97 | 694 | 687 | 191.0 |
| C | 14 | 254 | 121673 | 633.49 | 694 | 687 | 191.0 |
| C | 15 | 147 | 112520 | 585.56 | 694 | 687 | 191.0 |
| D | 15 | 108 | 9475148 | 68416.88 | 485 | 462 | 138.5 |
| D | 8 | 176 | 2020641 | 14587.75 | 485 | 462 | 138.5 |
| D | 3 | 12 | 826550 | 5965.2 | 485 | 462 | 138.5 |
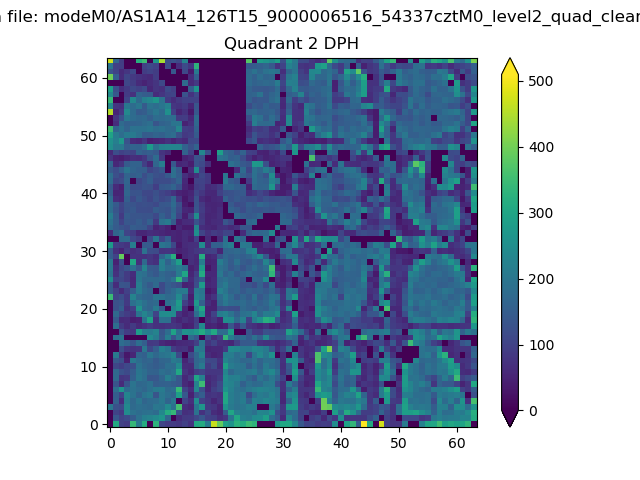
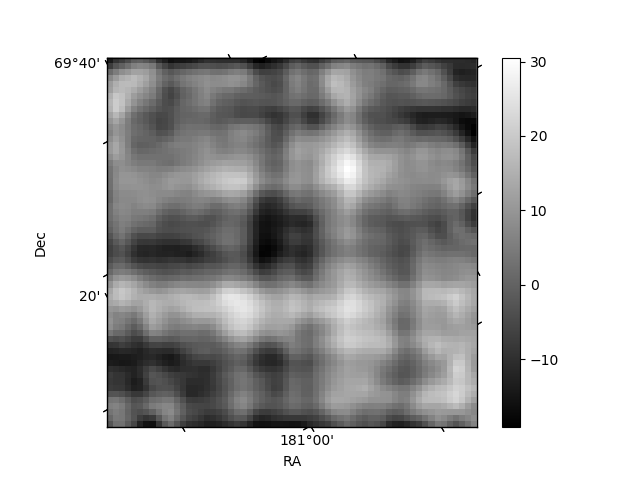
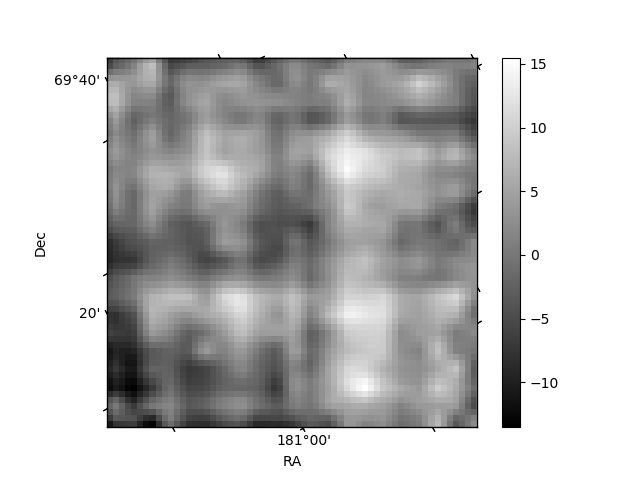
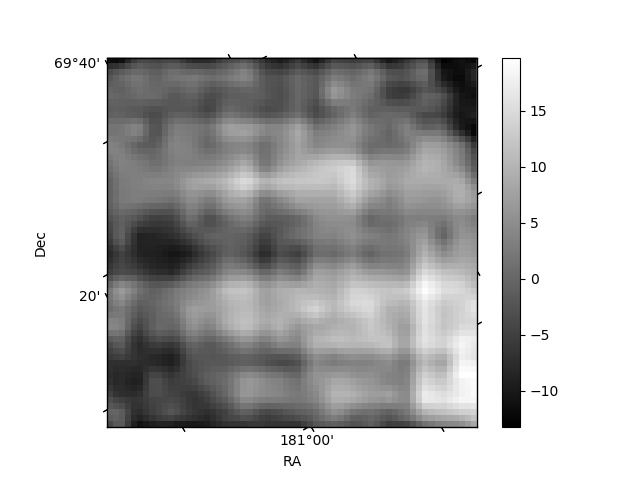
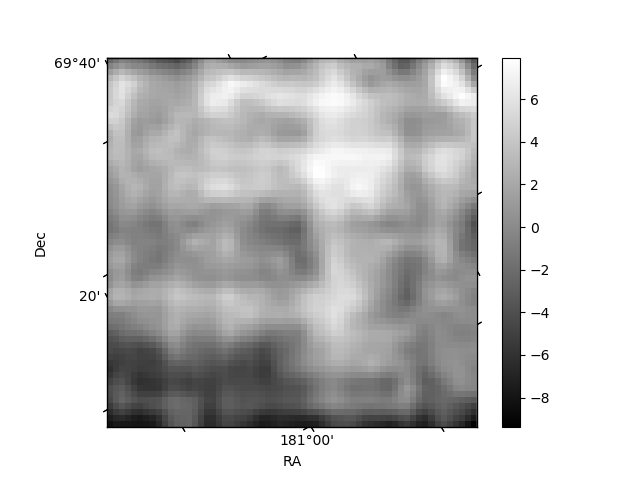
Histogram calculated using DETX and DETY for each event in the final _common_clean file
| Quadrant A | 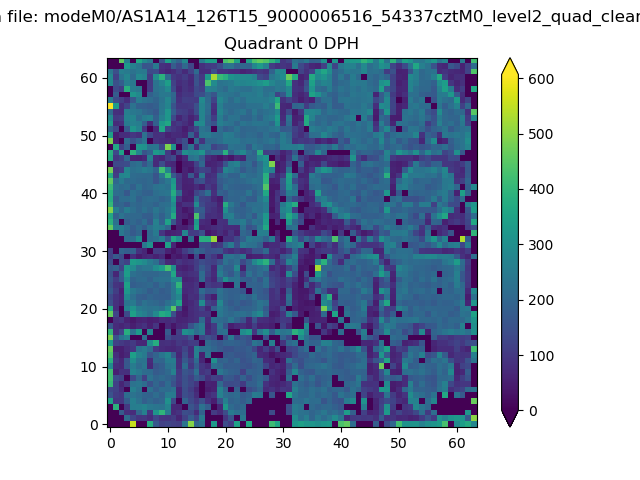 |
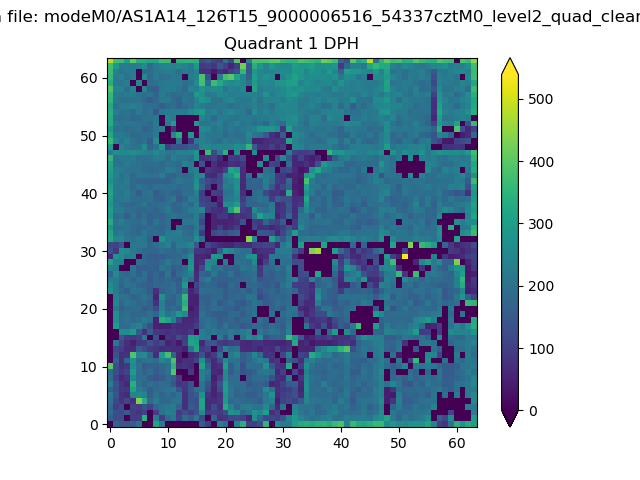 |
Quadrant B |
|---|---|---|---|
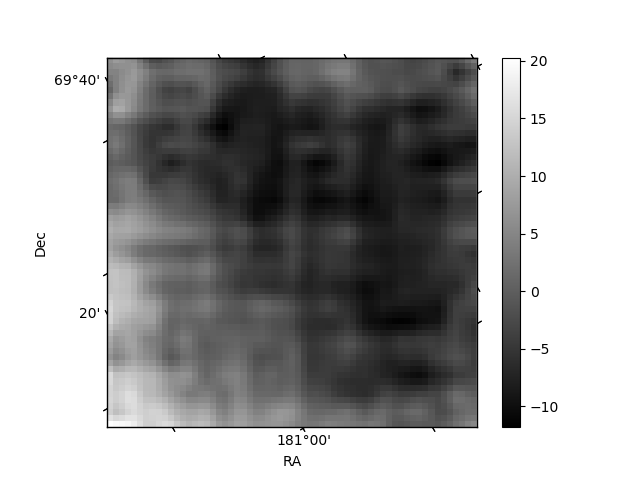
| Quadrant D | 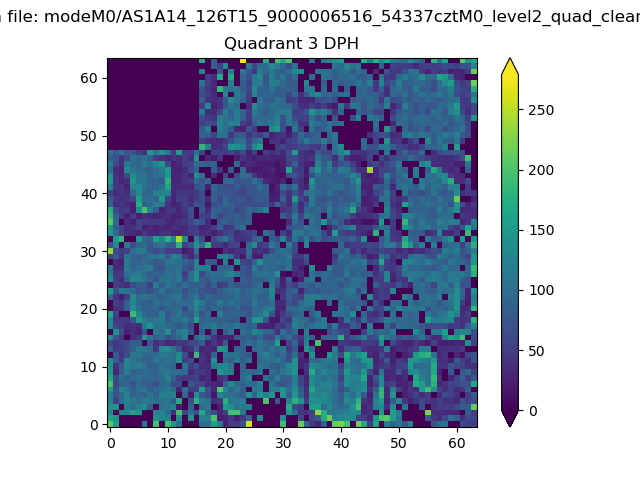 |
 |
Quadrant C |
| Plot type | Count rate plots | Images |
|---|---|---|
| Comparison with Poisson distribution Blue bars denote a histogram of data divided into 1 sec bins. Red curve is a Poisson curve with rate = median count rate of data. |
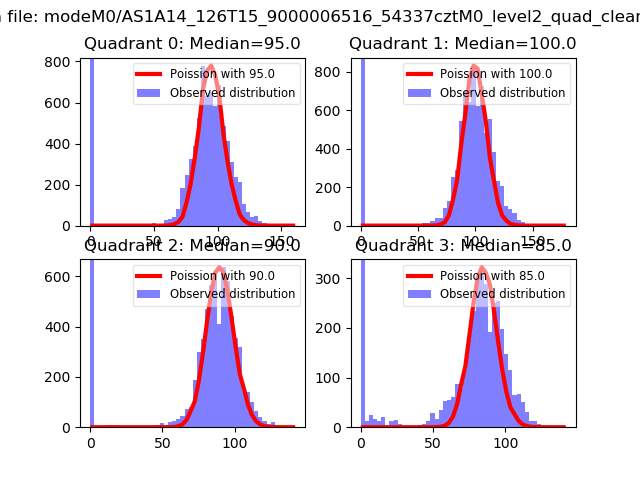 |
 |
| Quadrant-wise count rates Data is divided into 100 sec bins |
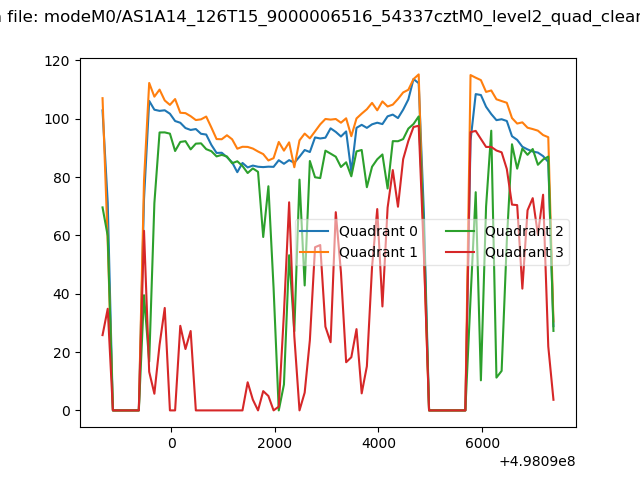 |
|
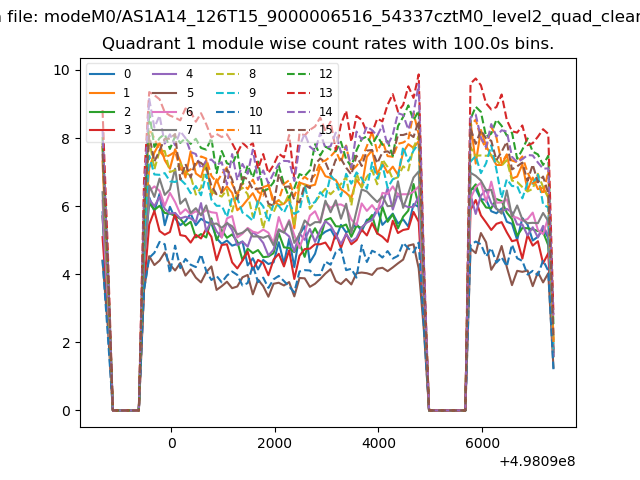
| Module-wise count rates for Quadrant A Data is divided into 100 sec bins |
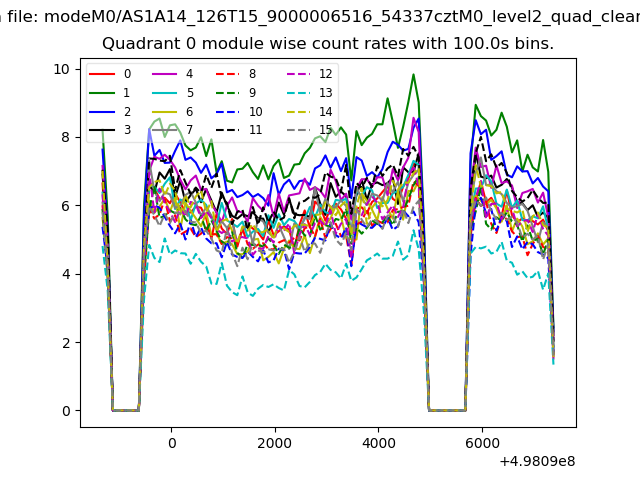 |
 |
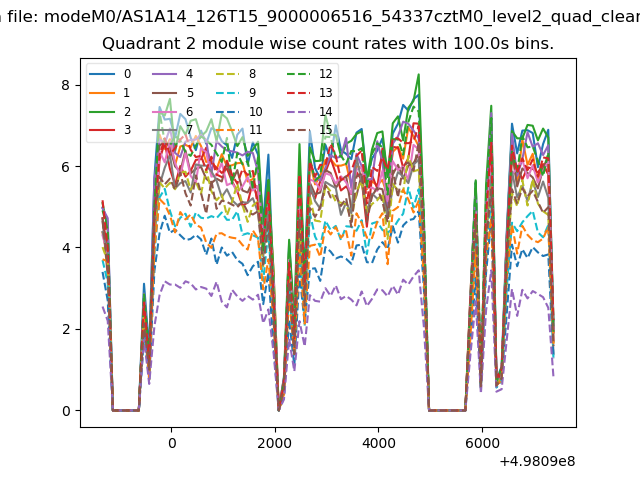
| Module-wise count rates for Quadrant B Data is divided into 100 sec bins |
 |
 |
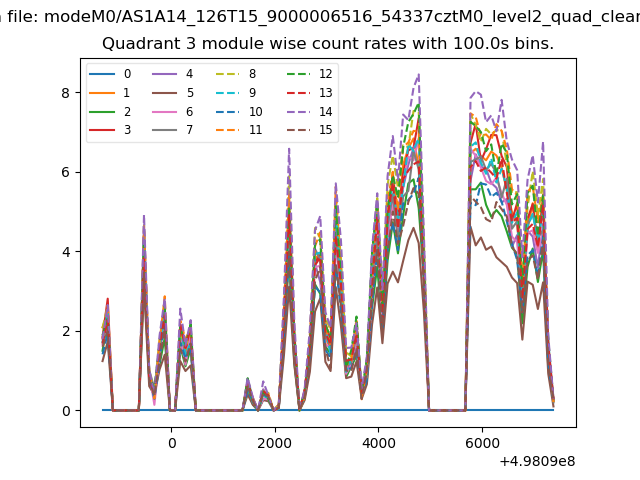
| Module-wise count rates for Quadrant C Data is divided into 100 sec bins |
 |
 |
| Module-wise count rates for Quadrant D Data is divided into 100 sec bins |
 |
 |
| Parameter | Plot |
|---|---|
| CZT HV Monitor | 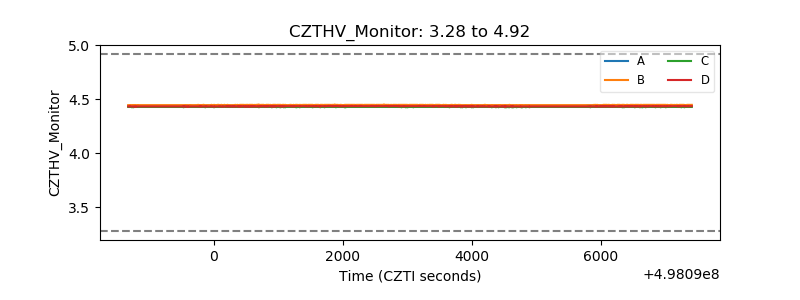 |
| D_VDD | 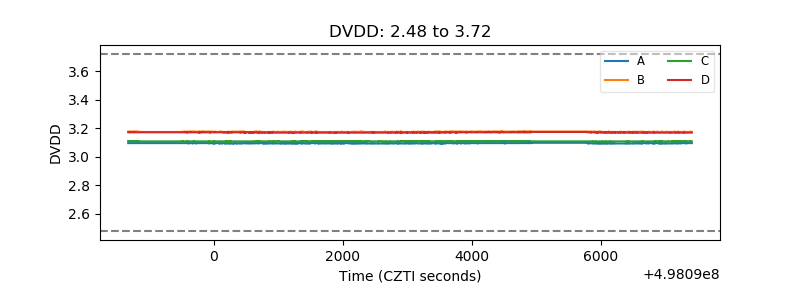 |
| Temperature 1 | 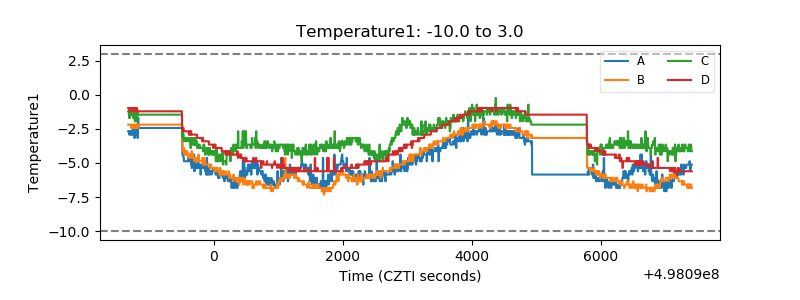 |
| Veto HV Monitor | 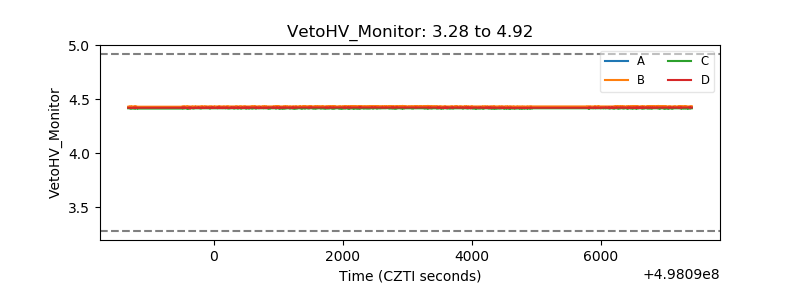 |
| Veto LLD | 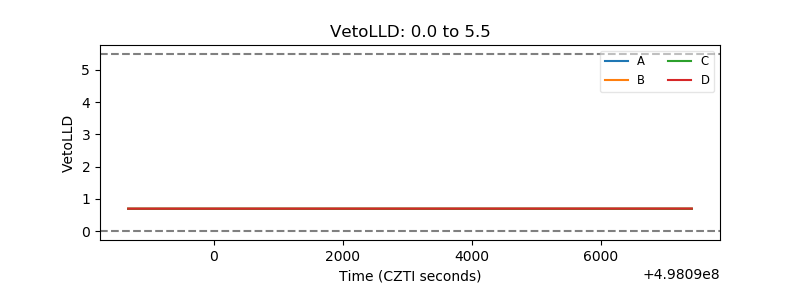 |
| Alpha Counter | 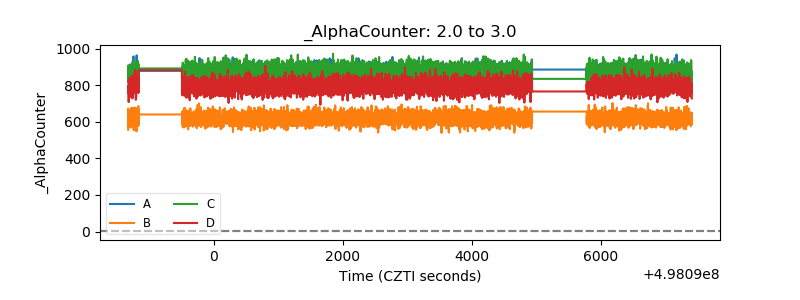 |
| _CPM_Rate | 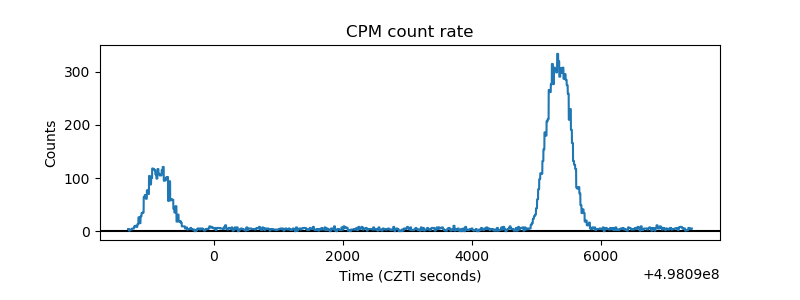 |
| CZT Counter | 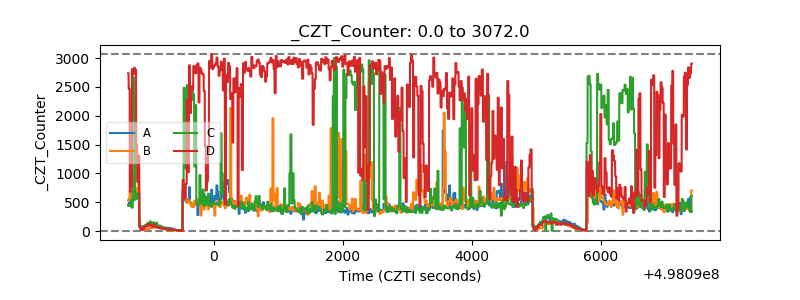 |
| +2.5 Volts monitor |  |
| +5 Volts monitor |  |
| _ROLL_ROT | 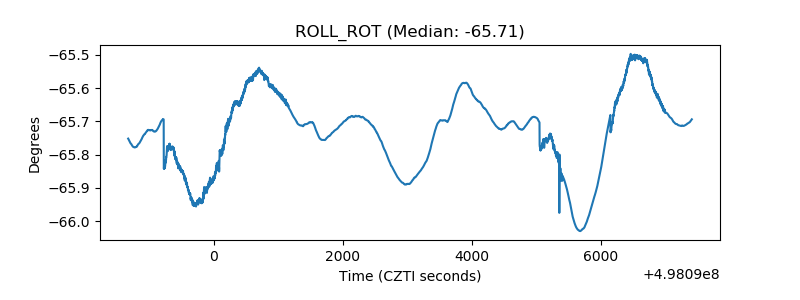 |
| _Roll_DEC | 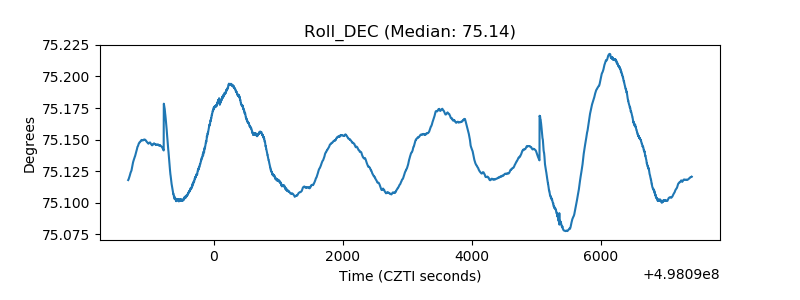 |
| _Roll_RA | 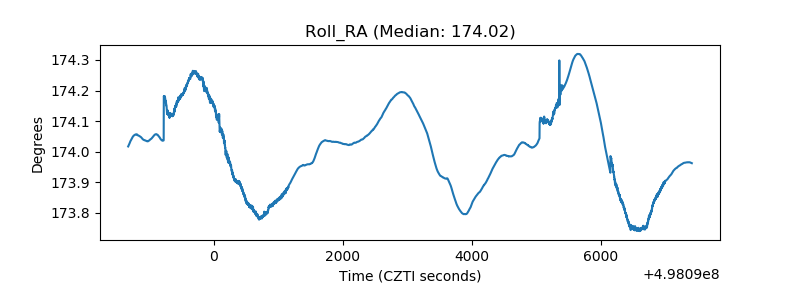 |
| Veto Counter | 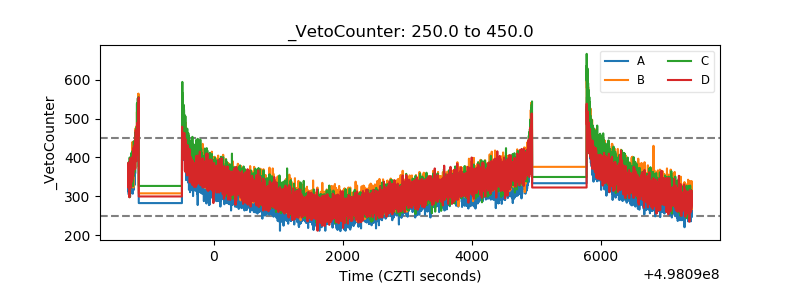 |