| Param | Original file | Final file |
|---|---|---|
| Filename | modeM0/AS1A14_126T15_9000006516_54339cztM0_level2.fits | modeM0/AS1A14_126T15_9000006516_54339cztM0_level2_quad_clean.evt |
| Size (bytes) | 782,841,600 | 83,952,000 |
| Size | 746.6 MB | 80.1 MB |
| Events in quadrant A | 3,255,016 | 647,239 |
| Events in quadrant B | 3,685,386 | 692,857 |
| Events in quadrant C | 7,641,616 | 482,798 |
| Events in quadrant D | 13,866,613 | 242,667 |
| Mode SS | |||
|---|---|---|---|
| Quadrant | BADHDUFLAG | Total packets | Discarded packets |
| A | 0 | 140 | 0 |
| B | 0 | 140 | 0 |
| C | 0 | 140 | 0 |
| D | 0 | 140 | 0 |
| Mode M0 | |||
|---|---|---|---|
| Quadrant | BADHDUFLAG | Total packets | Discarded packets |
| A | 0 | 14790 | 2 |
| B | 0 | 15738 | 2 |
| C | 0 | 27829 | 2 |
| D | 0 | 45826 | 2 |
| Mode M9 | |||
|---|---|---|---|
| Quadrant | BADHDUFLAG | Total packets | Discarded packets |
| A | 0 | 16 | 0 |
| B | 0 | 16 | 0 |
| C | 0 | 17 | 0 |
| D | 0 | 17 | 0 |
| Quadrant | Total seconds | Saturated seconds | Saturation percentage |
|---|---|---|---|
| A | 6828 | 60 | 0.878735% |
| B | 6828 | 86 | 1.259520% |
| C | 6828 | 1686 | 24.692443% |
| D | 6827 | 4276 | 62.633660% |
Noise dominated data is calculated using 1-second bins in cleaned event files. If a bin has >2000 counts, and if more than 50% of those come from <1% of pixels, then it is considered to be noise-dominated and hence unusable.
| Quadrant | # 1 sec bins | Bins with >0 counts | Bins with >2000 counts | High rate bins dominated by noise | Noise dominated (total time) | Noise dominated (detector-on time) | Marked lightcurve |
|---|---|---|---|---|---|---|---|
| A | 7838 | 6829 | 34 | 34 | 0.43% | 0.50% | 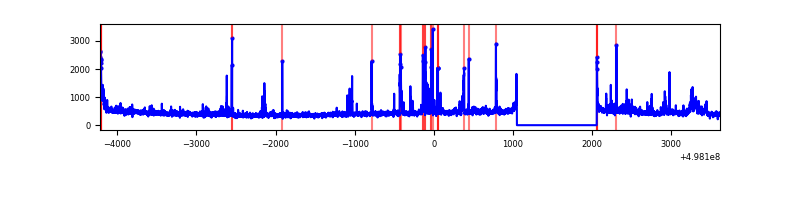 |
| B | 7838 | 6829 | 32 | 32 | 0.41% | 0.47% | 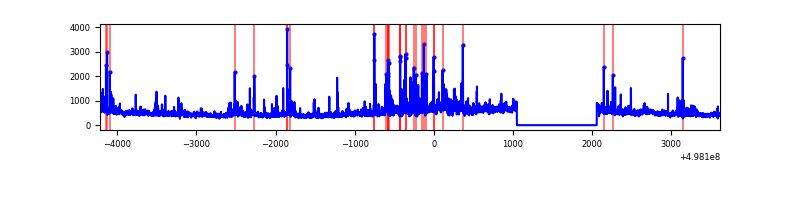 |
| C | 7838 | 6829 | 1611 | 1611 | 20.55% | 23.59% | 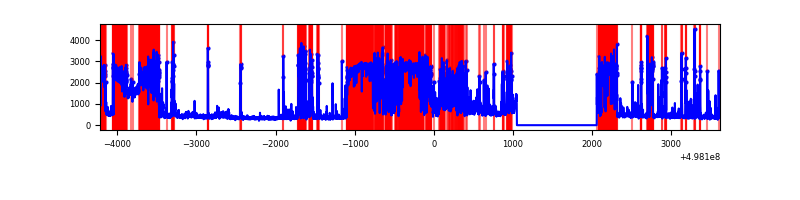 |
| D | 7836 | 6826 | 4138 | 4138 | 52.81% | 60.62% | 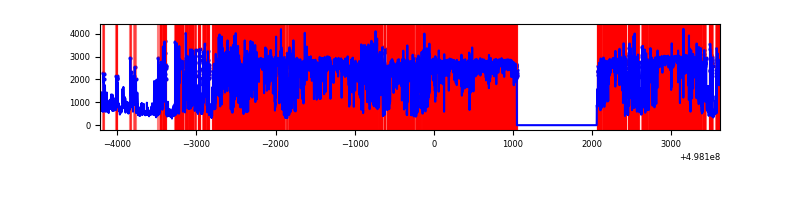 |
Top three noisy pixels from each quadrant. If the there are fewer than three noisy pixels in the level2.evt file, extra rows are filled as -1
| Pixel properties | Quadrant properties | ||||||
|---|---|---|---|---|---|---|---|
| Quadrant | DetID | PixID | Counts | Sigma | Mean | Median | Sigma |
| A | 12 | 115 | 155538 | 888.29 | 710 | 693 | 174.3 |
| A | 7 | 29 | 114950 | 655.45 | 710 | 693 | 174.3 |
| A | 7 | 14 | 72494 | 411.9 | 710 | 693 | 174.3 |
| B | 7 | 0 | 455007 | 2967.17 | 707 | 682 | 153.1 |
| B | 10 | 247 | 121462 | 788.81 | 707 | 682 | 153.1 |
| B | 1 | 223 | 96693 | 627.04 | 707 | 682 | 153.1 |
| C | 1 | 241 | 3627854 | 21549.01 | 611 | 605 | 168.3 |
| C | 15 | 147 | 1472449 | 8744.03 | 611 | 605 | 168.3 |
| C | 14 | 254 | 91465 | 539.79 | 611 | 605 | 168.3 |
| D | 8 | 176 | 6476751 | 54272.05 | 414 | 395 | 119.3 |
| D | 15 | 108 | 4022673 | 33706.81 | 414 | 395 | 119.3 |
| D | 3 | 12 | 1445110 | 12106.75 | 414 | 395 | 119.3 |
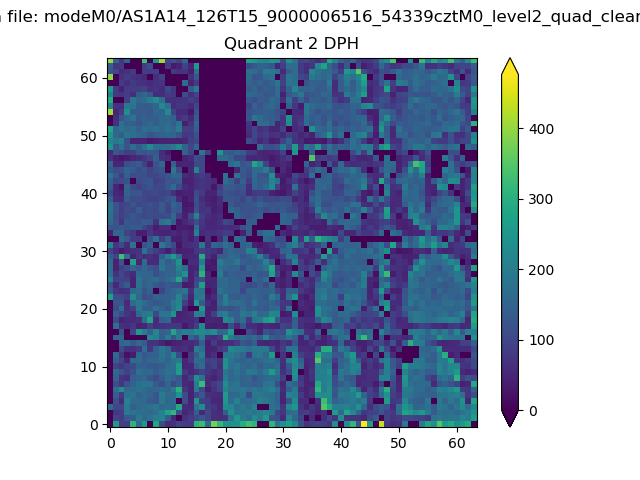
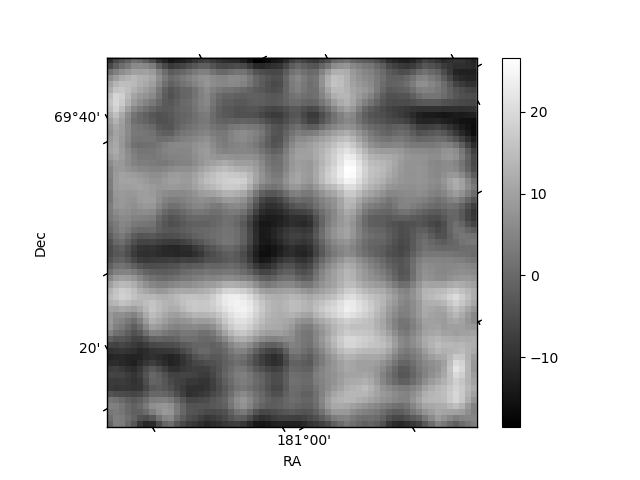
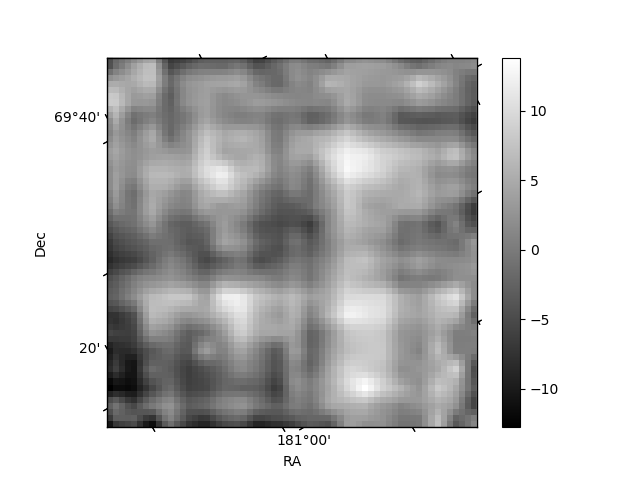
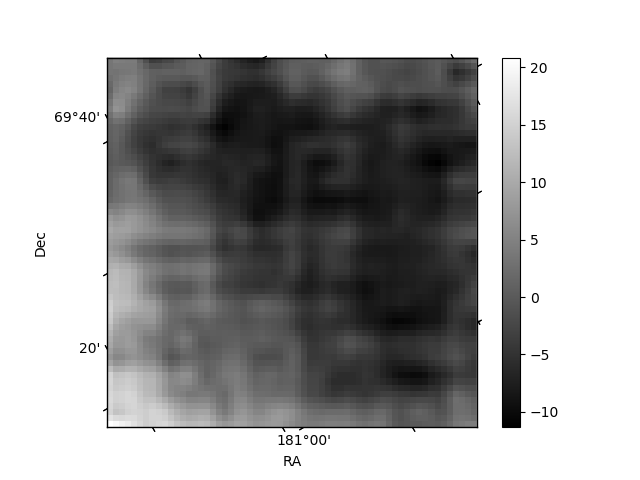
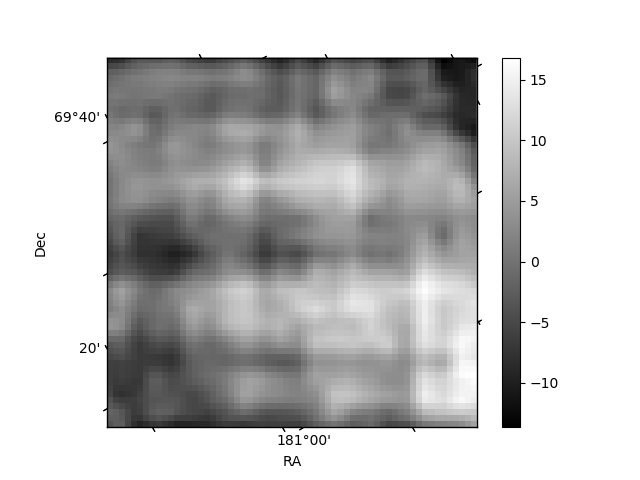
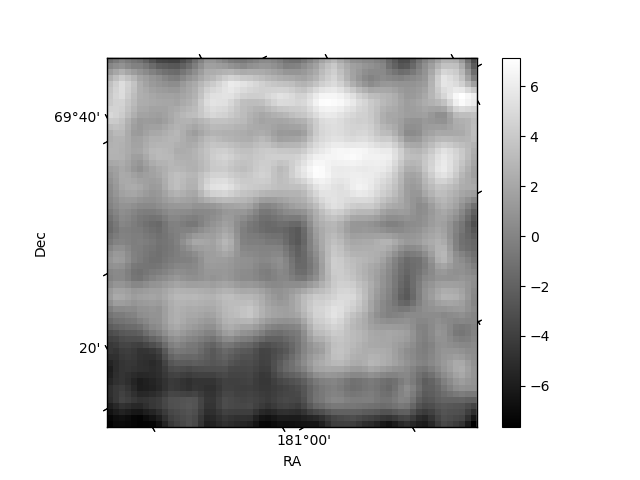
Histogram calculated using DETX and DETY for each event in the final _common_clean file
| Quadrant A | 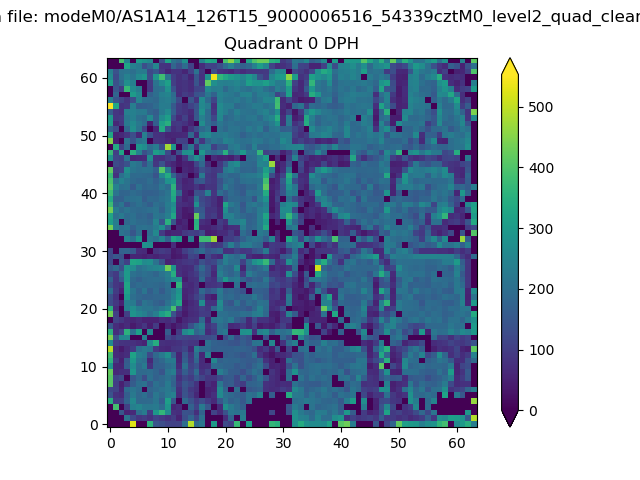 |
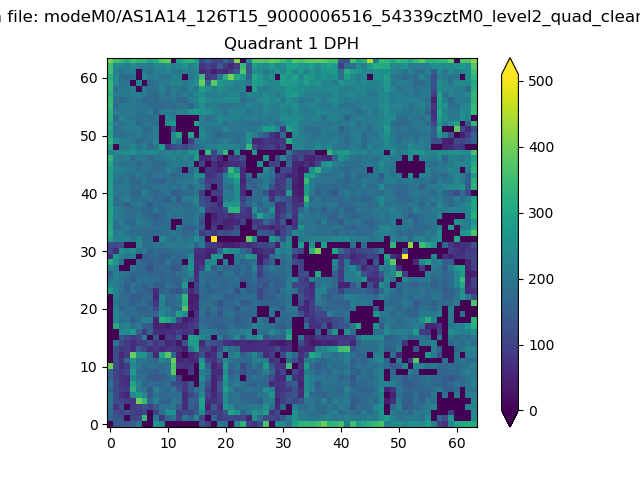 |
Quadrant B |
|---|---|---|---|
| Quadrant D | 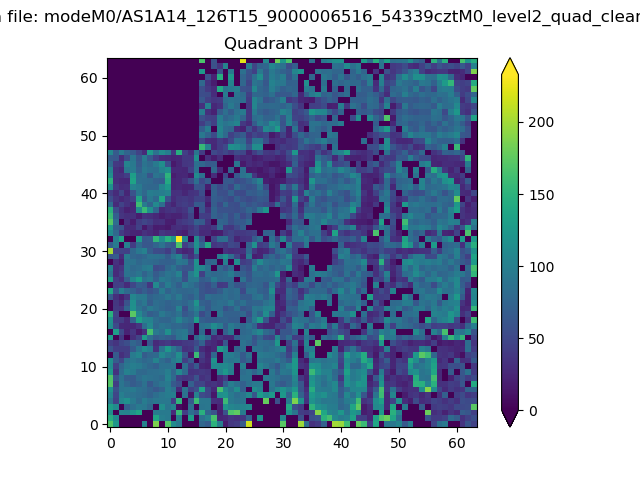 |
 |
Quadrant C |
| Plot type | Count rate plots | Images |
|---|---|---|
| Comparison with Poisson distribution Blue bars denote a histogram of data divided into 1 sec bins. Red curve is a Poisson curve with rate = median count rate of data. |
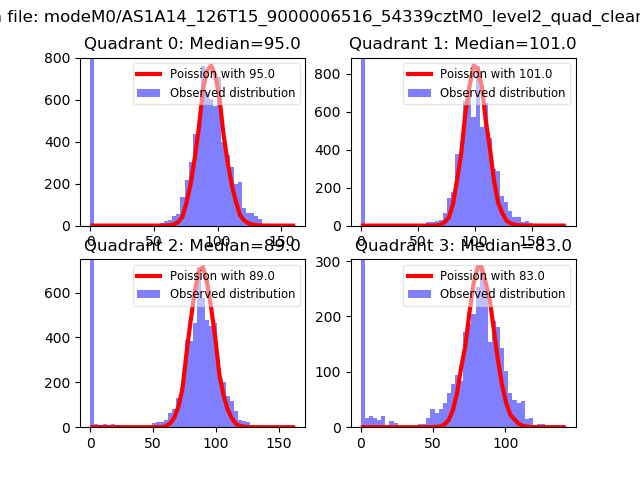 |
 |
| Quadrant-wise count rates Data is divided into 100 sec bins |
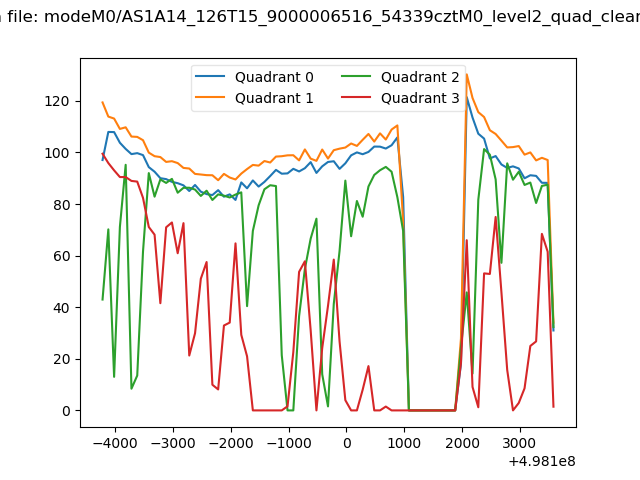 |
|
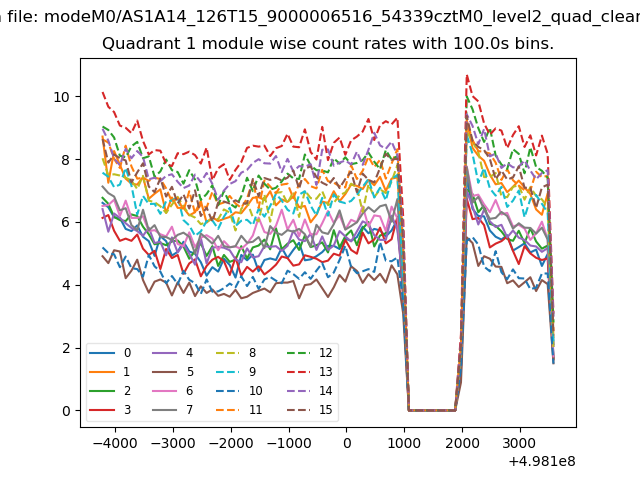
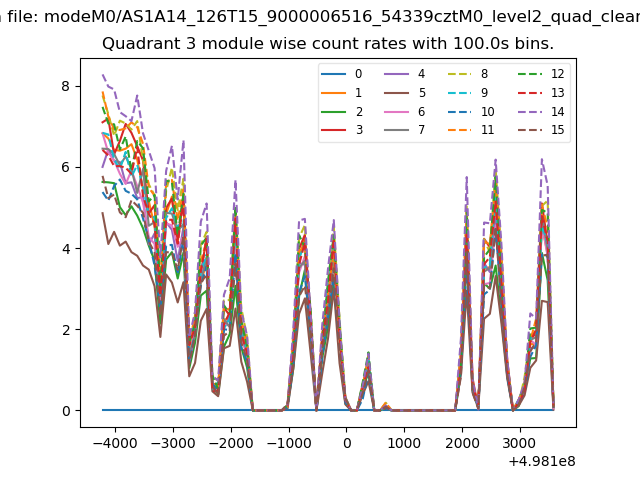
| Module-wise count rates for Quadrant A Data is divided into 100 sec bins |
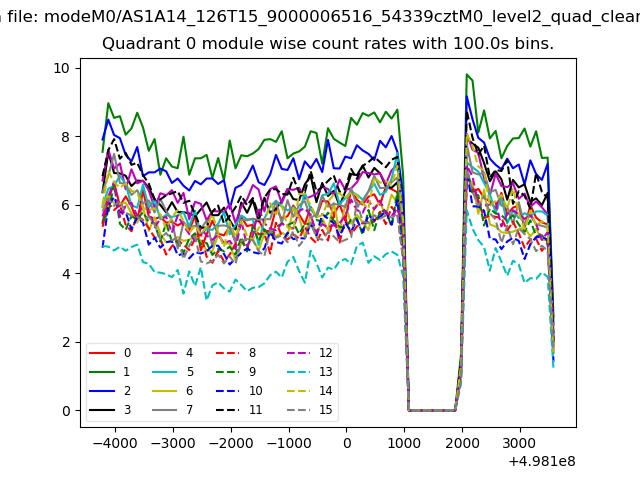 |
 |
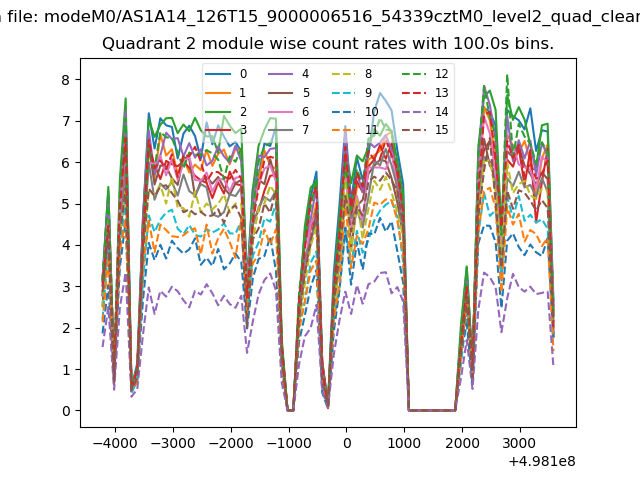
| Module-wise count rates for Quadrant B Data is divided into 100 sec bins |
 |
 |
| Module-wise count rates for Quadrant C Data is divided into 100 sec bins |
 |
 |
| Module-wise count rates for Quadrant D Data is divided into 100 sec bins |
 |
 |
| Parameter | Plot |
|---|---|
| CZT HV Monitor | 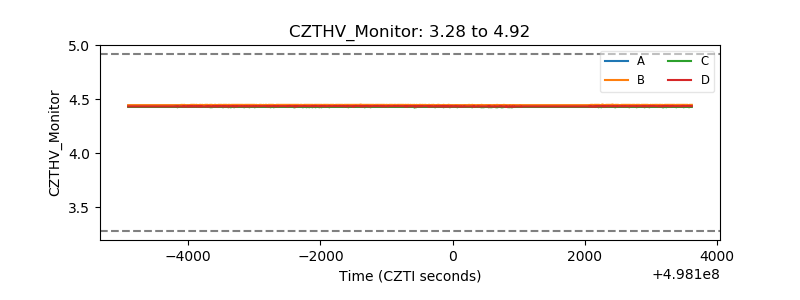 |
| D_VDD | 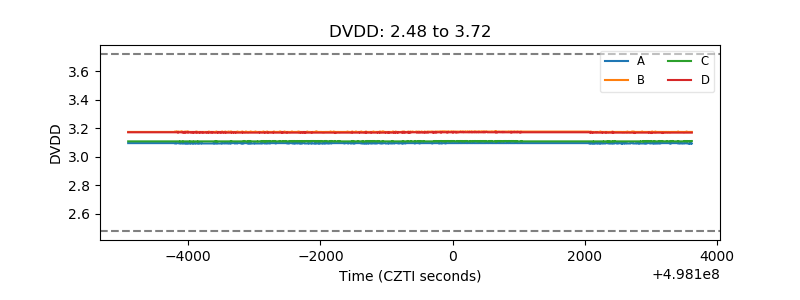 |
| Temperature 1 | 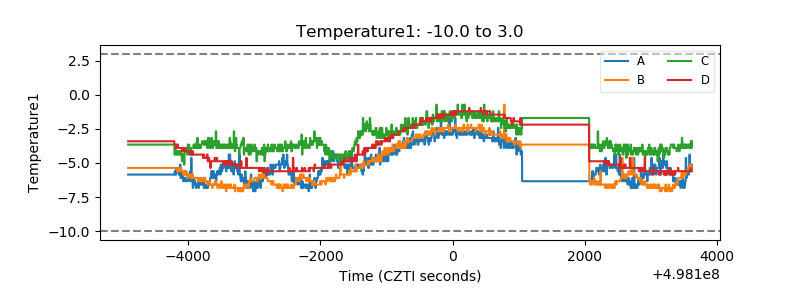 |
| Veto HV Monitor | 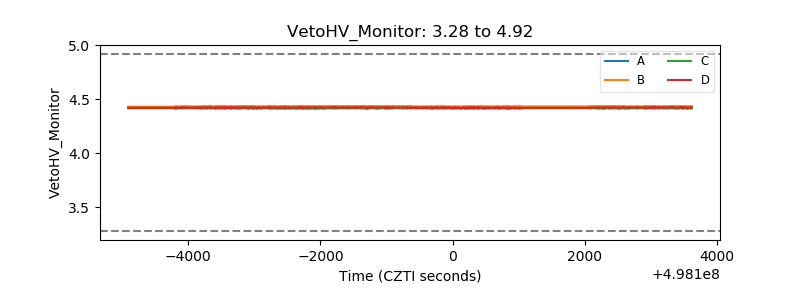 |
| Veto LLD | 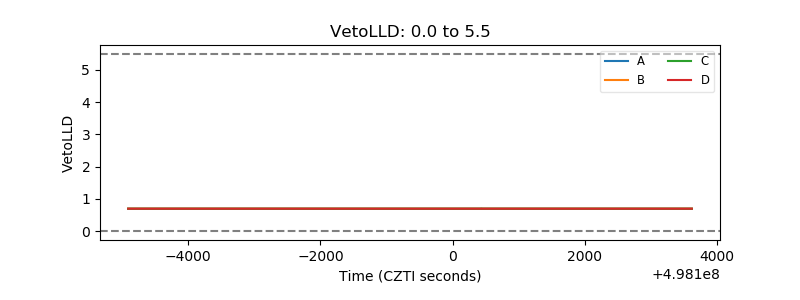 |
| Alpha Counter | 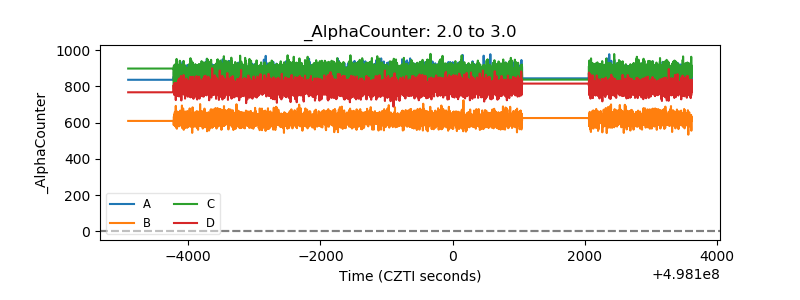 |
| _CPM_Rate | 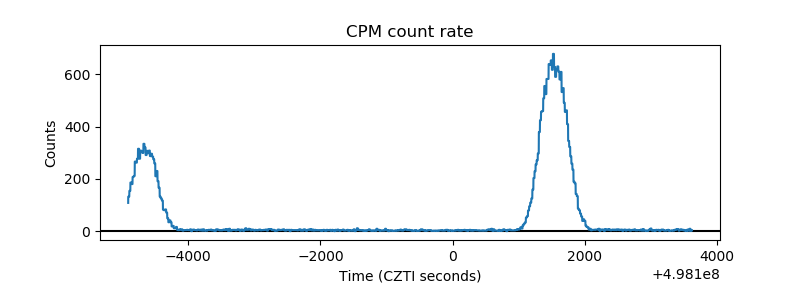 |
| CZT Counter | 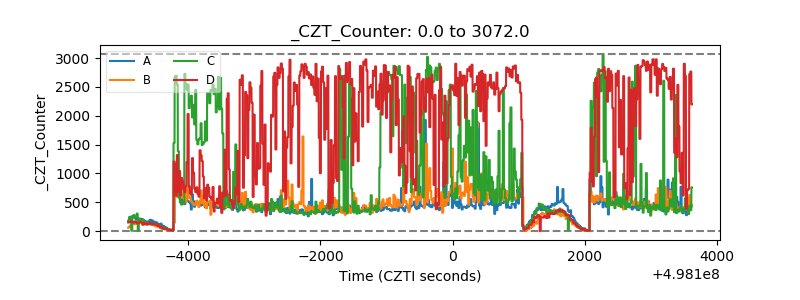 |
| +2.5 Volts monitor | 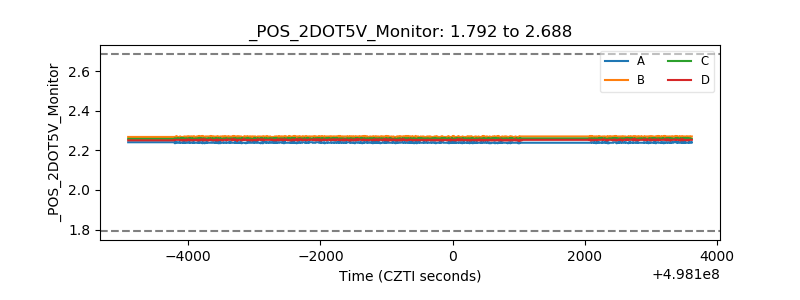 |
| +5 Volts monitor | 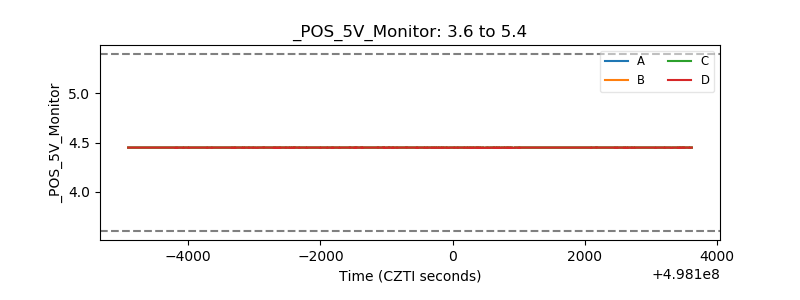 |
| _ROLL_ROT | 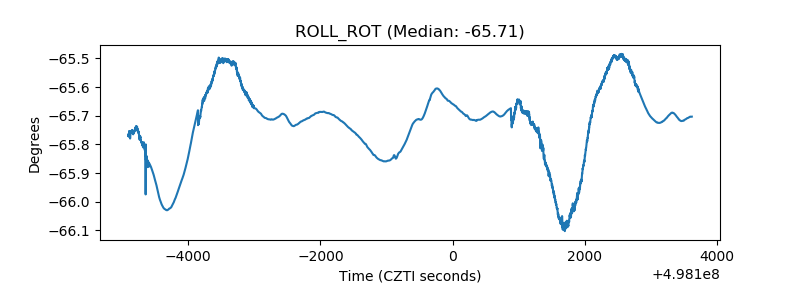 |
| _Roll_DEC | 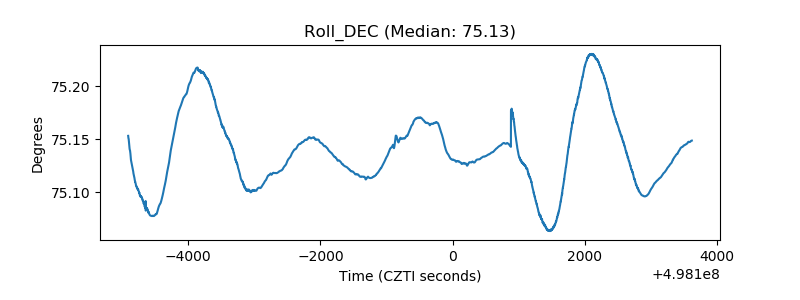 |
| _Roll_RA | 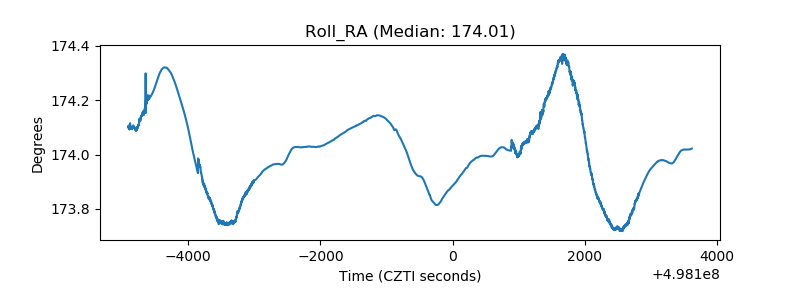 |
| Veto Counter | 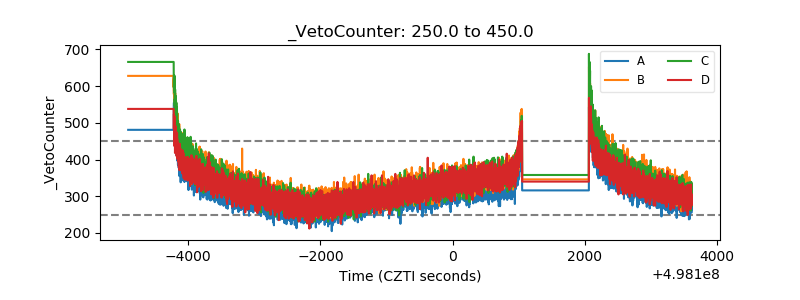 |