| Param | Original file | Final file |
|---|---|---|
| Filename | modeM0/AS1A14_126T15_9000006516_54340cztM0_level2.fits | modeM0/AS1A14_126T15_9000006516_54340cztM0_level2_quad_clean.evt |
| Size (bytes) | 847,416,960 | 76,487,040 |
| Size | 808.2 MB | 72.9 MB |
| Events in quadrant A | 2,978,477 | 637,439 |
| Events in quadrant B | 3,906,207 | 670,881 |
| Events in quadrant C | 9,824,661 | 382,689 |
| Events in quadrant D | 14,151,616 | 168,227 |
| Mode SS | |||
|---|---|---|---|
| Quadrant | BADHDUFLAG | Total packets | Discarded packets |
| A | 0 | 132 | 0 |
| B | 0 | 132 | 0 |
| C | 0 | 132 | 0 |
| D | 0 | 132 | 0 |
| Mode M0 | |||
|---|---|---|---|
| Quadrant | BADHDUFLAG | Total packets | Discarded packets |
| A | 0 | 13783 | 2 |
| B | 0 | 15885 | 2 |
| C | 0 | 33783 | 2 |
| D | 0 | 46482 | 2 |
| Mode M9 | |||
|---|---|---|---|
| Quadrant | BADHDUFLAG | Total packets | Discarded packets |
| A | 0 | 13 | 0 |
| B | 0 | 13 | 0 |
| C | 0 | 14 | 0 |
| D | 0 | 14 | 0 |
| Quadrant | Total seconds | Saturated seconds | Saturation percentage |
|---|---|---|---|
| A | 6550 | 34 | 0.519084% |
| B | 6550 | 215 | 3.282443% |
| C | 6550 | 2621 | 40.015267% |
| D | 6550 | 4854 | 74.106870% |
Noise dominated data is calculated using 1-second bins in cleaned event files. If a bin has >2000 counts, and if more than 50% of those come from <1% of pixels, then it is considered to be noise-dominated and hence unusable.
| Quadrant | # 1 sec bins | Bins with >0 counts | Bins with >2000 counts | High rate bins dominated by noise | Noise dominated (total time) | Noise dominated (detector-on time) | Marked lightcurve |
|---|---|---|---|---|---|---|---|
| A | 7665 | 6551 | 14 | 14 | 0.18% | 0.21% | 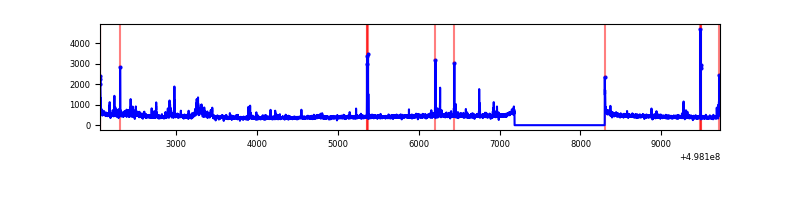 |
| B | 7665 | 6551 | 145 | 145 | 1.89% | 2.21% | 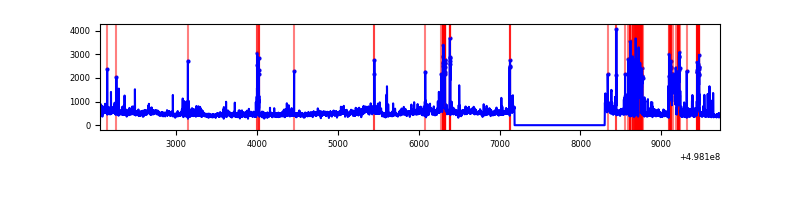 |
| C | 7665 | 6551 | 2596 | 2596 | 33.87% | 39.63% | 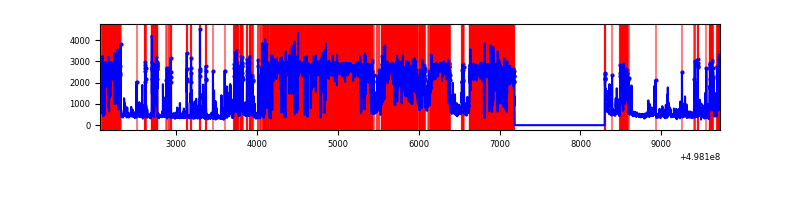 |
| D | 7664 | 6549 | 4428 | 4428 | 57.78% | 67.61% | 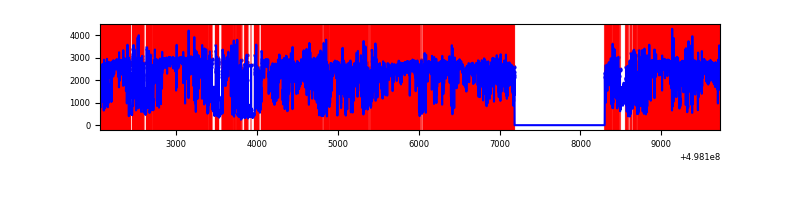 |
Top three noisy pixels from each quadrant. If the there are fewer than three noisy pixels in the level2.evt file, extra rows are filled as -1
| Pixel properties | Quadrant properties | ||||||
|---|---|---|---|---|---|---|---|
| Quadrant | DetID | PixID | Counts | Sigma | Mean | Median | Sigma |
| A | 12 | 115 | 117632 | 692.34 | 686 | 669 | 168.9 |
| A | 8 | 246 | 50548 | 295.25 | 686 | 669 | 168.9 |
| A | 0 | 8 | 35382 | 205.48 | 686 | 669 | 168.9 |
| B | 7 | 0 | 404772 | 2804.18 | 677 | 651 | 144.1 |
| B | 5 | 185 | 350041 | 2424.4 | 677 | 651 | 144.1 |
| B | 10 | 247 | 163961 | 1133.2 | 677 | 651 | 144.1 |
| C | 1 | 241 | 5990485 | 40607.18 | 534 | 529 | 147.5 |
| C | 15 | 147 | 1439456 | 9754.79 | 534 | 529 | 147.5 |
| C | 14 | 254 | 131240 | 886.12 | 534 | 529 | 147.5 |
| D | 8 | 176 | 9299741 | 96945.24 | 333 | 317 | 95.9 |
| D | 15 | 108 | 3360687 | 35031.4 | 333 | 317 | 95.9 |
| D | 3 | 12 | 39988 | 413.56 | 333 | 317 | 95.9 |
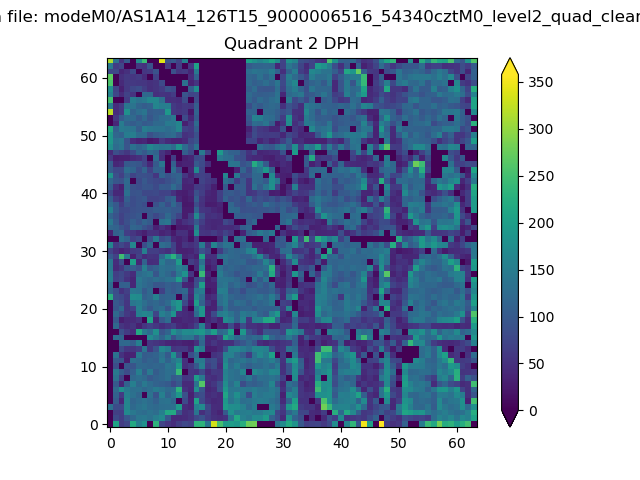
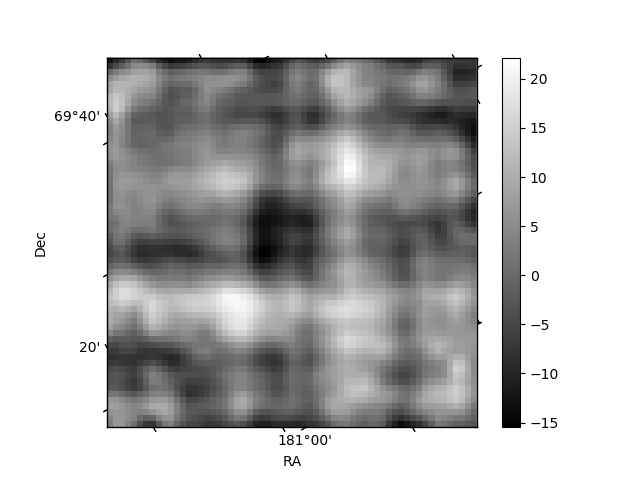
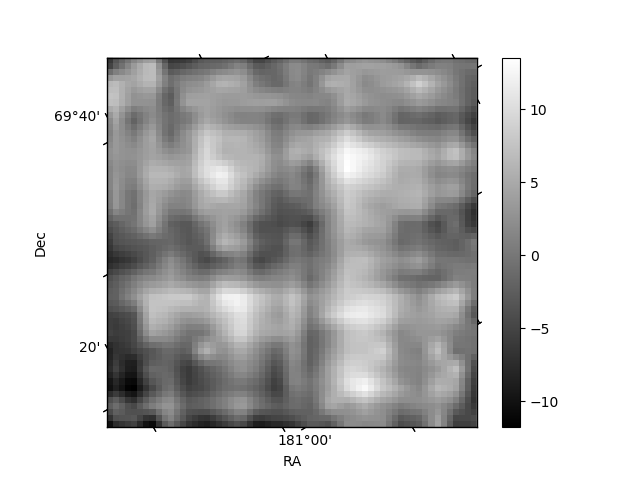
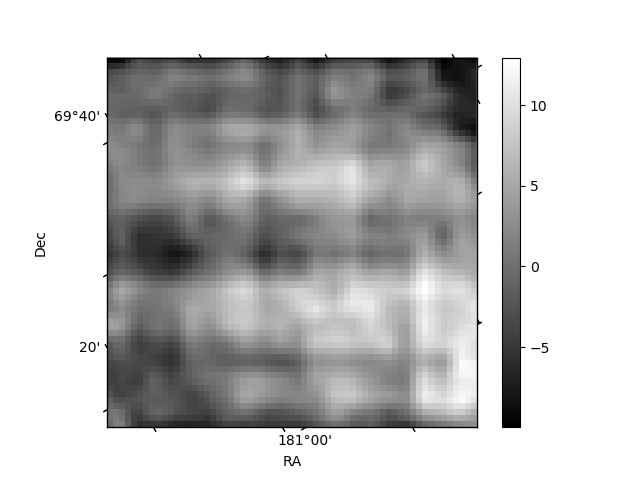
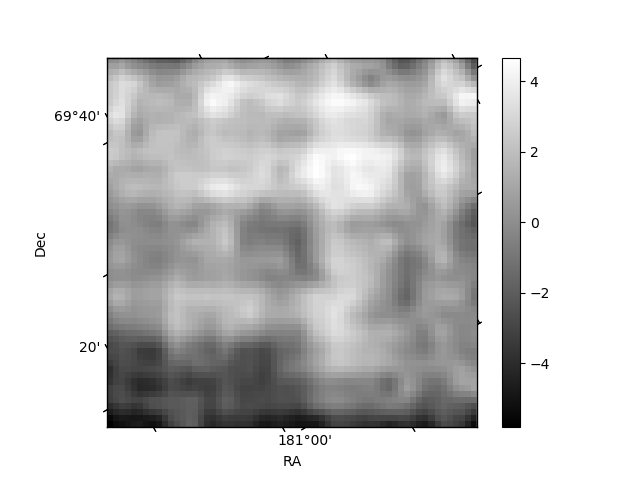
Histogram calculated using DETX and DETY for each event in the final _common_clean file
| Quadrant A | 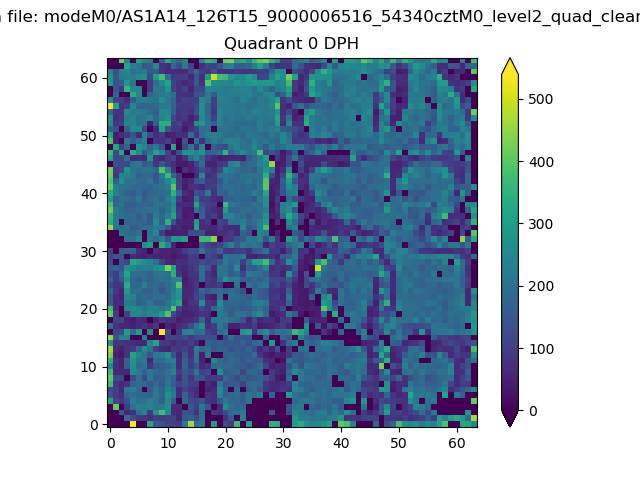 |
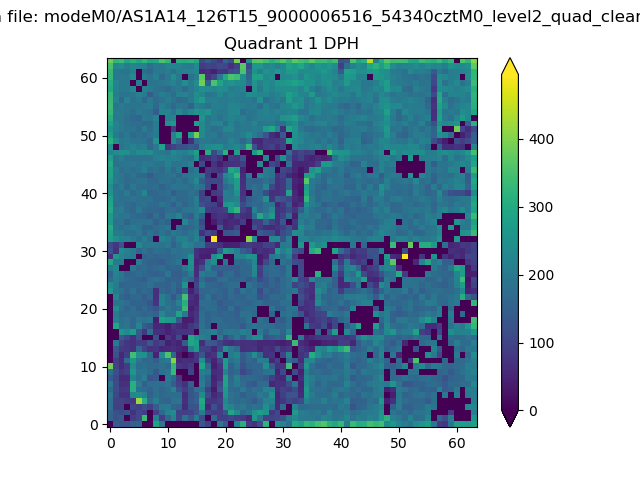 |
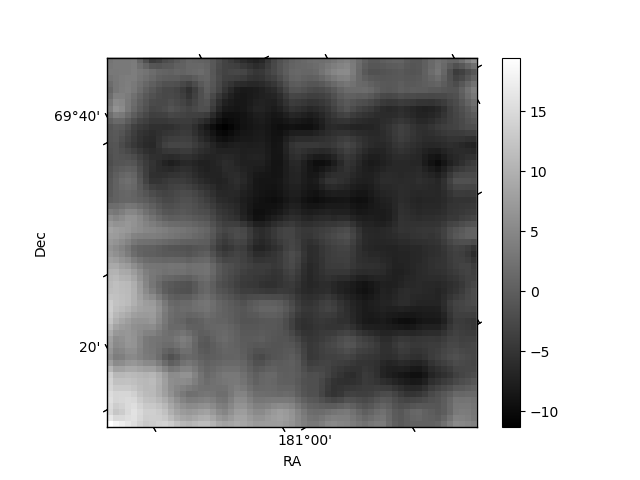
Quadrant B |
|---|---|---|---|
| Quadrant D | 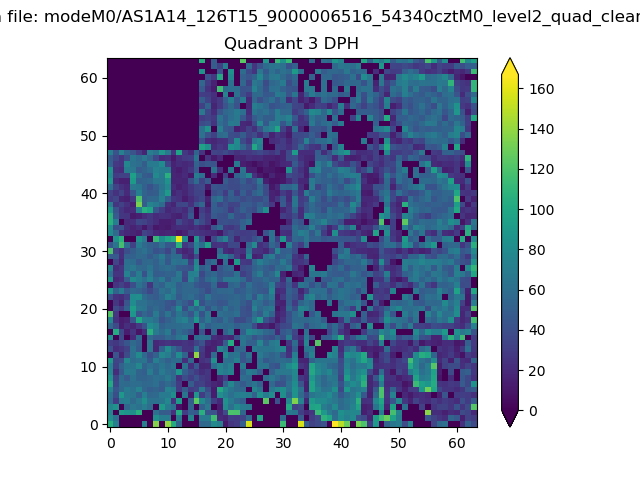 |
 |
Quadrant C |
| Plot type | Count rate plots | Images |
|---|---|---|
| Comparison with Poisson distribution Blue bars denote a histogram of data divided into 1 sec bins. Red curve is a Poisson curve with rate = median count rate of data. |
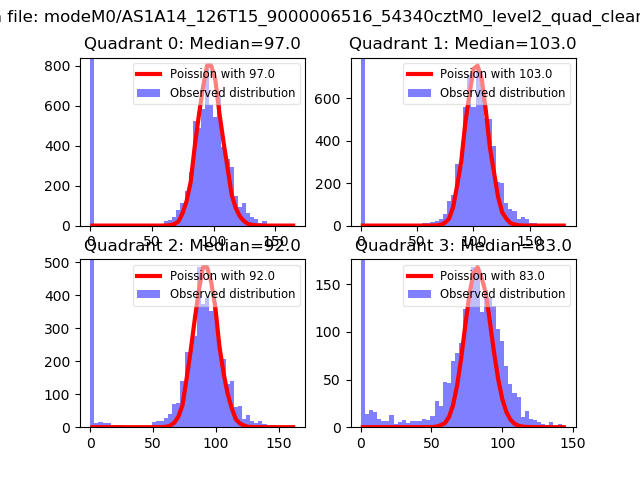 |
 |
| Quadrant-wise count rates Data is divided into 100 sec bins |
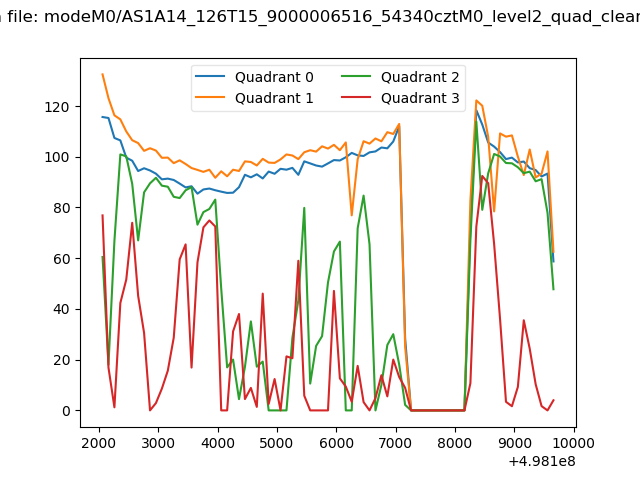 |
|
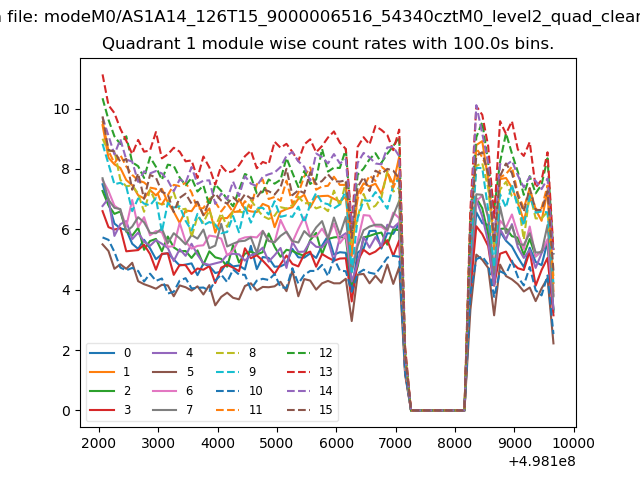
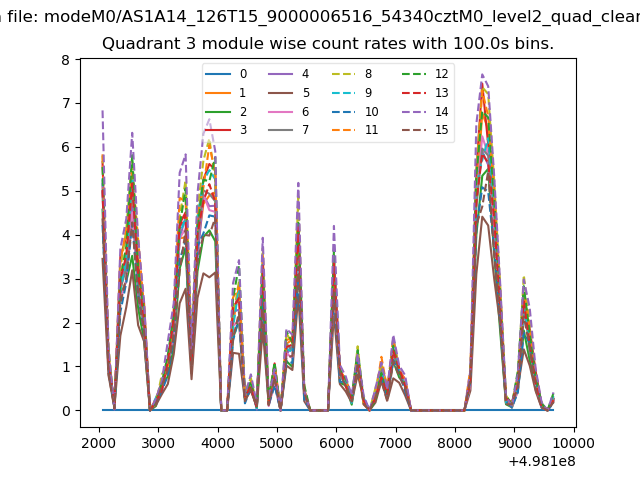
| Module-wise count rates for Quadrant A Data is divided into 100 sec bins |
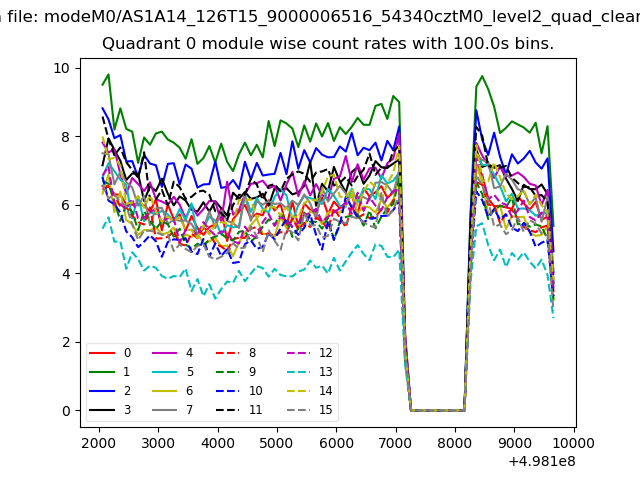 |
 |
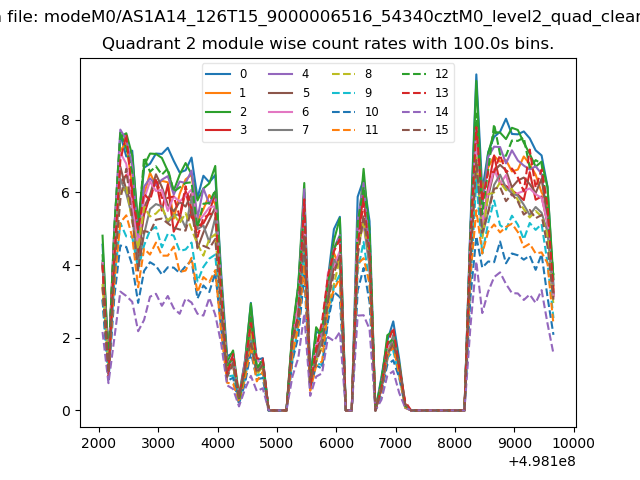
| Module-wise count rates for Quadrant B Data is divided into 100 sec bins |
 |
 |
| Module-wise count rates for Quadrant C Data is divided into 100 sec bins |
 |
 |
| Module-wise count rates for Quadrant D Data is divided into 100 sec bins |
 |
 |
| Parameter | Plot |
|---|---|
| CZT HV Monitor | 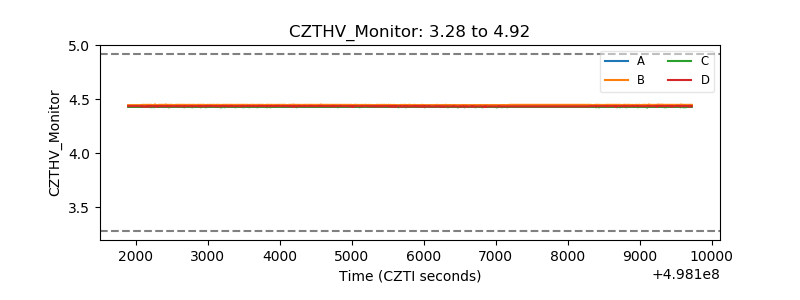 |
| D_VDD | 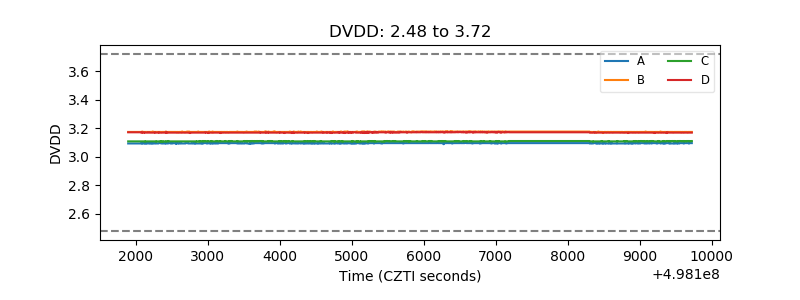 |
| Temperature 1 | 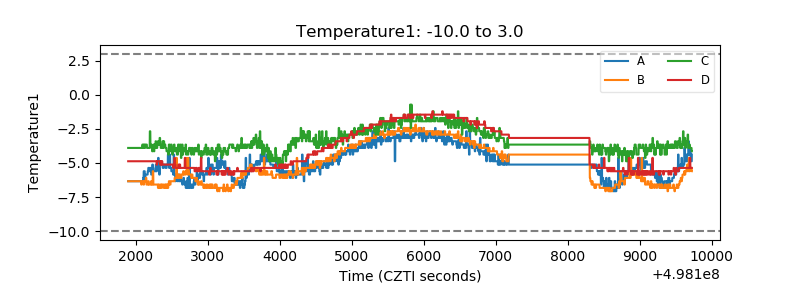 |
| Veto HV Monitor | 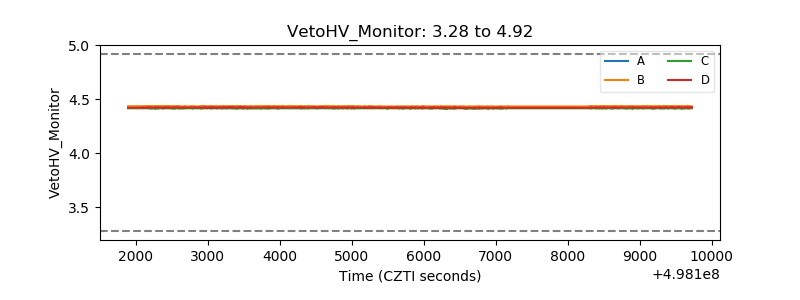 |
| Veto LLD | 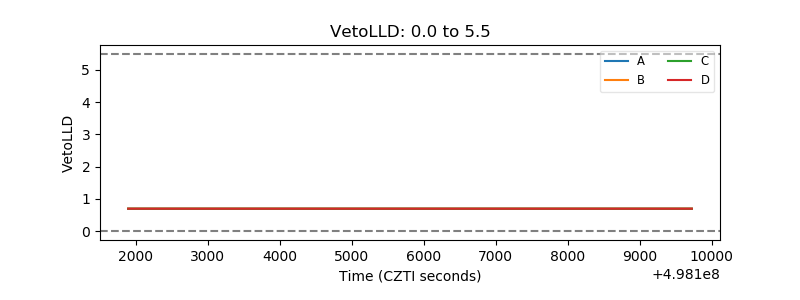 |
| Alpha Counter | 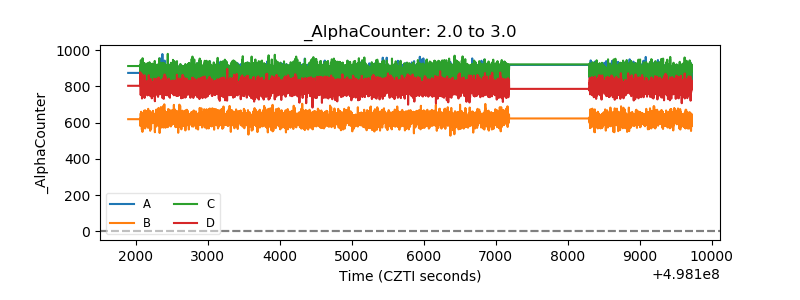 |
| _CPM_Rate | 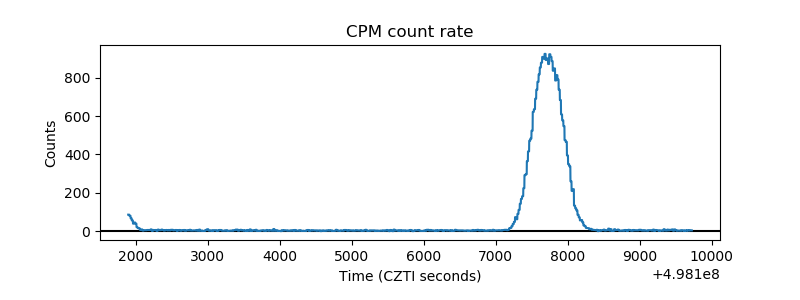 |
| CZT Counter | 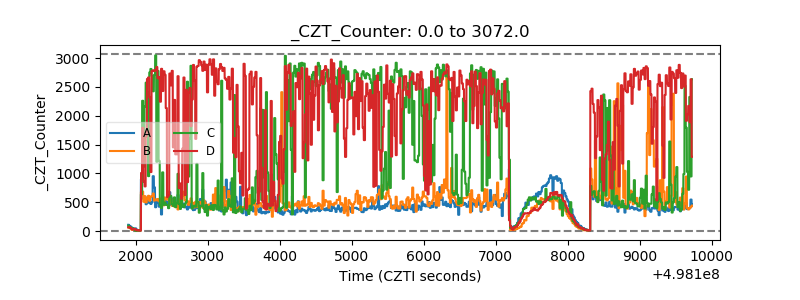 |
| +2.5 Volts monitor |  |
| +5 Volts monitor |  |
| _ROLL_ROT | 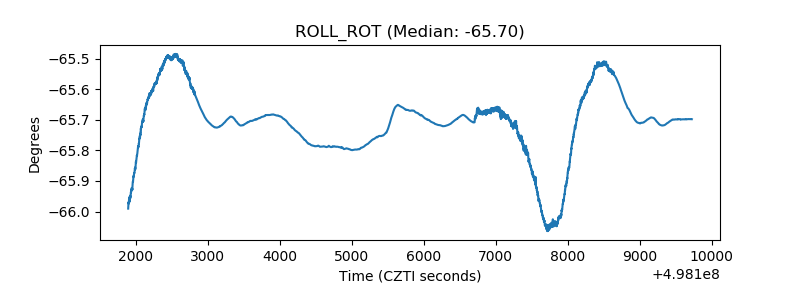 |
| _Roll_DEC | 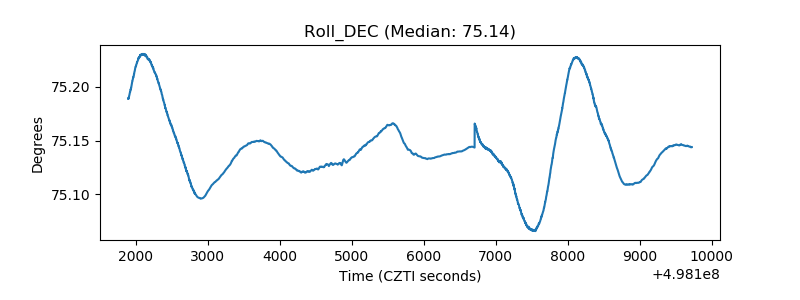 |
| _Roll_RA | 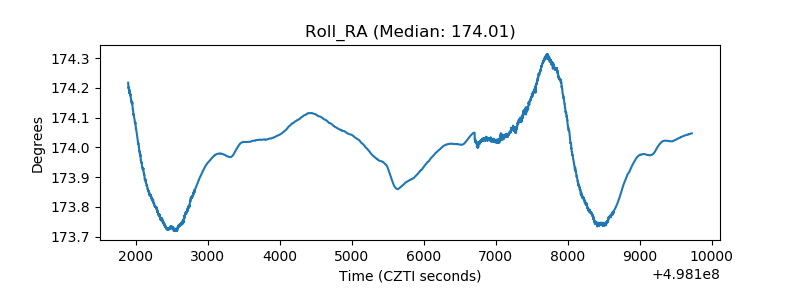 |
| Veto Counter | 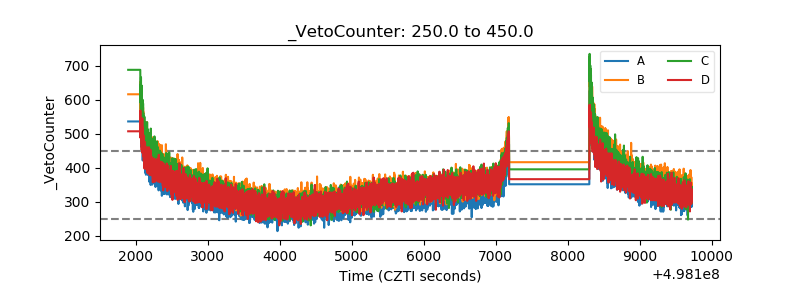 |