| Param | Original file | Final file |
|---|---|---|
| Filename | modeM0/AS1A14_126T15_9000006516_54341cztM0_level2.fits | modeM0/AS1A14_126T15_9000006516_54341cztM0_level2_quad_clean.evt |
| Size (bytes) | 668,148,480 | 84,355,200 |
| Size | 637.2 MB | 80.4 MB |
| Events in quadrant A | 2,947,621 | 640,405 |
| Events in quadrant B | 3,625,976 | 676,571 |
| Events in quadrant C | 5,787,823 | 535,022 |
| Events in quadrant D | 11,873,361 | 255,431 |
| Mode SS | |||
|---|---|---|---|
| Quadrant | BADHDUFLAG | Total packets | Discarded packets |
| A | 0 | 128 | 0 |
| B | 0 | 128 | 0 |
| C | 0 | 128 | 0 |
| D | 0 | 128 | 0 |
| Mode M0 | |||
|---|---|---|---|
| Quadrant | BADHDUFLAG | Total packets | Discarded packets |
| A | 0 | 13539 | 5 |
| B | 0 | 15178 | 2 |
| C | 0 | 21731 | 2 |
| D | 0 | 39719 | 6 |
| Mode M9 | |||
|---|---|---|---|
| Quadrant | BADHDUFLAG | Total packets | Discarded packets |
| A | 0 | 16 | 0 |
| B | 0 | 16 | 0 |
| C | 0 | 17 | 0 |
| D | 0 | 17 | 0 |
| Quadrant | Total seconds | Saturated seconds | Saturation percentage |
|---|---|---|---|
| A | 6408 | 50 | 0.780275% |
| B | 6410 | 187 | 2.917317% |
| C | 6410 | 884 | 13.790952% |
| D | 6409 | 3652 | 56.982369% |
Noise dominated data is calculated using 1-second bins in cleaned event files. If a bin has >2000 counts, and if more than 50% of those come from <1% of pixels, then it is considered to be noise-dominated and hence unusable.
| Quadrant | # 1 sec bins | Bins with >0 counts | Bins with >2000 counts | High rate bins dominated by noise | Noise dominated (total time) | Noise dominated (detector-on time) | Marked lightcurve |
|---|---|---|---|---|---|---|---|
| A | 7585 | 6410 | 24 | 24 | 0.32% | 0.37% | 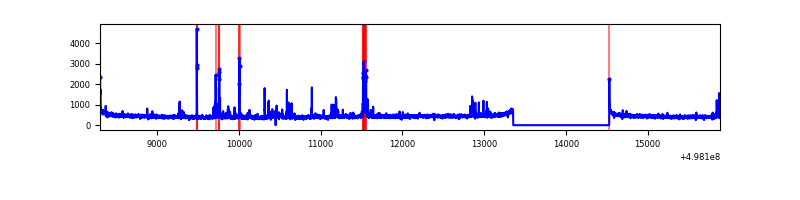 |
| B | 7585 | 6411 | 104 | 104 | 1.37% | 1.62% | 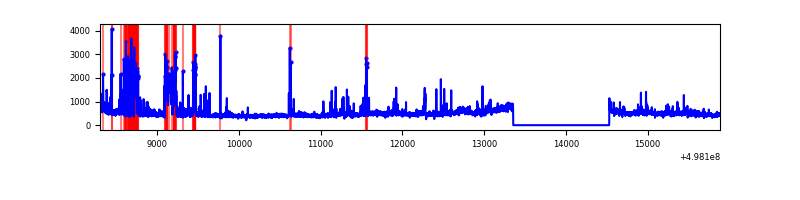 |
| C | 7585 | 6411 | 865 | 865 | 11.40% | 13.49% | 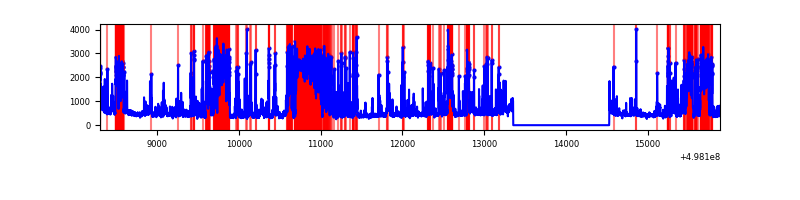 |
| D | 7585 | 6410 | 3466 | 3466 | 45.70% | 54.07% | 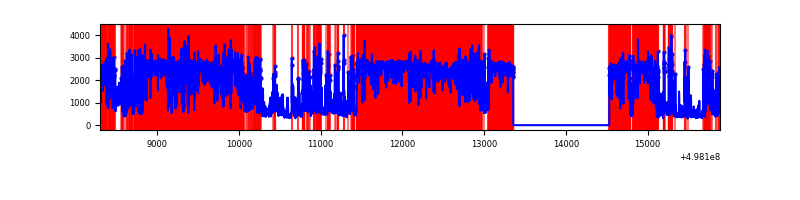 |
Top three noisy pixels from each quadrant. If the there are fewer than three noisy pixels in the level2.evt file, extra rows are filled as -1
| Pixel properties | Quadrant properties | ||||||
|---|---|---|---|---|---|---|---|
| Quadrant | DetID | PixID | Counts | Sigma | Mean | Median | Sigma |
| A | 0 | 8 | 127914 | 748.9 | 685 | 667 | 169.9 |
| A | 8 | 246 | 46656 | 270.66 | 685 | 667 | 169.9 |
| A | 5 | 243 | 44152 | 255.92 | 685 | 667 | 169.9 |
| B | 5 | 185 | 338985 | 2370.04 | 673 | 651 | 142.8 |
| B | 7 | 0 | 235486 | 1645.02 | 673 | 651 | 142.8 |
| B | 0 | 213 | 89123 | 619.75 | 673 | 651 | 142.8 |
| C | 15 | 147 | 1421940 | 8259.8 | 624 | 620 | 172.1 |
| C | 1 | 241 | 767185 | 4454.79 | 624 | 620 | 172.1 |
| C | 13 | 3 | 544480 | 3160.57 | 624 | 620 | 172.1 |
| D | 8 | 176 | 9208890 | 81123.69 | 395 | 375 | 113.5 |
| D | 15 | 108 | 843258 | 7425.5 | 395 | 375 | 113.5 |
| D | 2 | 252 | 148248 | 1302.71 | 395 | 375 | 113.5 |
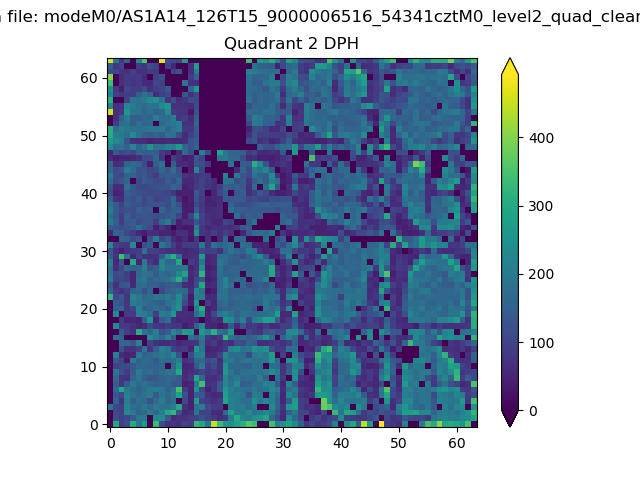
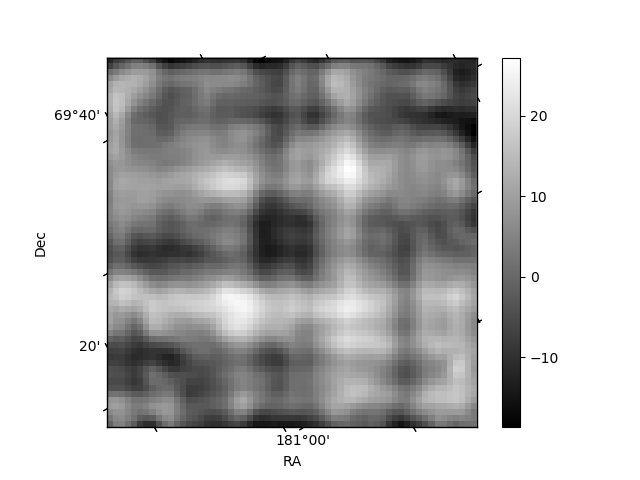
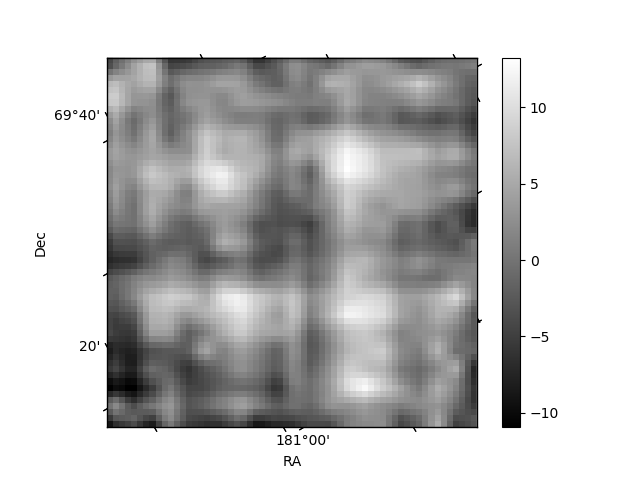
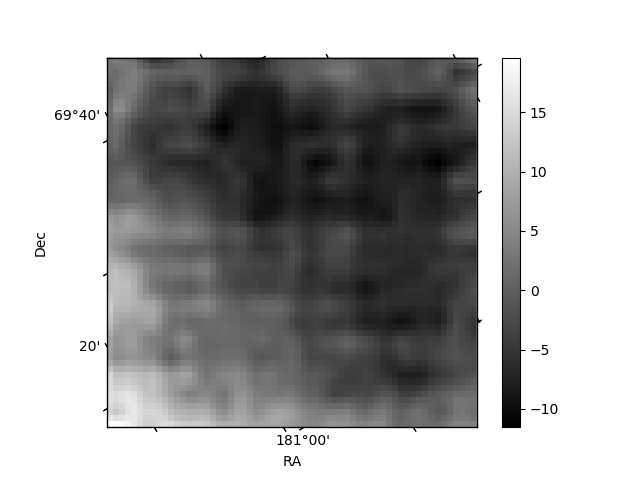
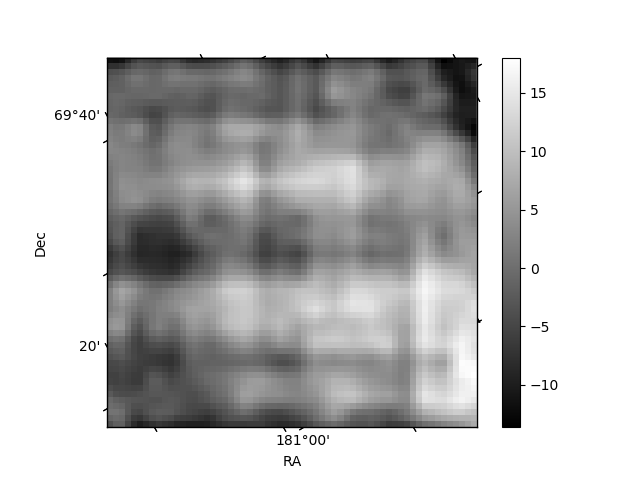
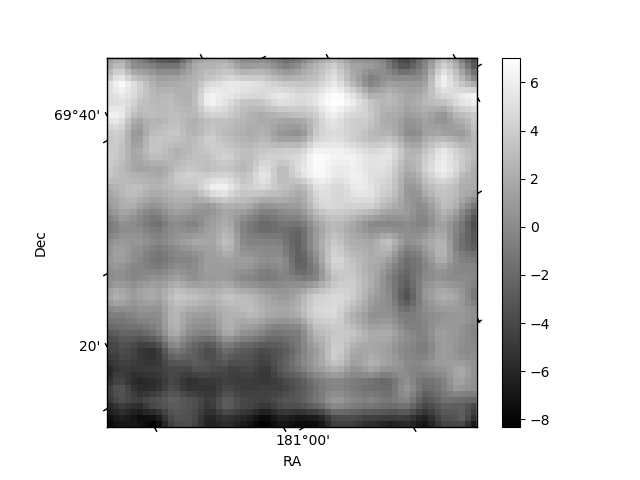
Histogram calculated using DETX and DETY for each event in the final _common_clean file
| Quadrant A | 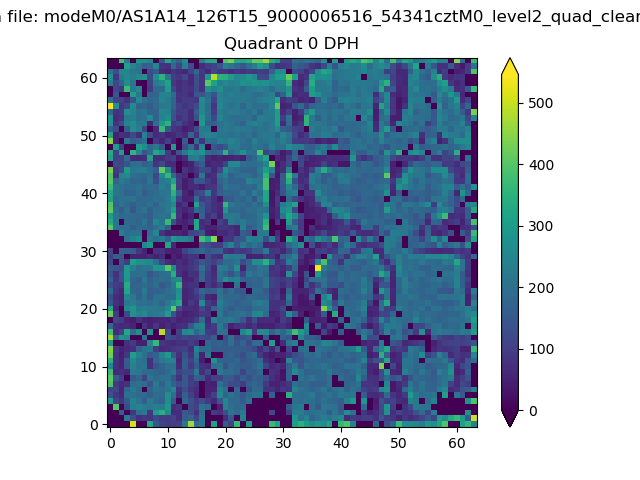 |
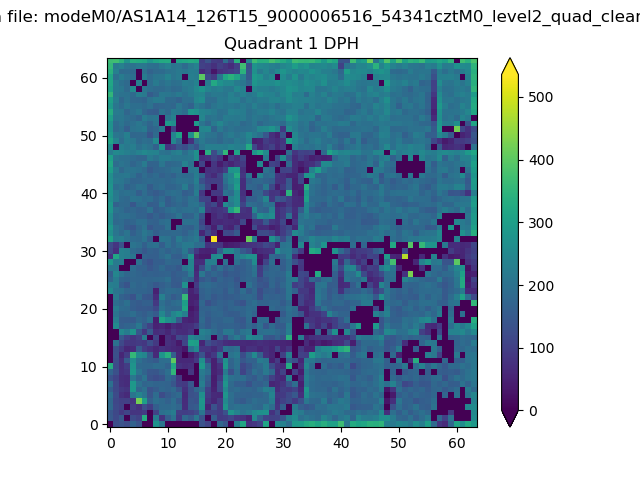 |
Quadrant B |
|---|---|---|---|
| Quadrant D | 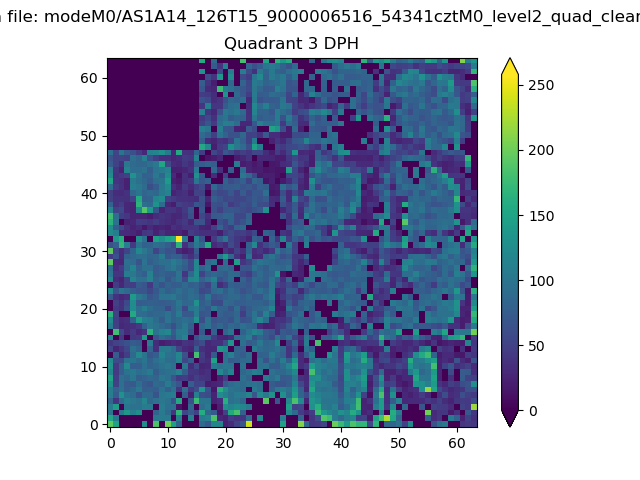 |
 |
Quadrant C |
| Plot type | Count rate plots | Images |
|---|---|---|
| Comparison with Poisson distribution Blue bars denote a histogram of data divided into 1 sec bins. Red curve is a Poisson curve with rate = median count rate of data. |
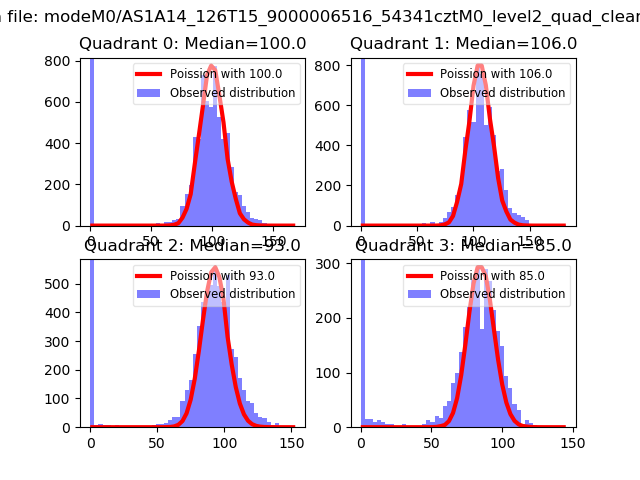 |
 |
| Quadrant-wise count rates Data is divided into 100 sec bins |
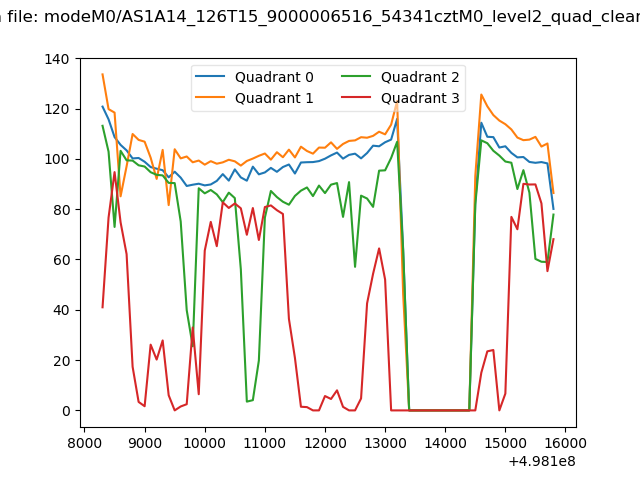 |
|
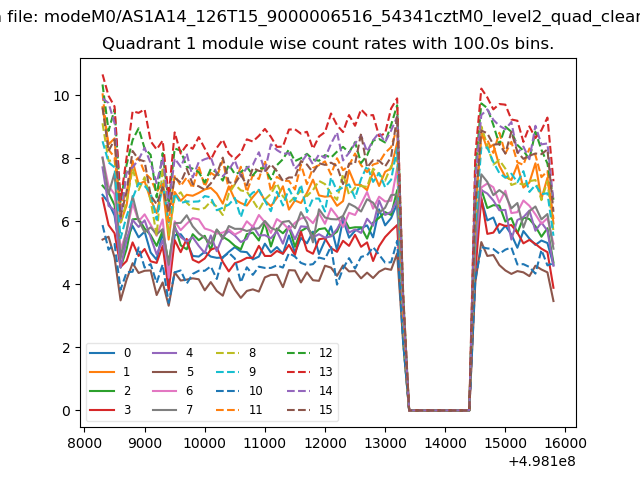
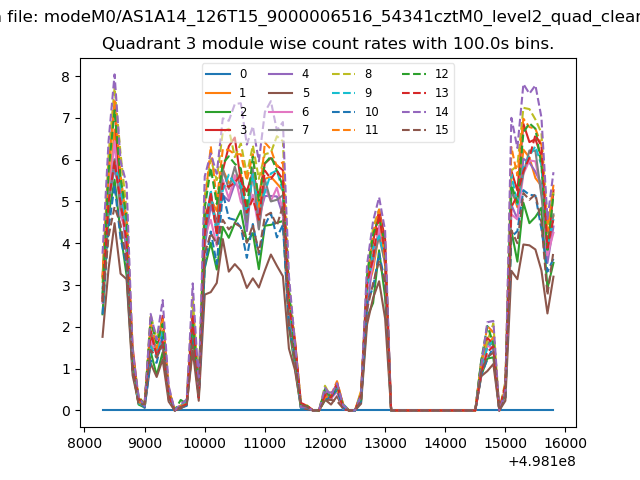
| Module-wise count rates for Quadrant A Data is divided into 100 sec bins |
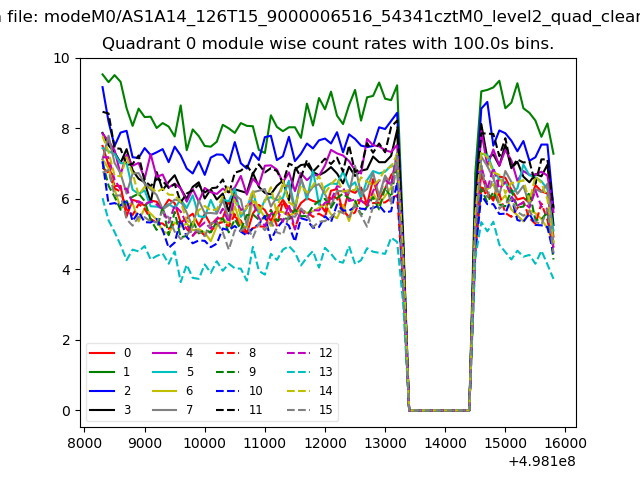 |
 |
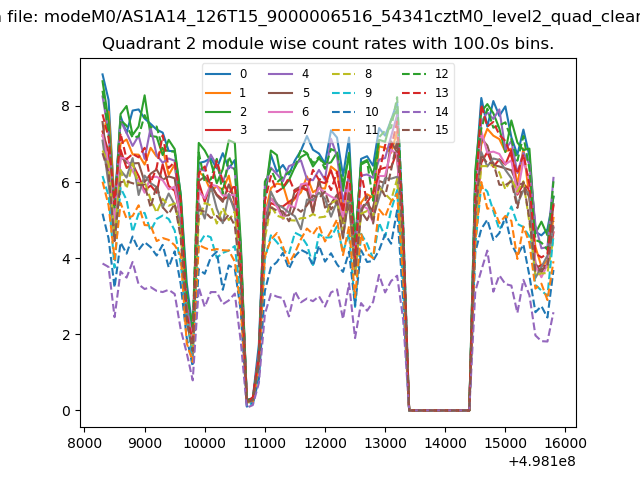
| Module-wise count rates for Quadrant B Data is divided into 100 sec bins |
 |
 |
| Module-wise count rates for Quadrant C Data is divided into 100 sec bins |
 |
 |
| Module-wise count rates for Quadrant D Data is divided into 100 sec bins |
 |
 |
| Parameter | Plot |
|---|---|
| CZT HV Monitor | 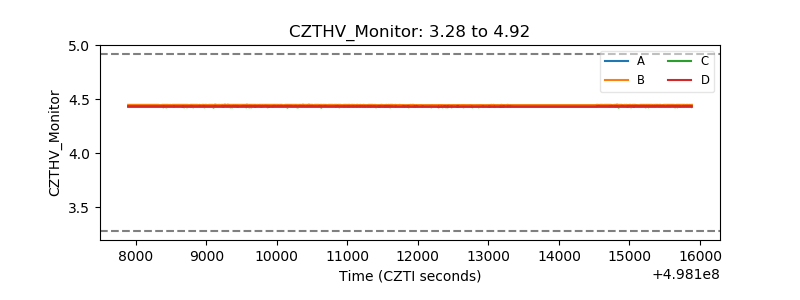 |
| D_VDD | 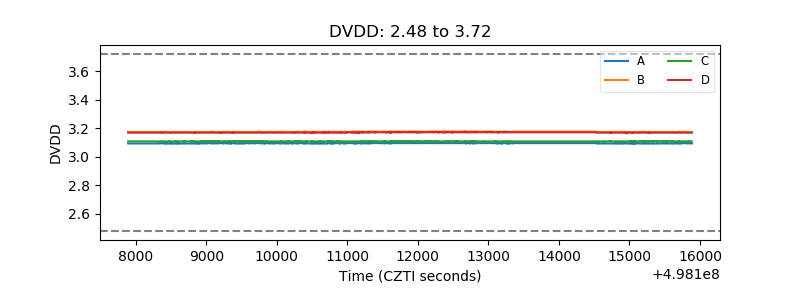 |
| Temperature 1 | 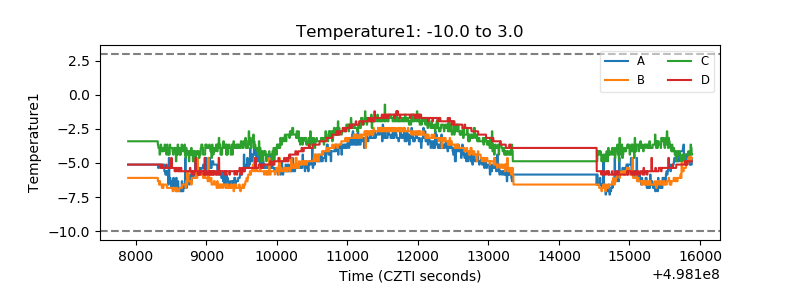 |
| Veto HV Monitor | 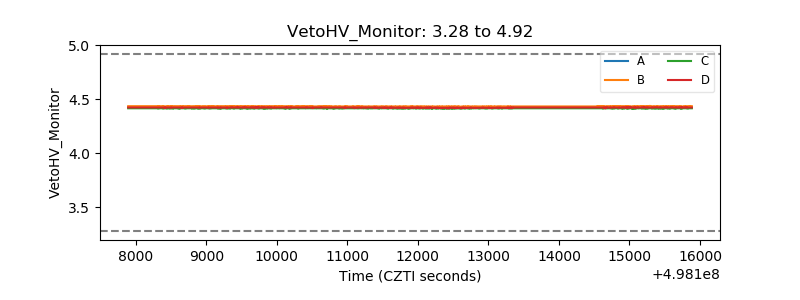 |
| Veto LLD | 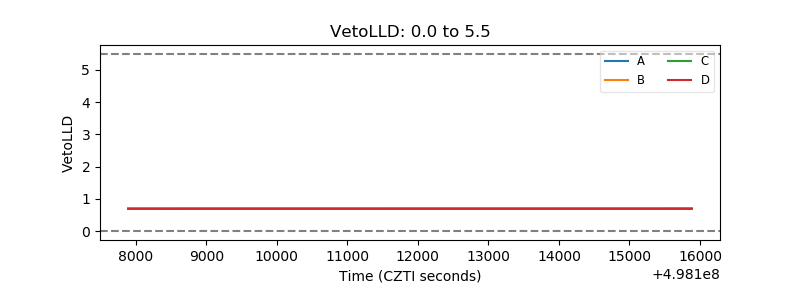 |
| Alpha Counter | 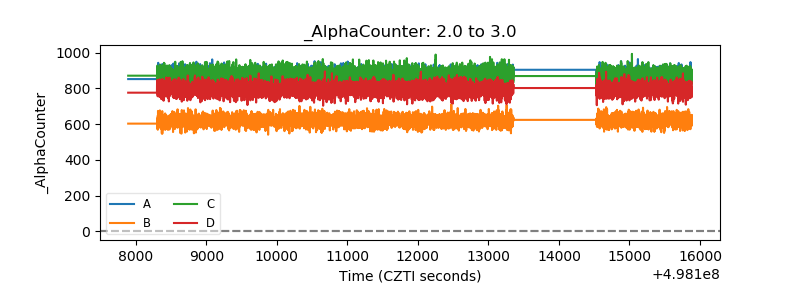 |
| _CPM_Rate | 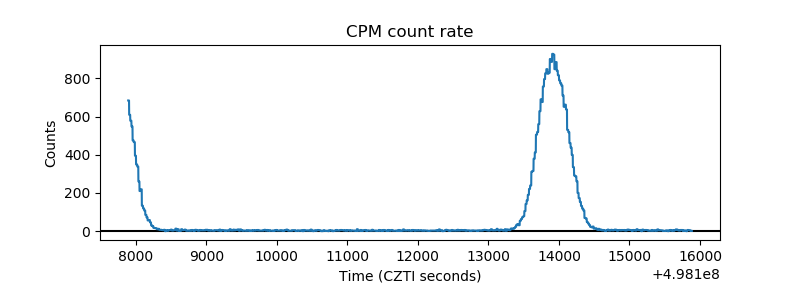 |
| CZT Counter | 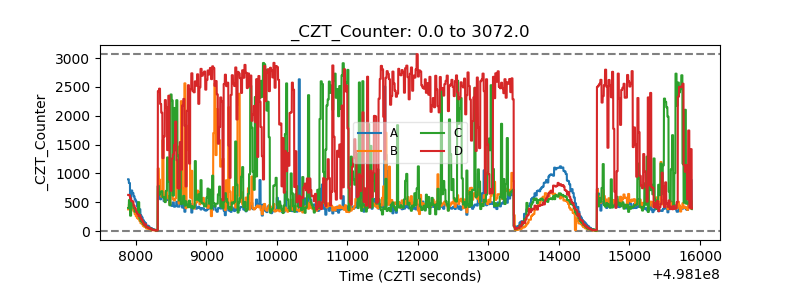 |
| +2.5 Volts monitor | 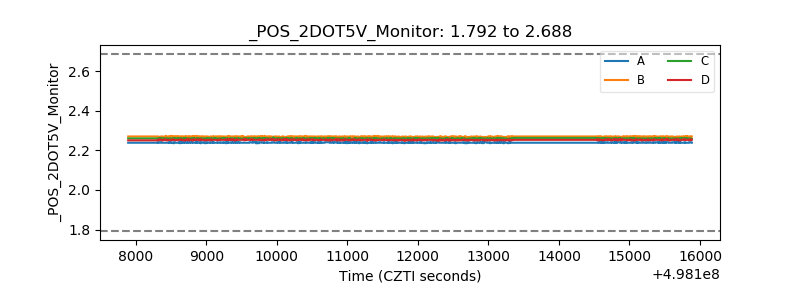 |
| +5 Volts monitor |  |
| _ROLL_ROT | 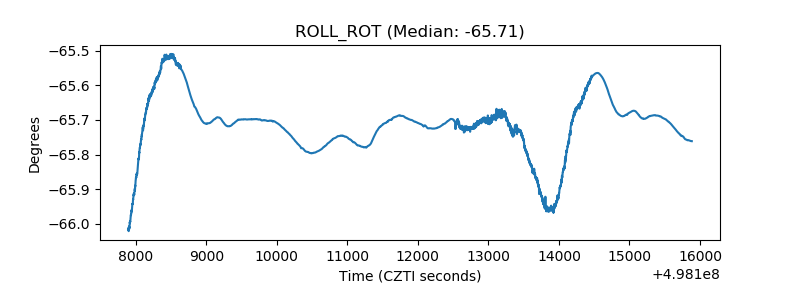 |
| _Roll_DEC | 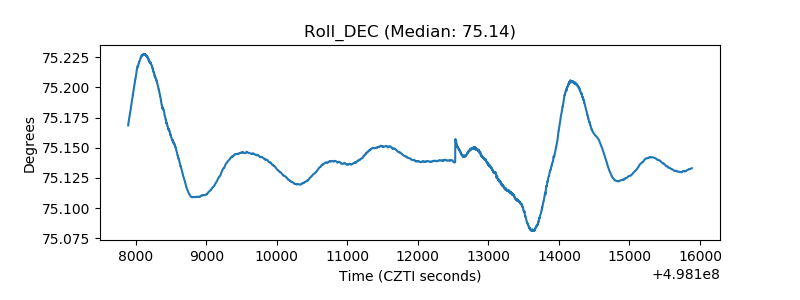 |
| _Roll_RA | 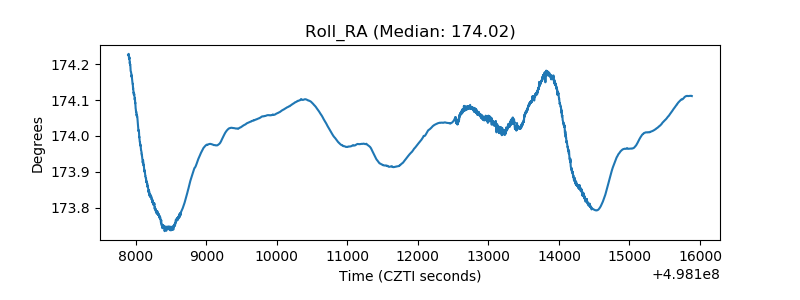 |
| Veto Counter | 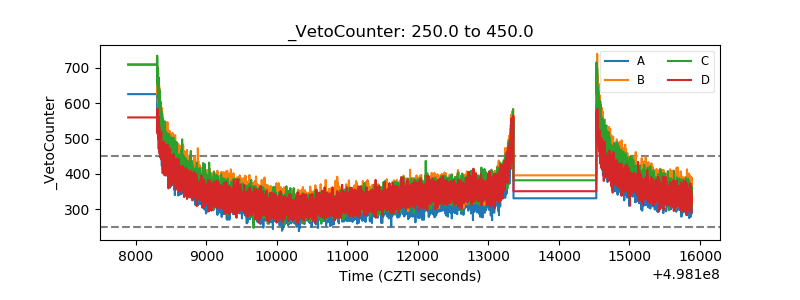 |