| Param | Original file | Final file |
|---|---|---|
| Filename | modeM0/AS1A14_126T15_9000006516_54342cztM0_level2.fits | modeM0/AS1A14_126T15_9000006516_54342cztM0_level2_quad_clean.evt |
| Size (bytes) | 580,806,720 | 87,960,960 |
| Size | 553.9 MB | 83.9 MB |
| Events in quadrant A | 2,918,365 | 641,926 |
| Events in quadrant B | 3,158,321 | 689,869 |
| Events in quadrant C | 5,465,027 | 526,610 |
| Events in quadrant D | 9,458,086 | 356,528 |
| Mode SS | |||
|---|---|---|---|
| Quadrant | BADHDUFLAG | Total packets | Discarded packets |
| A | 0 | 130 | 0 |
| B | 0 | 130 | 0 |
| C | 0 | 130 | 0 |
| D | 0 | 130 | 0 |
| Mode M0 | |||
|---|---|---|---|
| Quadrant | BADHDUFLAG | Total packets | Discarded packets |
| A | 0 | 13503 | 1 |
| B | 0 | 13786 | 1 |
| C | 0 | 20958 | 1 |
| D | 0 | 32573 | 1 |
| Mode M9 | |||
|---|---|---|---|
| Quadrant | BADHDUFLAG | Total packets | Discarded packets |
| A | 0 | 12 | 0 |
| B | 0 | 12 | 0 |
| C | 0 | 12 | 0 |
| D | 0 | 12 | 0 |
| Quadrant | Total seconds | Saturated seconds | Saturation percentage |
|---|---|---|---|
| A | 6428 | 78 | 1.213441% |
| B | 6429 | 75 | 1.166589% |
| C | 6429 | 954 | 14.839011% |
| D | 6429 | 2594 | 40.348421% |
Noise dominated data is calculated using 1-second bins in cleaned event files. If a bin has >2000 counts, and if more than 50% of those come from <1% of pixels, then it is considered to be noise-dominated and hence unusable.
| Quadrant | # 1 sec bins | Bins with >0 counts | Bins with >2000 counts | High rate bins dominated by noise | Noise dominated (total time) | Noise dominated (detector-on time) | Marked lightcurve |
|---|---|---|---|---|---|---|---|
| A | 7578 | 6429 | 31 | 31 | 0.41% | 0.48% | 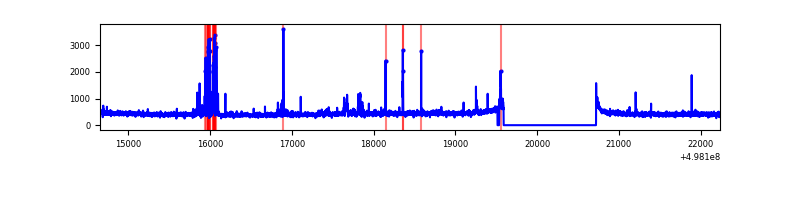 |
| B | 7579 | 6430 | 14 | 14 | 0.18% | 0.22% | 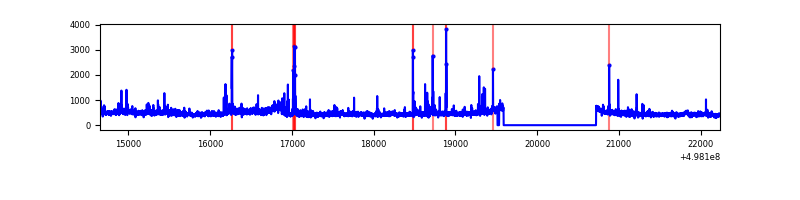 |
| C | 7579 | 6431 | 876 | 876 | 11.56% | 13.62% | 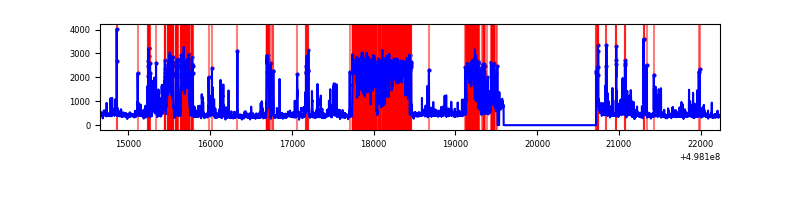 |
| D | 7579 | 6431 | 2417 | 2417 | 31.89% | 37.58% | 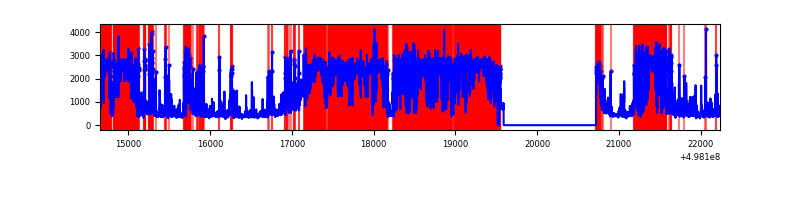 |
Top three noisy pixels from each quadrant. If the there are fewer than three noisy pixels in the level2.evt file, extra rows are filled as -1
| Pixel properties | Quadrant properties | ||||||
|---|---|---|---|---|---|---|---|
| Quadrant | DetID | PixID | Counts | Sigma | Mean | Median | Sigma |
| A | 3 | 110 | 110910 | 646.31 | 686 | 669 | 170.6 |
| A | 0 | 8 | 46700 | 269.87 | 686 | 669 | 170.6 |
| A | 5 | 243 | 32665 | 187.58 | 686 | 669 | 170.6 |
| B | 7 | 0 | 202637 | 1388.85 | 679 | 656 | 145.4 |
| B | 0 | 171 | 100114 | 683.89 | 679 | 656 | 145.4 |
| B | 10 | 247 | 64218 | 437.06 | 679 | 656 | 145.4 |
| C | 15 | 147 | 1694574 | 9916.74 | 620 | 613 | 170.8 |
| C | 13 | 3 | 450347 | 2632.82 | 620 | 613 | 170.8 |
| C | 15 | 189 | 440800 | 2576.93 | 620 | 613 | 170.8 |
| D | 8 | 176 | 5693177 | 40939.87 | 493 | 470 | 139.1 |
| D | 15 | 108 | 1572834 | 11307.87 | 493 | 470 | 139.1 |
| D | 2 | 120 | 119920 | 859.04 | 493 | 470 | 139.1 |
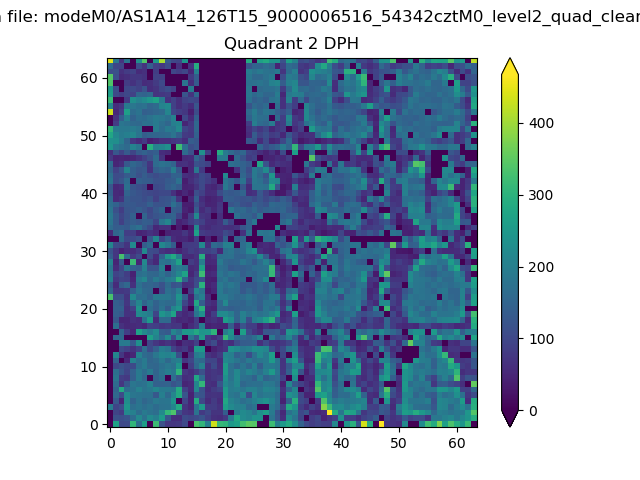
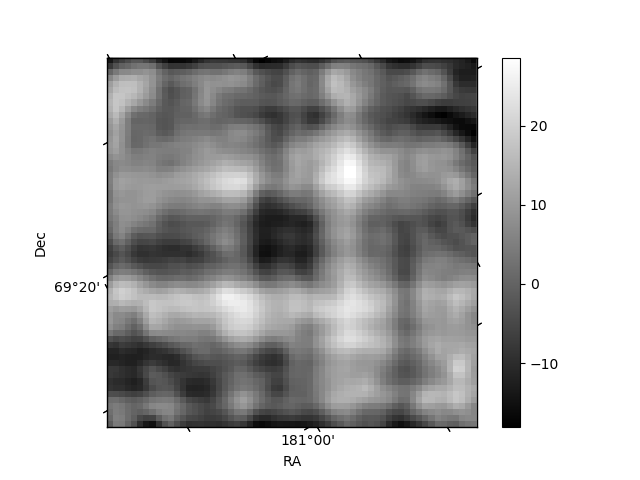
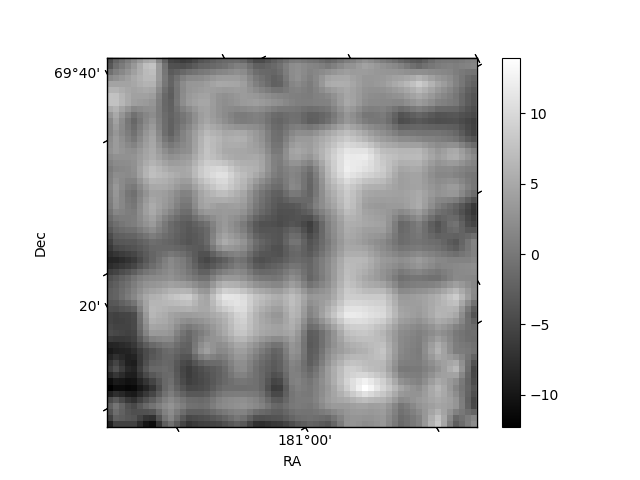
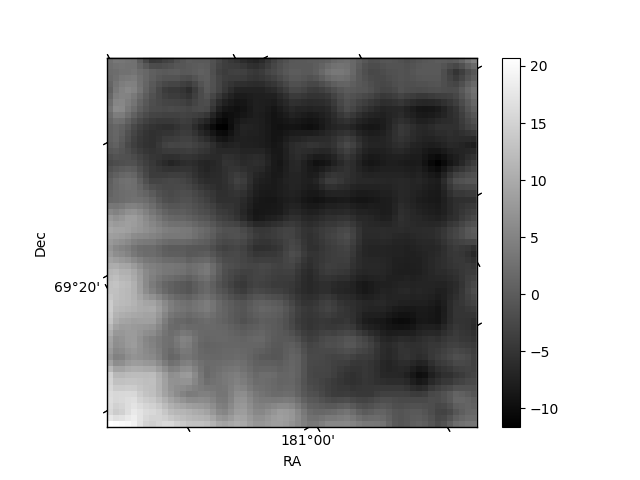
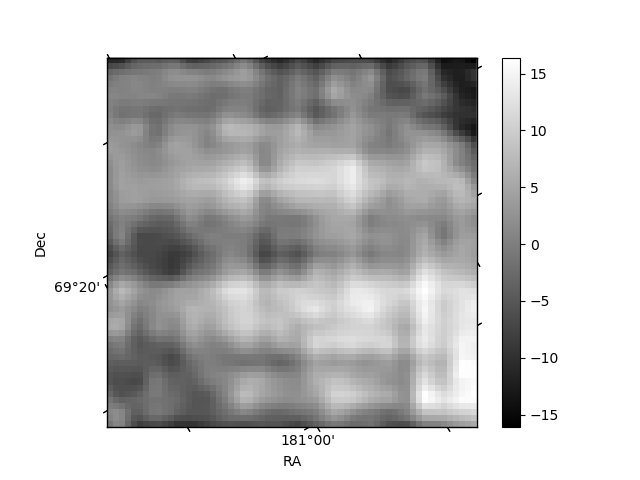
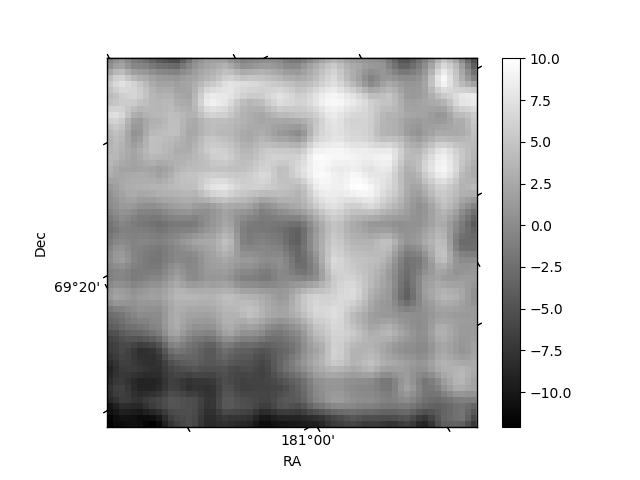
Histogram calculated using DETX and DETY for each event in the final _common_clean file
| Quadrant A | 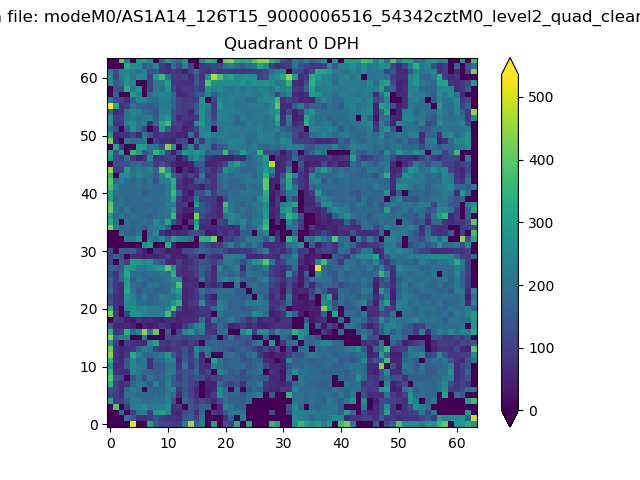 |
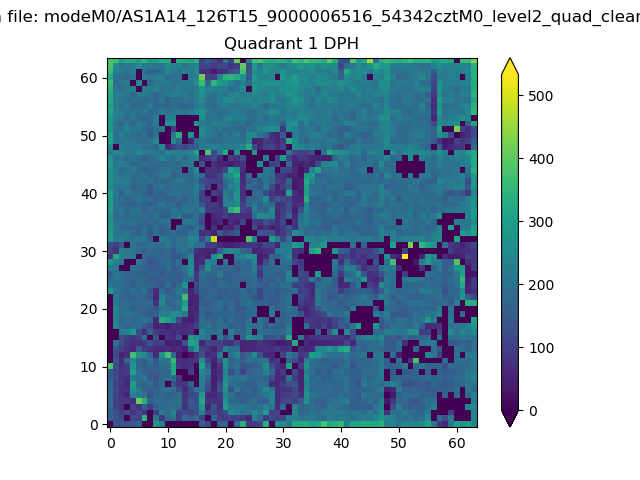 |
Quadrant B |
|---|---|---|---|
| Quadrant D | 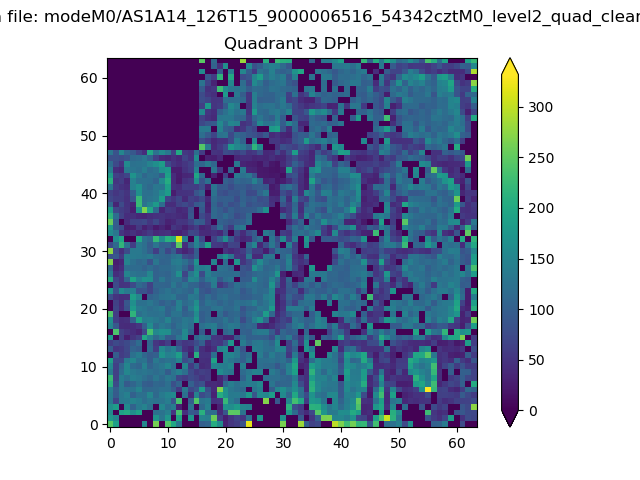 |
 |
Quadrant C |
| Plot type | Count rate plots | Images |
|---|---|---|
| Comparison with Poisson distribution Blue bars denote a histogram of data divided into 1 sec bins. Red curve is a Poisson curve with rate = median count rate of data. |
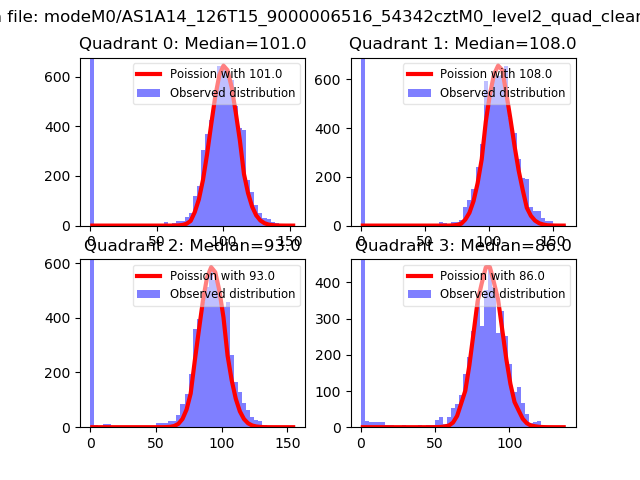 |
 |
| Quadrant-wise count rates Data is divided into 100 sec bins |
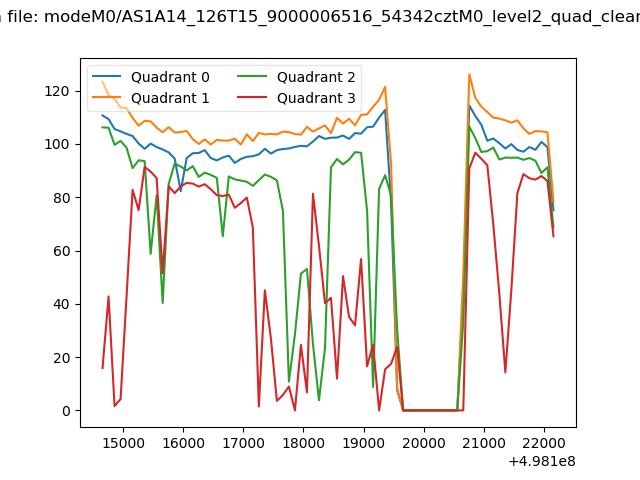 |
|
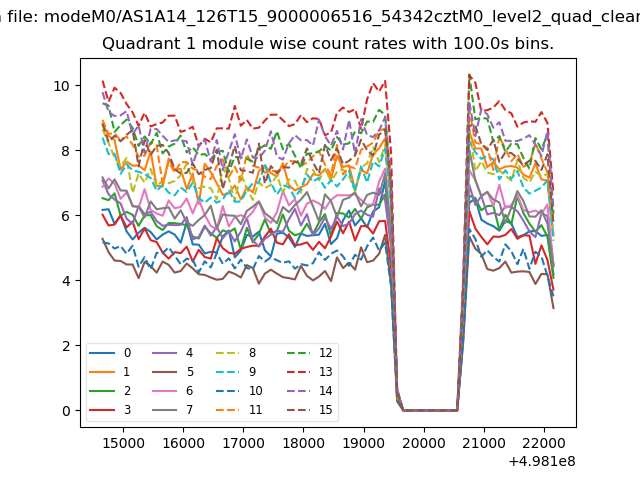
| Module-wise count rates for Quadrant A Data is divided into 100 sec bins |
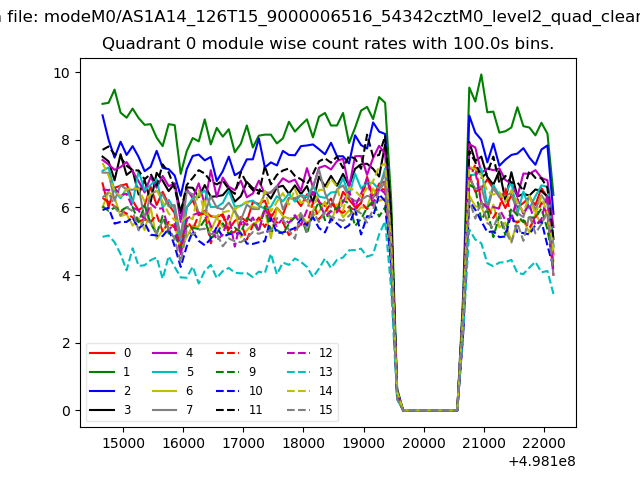 |
 |
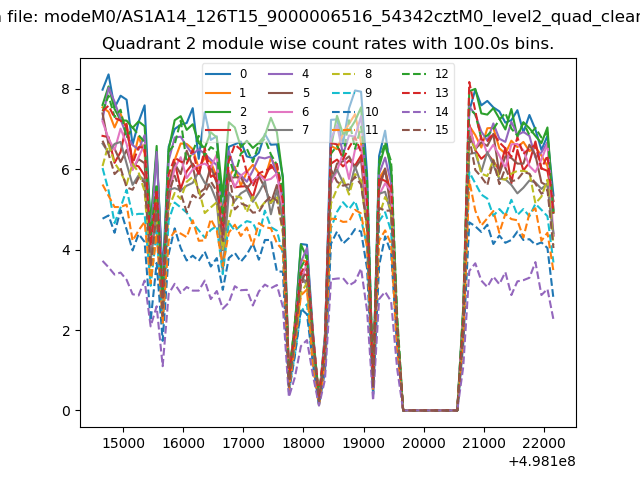
| Module-wise count rates for Quadrant B Data is divided into 100 sec bins |
 |
 |
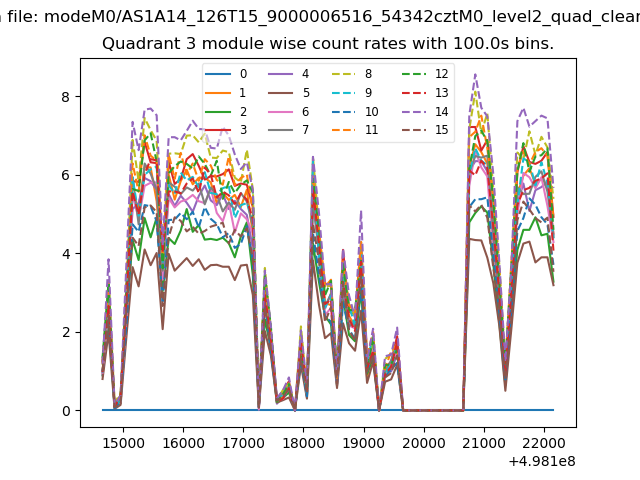
| Module-wise count rates for Quadrant C Data is divided into 100 sec bins |
 |
 |
| Module-wise count rates for Quadrant D Data is divided into 100 sec bins |
 |
 |
| Parameter | Plot |
|---|---|
| CZT HV Monitor |  |
| D_VDD | 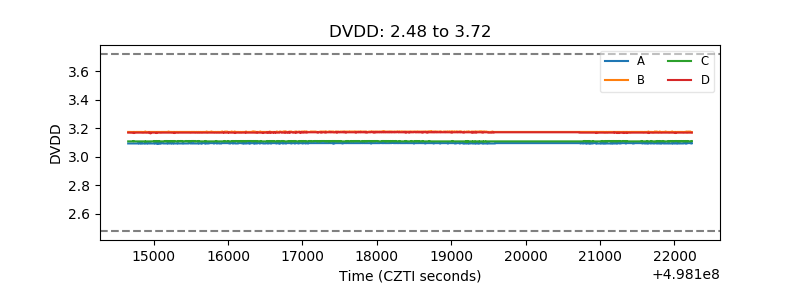 |
| Temperature 1 | 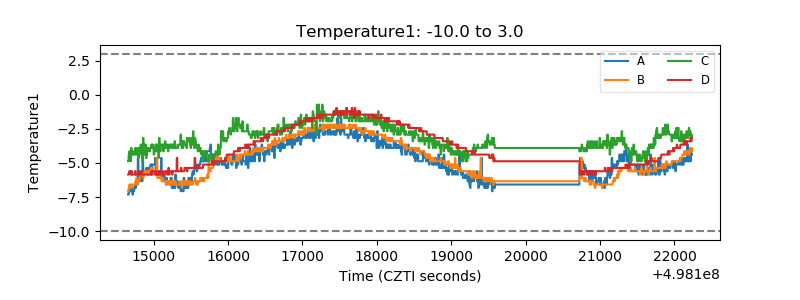 |
| Veto HV Monitor | 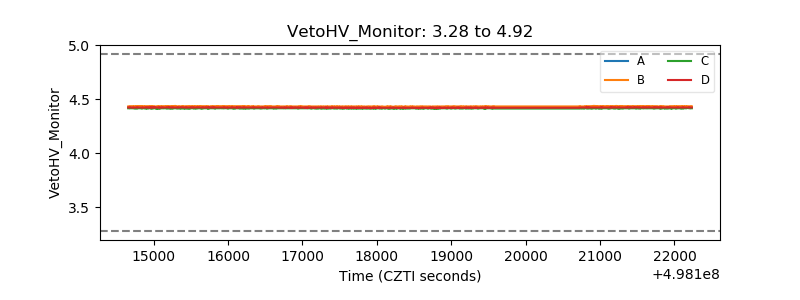 |
| Veto LLD | 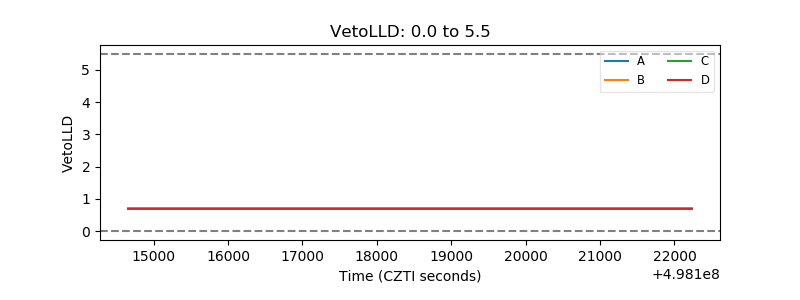 |
| Alpha Counter | 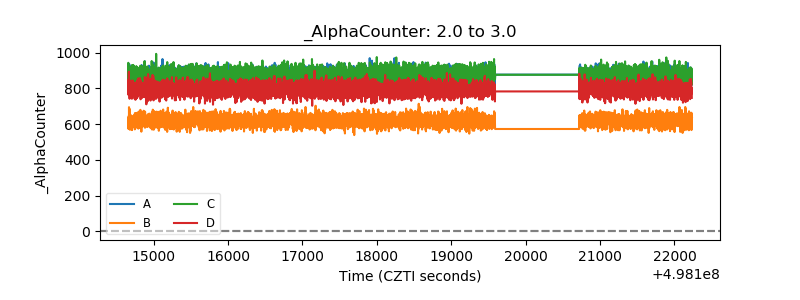 |
| _CPM_Rate | 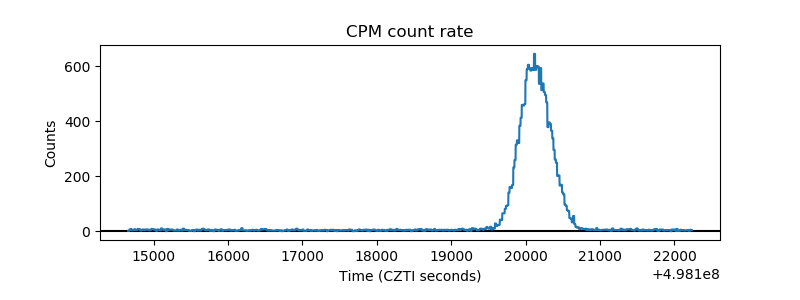 |
| CZT Counter | 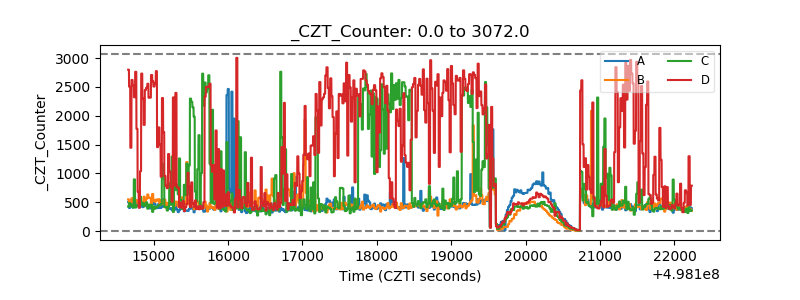 |
| +2.5 Volts monitor | 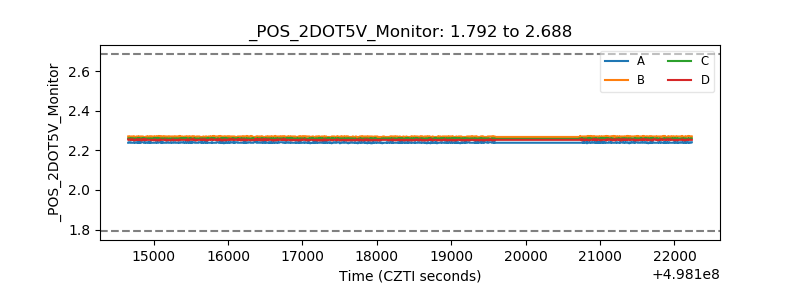 |
| +5 Volts monitor |  |
| _ROLL_ROT | 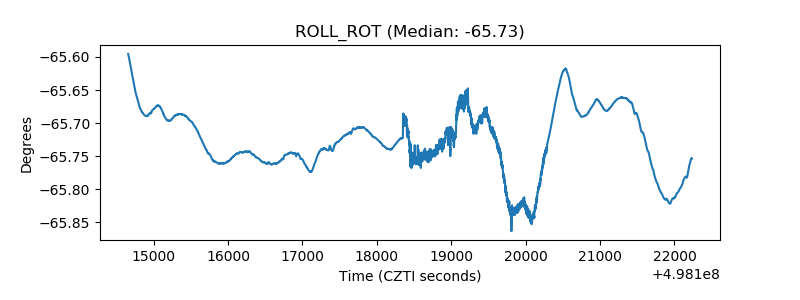 |
| _Roll_DEC | 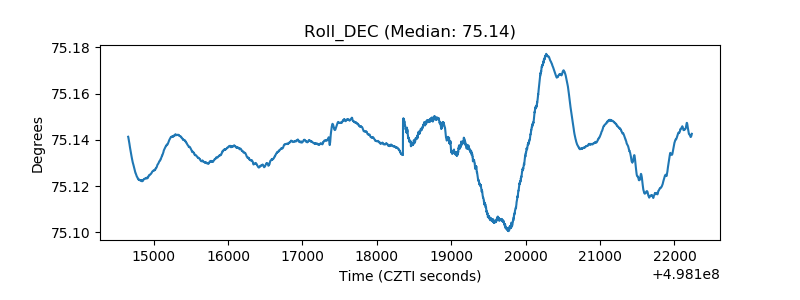 |
| _Roll_RA | 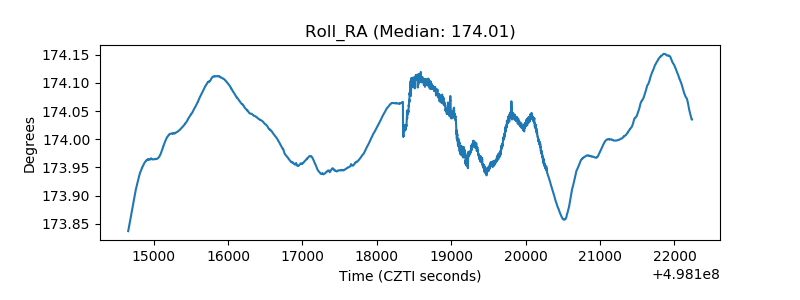 |
| Veto Counter | 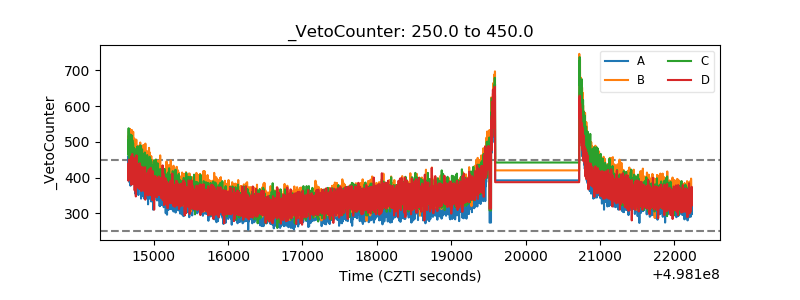 |