| Param | Original file | Final file |
|---|---|---|
| Filename | modeM0/AS1A14_126T15_9000006516_54344cztM0_level2.fits | modeM0/AS1A14_126T15_9000006516_54344cztM0_level2_quad_clean.evt |
| Size (bytes) | 626,198,400 | 87,756,480 |
| Size | 597.2 MB | 83.7 MB |
| Events in quadrant A | 4,677,596 | 592,954 |
| Events in quadrant B | 3,094,551 | 680,397 |
| Events in quadrant C | 4,881,767 | 567,998 |
| Events in quadrant D | 10,008,564 | 351,690 |
| Mode SS | |||
|---|---|---|---|
| Quadrant | BADHDUFLAG | Total packets | Discarded packets |
| A | 0 | 136 | 0 |
| B | 0 | 136 | 0 |
| C | 0 | 136 | 0 |
| D | 0 | 136 | 0 |
| Mode M0 | |||
|---|---|---|---|
| Quadrant | BADHDUFLAG | Total packets | Discarded packets |
| A | 0 | 18773 | 1 |
| B | 0 | 14165 | 1 |
| C | 0 | 19458 | 1 |
| D | 0 | 34364 | 1 |
| Mode M9 | |||
|---|---|---|---|
| Quadrant | BADHDUFLAG | Total packets | Discarded packets |
| A | 0 | 9 | 0 |
| B | 0 | 9 | 0 |
| C | 0 | 9 | 0 |
| D | 0 | 9 | 0 |
| Quadrant | Total seconds | Saturated seconds | Saturation percentage |
|---|---|---|---|
| A | 6657 | 641 | 9.628962% |
| B | 6657 | 112 | 1.682440% |
| C | 6658 | 532 | 7.990388% |
| D | 6658 | 2779 | 41.739261% |
Noise dominated data is calculated using 1-second bins in cleaned event files. If a bin has >2000 counts, and if more than 50% of those come from <1% of pixels, then it is considered to be noise-dominated and hence unusable.
| Quadrant | # 1 sec bins | Bins with >0 counts | Bins with >2000 counts | High rate bins dominated by noise | Noise dominated (total time) | Noise dominated (detector-on time) | Marked lightcurve |
|---|---|---|---|---|---|---|---|
| A | 7522 | 6659 | 558 | 558 | 7.42% | 8.38% | 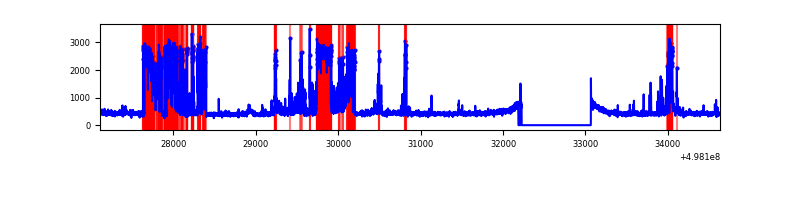 |
| B | 7522 | 6659 | 19 | 19 | 0.25% | 0.29% | 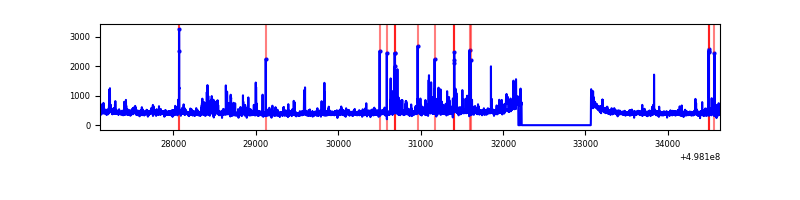 |
| C | 7523 | 6659 | 470 | 470 | 6.25% | 7.06% | 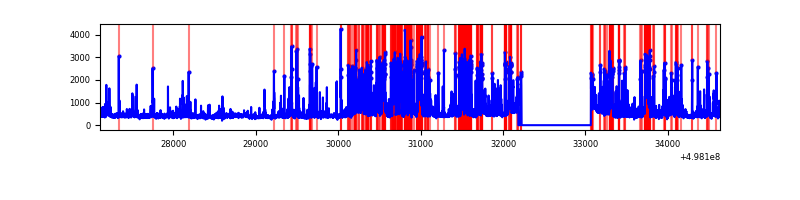 |
| D | 7522 | 6659 | 2452 | 2452 | 32.60% | 36.82% | 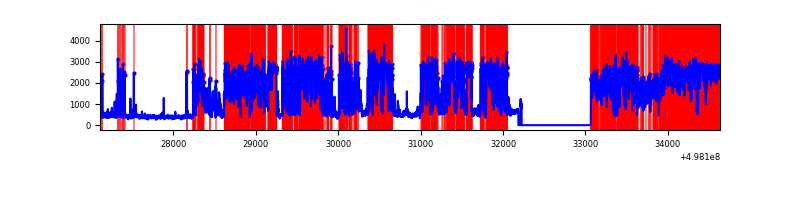 |
Top three noisy pixels from each quadrant. If the there are fewer than three noisy pixels in the level2.evt file, extra rows are filled as -1
| Pixel properties | Quadrant properties | ||||||
|---|---|---|---|---|---|---|---|
| Quadrant | DetID | PixID | Counts | Sigma | Mean | Median | Sigma |
| A | 5 | 242 | 872426 | 5200.16 | 680 | 662 | 167.6 |
| A | 15 | 174 | 824549 | 4914.57 | 680 | 662 | 167.6 |
| A | 7 | 14 | 248849 | 1480.46 | 680 | 662 | 167.6 |
| B | 10 | 247 | 131013 | 884.57 | 690 | 665 | 147.4 |
| B | 0 | 213 | 55798 | 374.15 | 690 | 665 | 147.4 |
| B | 0 | 171 | 48144 | 322.2 | 690 | 665 | 147.4 |
| C | 1 | 241 | 1075485 | 6046.42 | 648 | 641 | 177.8 |
| C | 13 | 3 | 611688 | 3437.38 | 648 | 641 | 177.8 |
| C | 12 | 2 | 282614 | 1586.21 | 648 | 641 | 177.8 |
| D | 8 | 176 | 3283544 | 22326.16 | 514 | 491 | 147.0 |
| D | 15 | 108 | 3144278 | 21379.09 | 514 | 491 | 147.0 |
| D | 2 | 62 | 1169324 | 7948.56 | 514 | 491 | 147.0 |
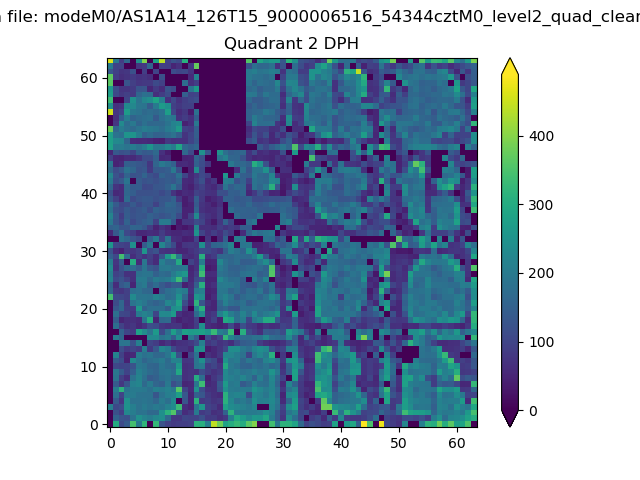
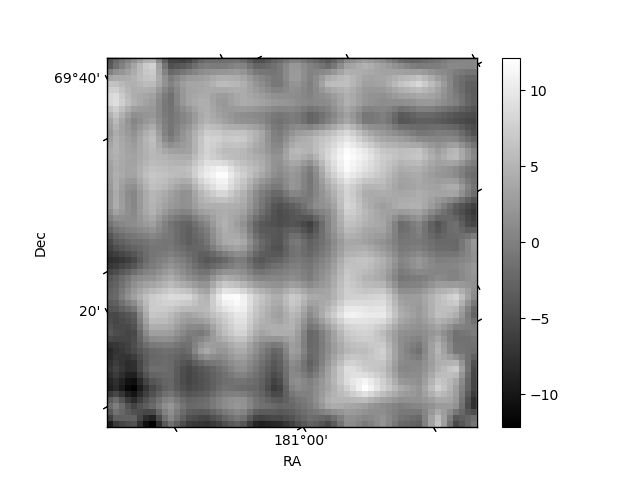
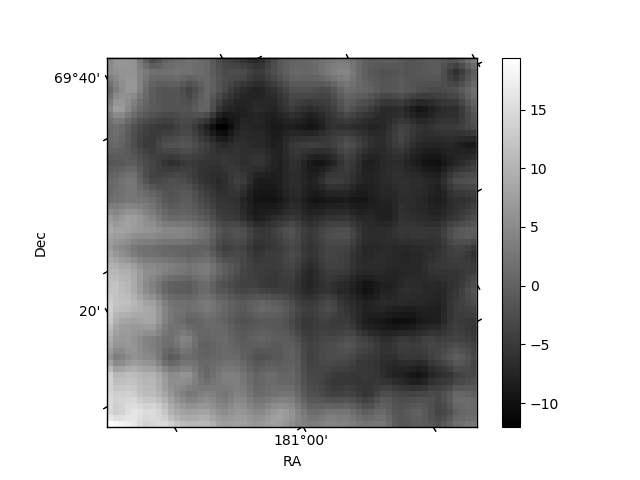
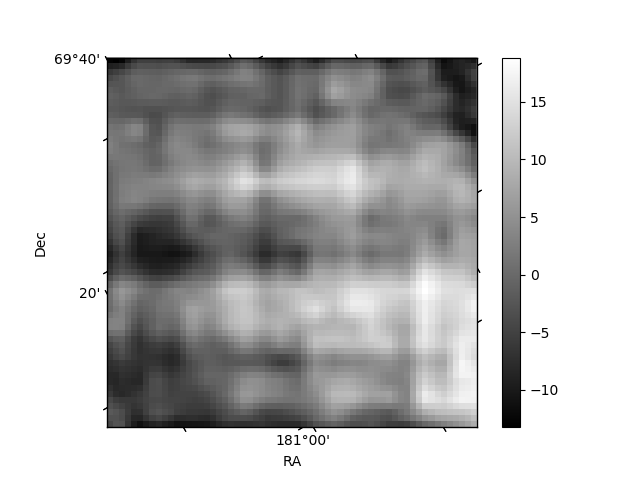
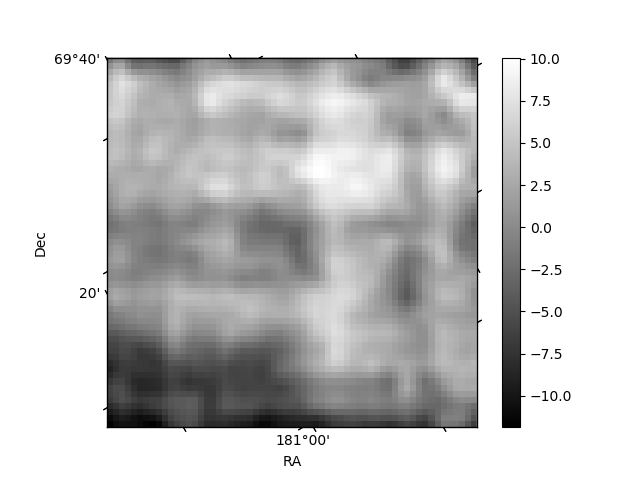
Histogram calculated using DETX and DETY for each event in the final _common_clean file
| Quadrant A | 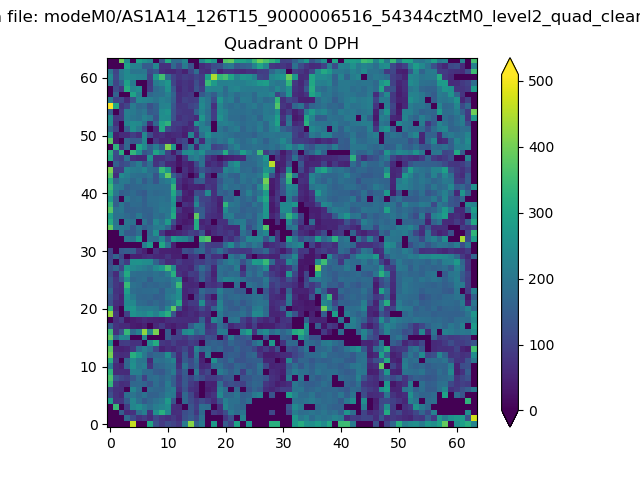 |
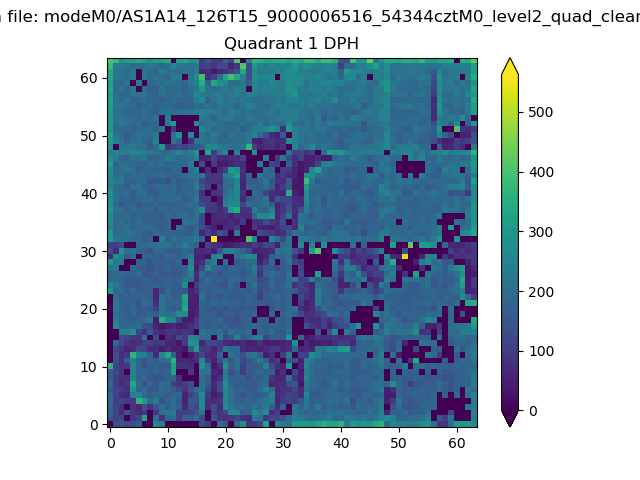 |
Quadrant B |
|---|---|---|---|
| Quadrant D | 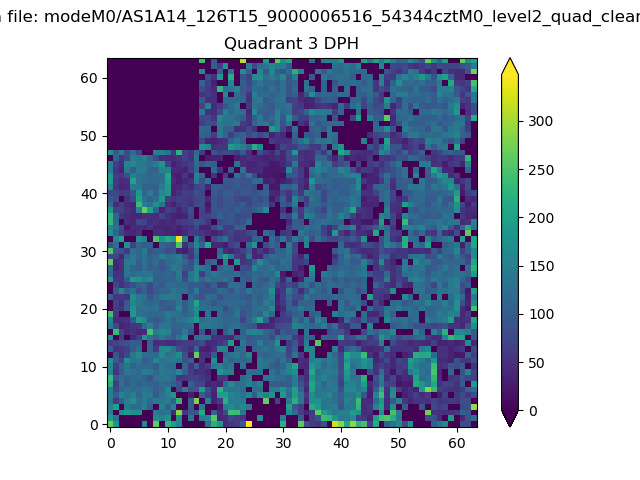 |
 |
Quadrant C |
| Plot type | Count rate plots | Images |
|---|---|---|
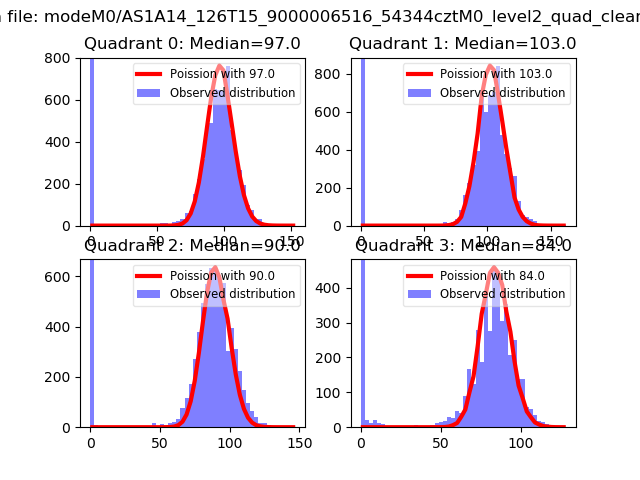
| Comparison with Poisson distribution Blue bars denote a histogram of data divided into 1 sec bins. Red curve is a Poisson curve with rate = median count rate of data. |
 |
 |
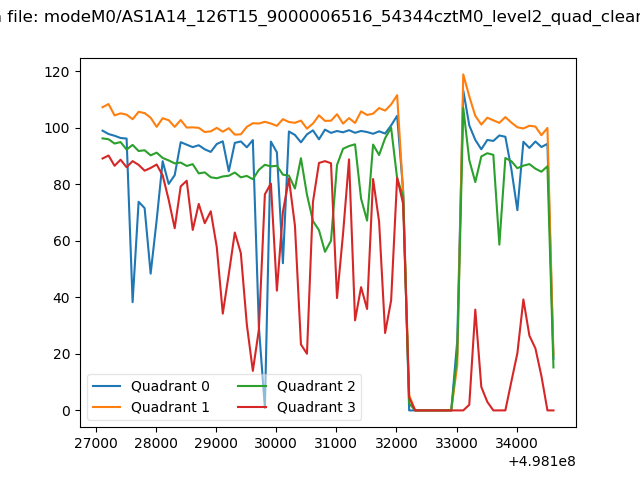
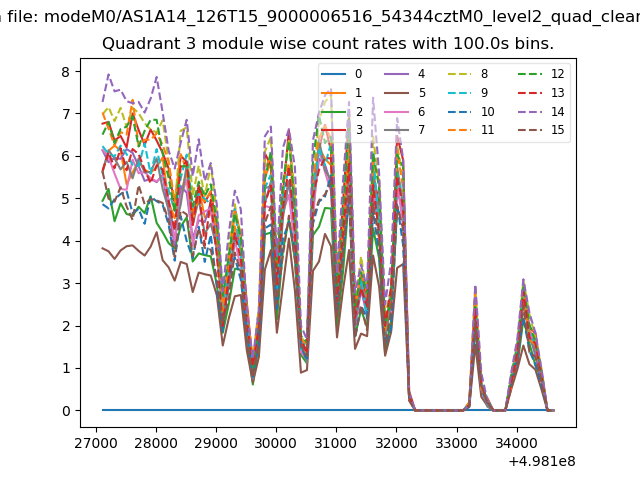
| Quadrant-wise count rates Data is divided into 100 sec bins |
 |
|
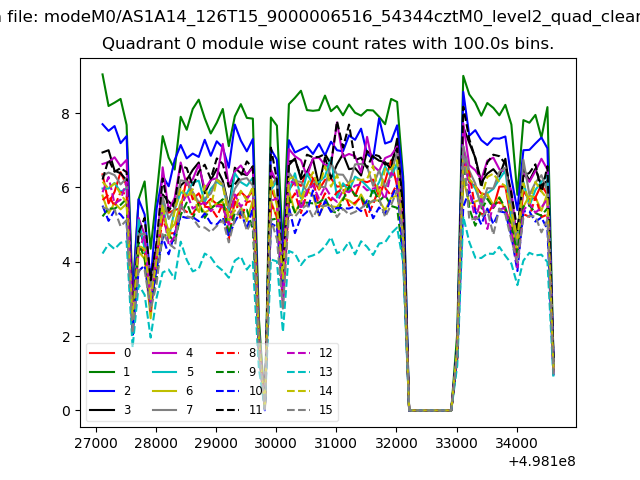
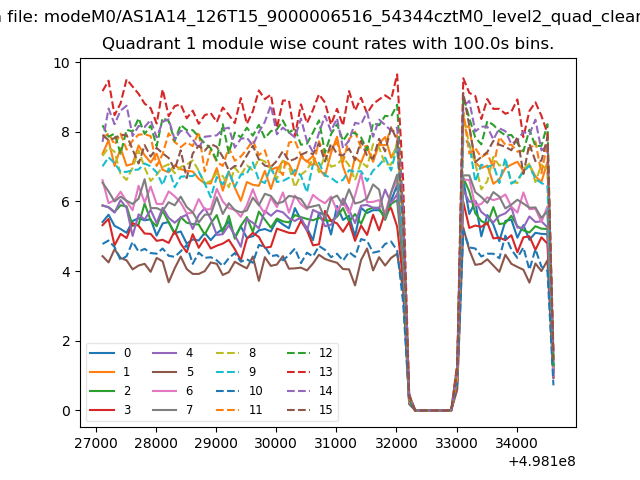
| Module-wise count rates for Quadrant A Data is divided into 100 sec bins |
 |
 |
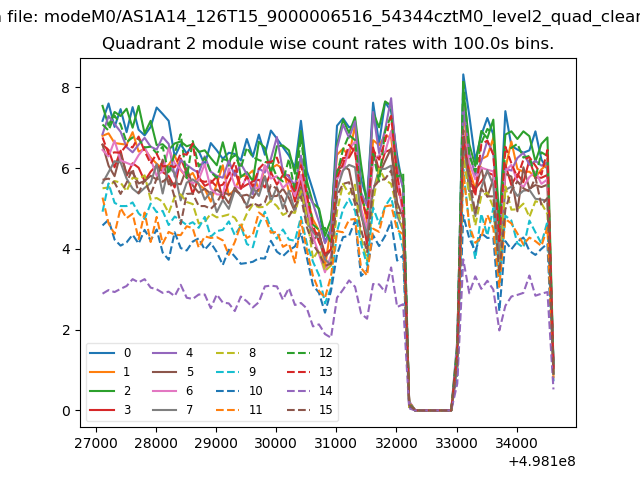
| Module-wise count rates for Quadrant B Data is divided into 100 sec bins |
 |
 |
| Module-wise count rates for Quadrant C Data is divided into 100 sec bins |
 |
 |
| Module-wise count rates for Quadrant D Data is divided into 100 sec bins |
 |
 |
| Parameter | Plot |
|---|---|
| CZT HV Monitor | 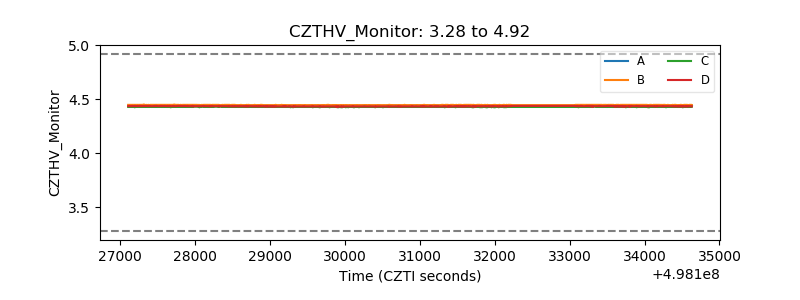 |
| D_VDD | 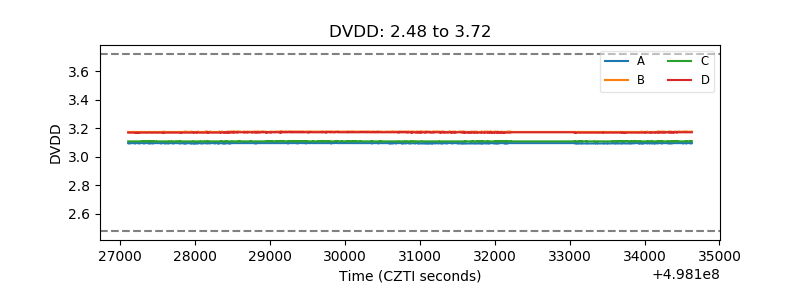 |
| Temperature 1 | 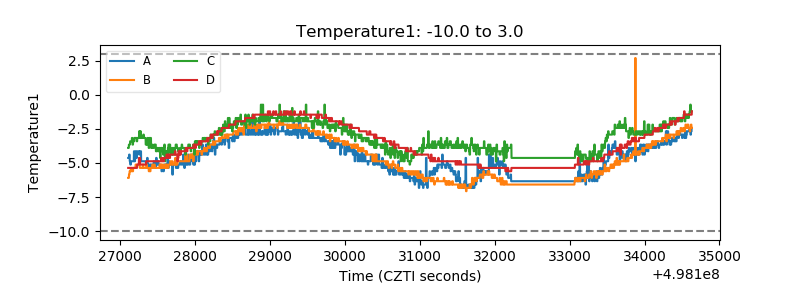 |
| Veto HV Monitor | 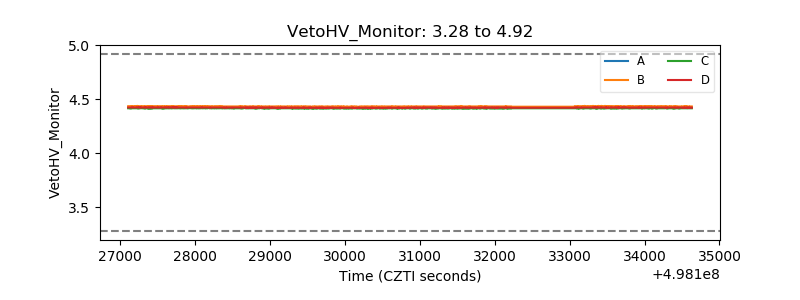 |
| Veto LLD | 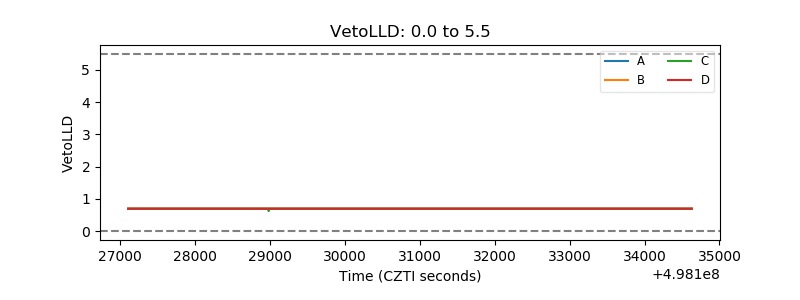 |
| Alpha Counter | 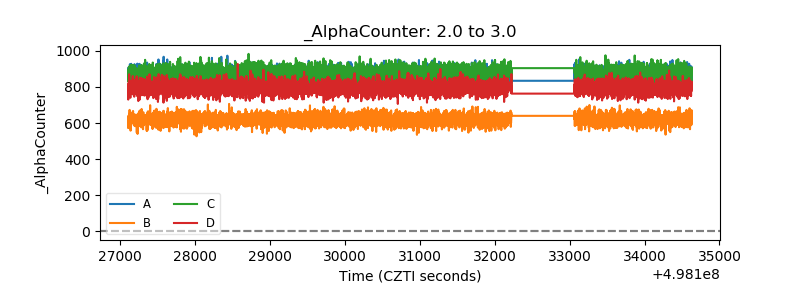 |
| _CPM_Rate | 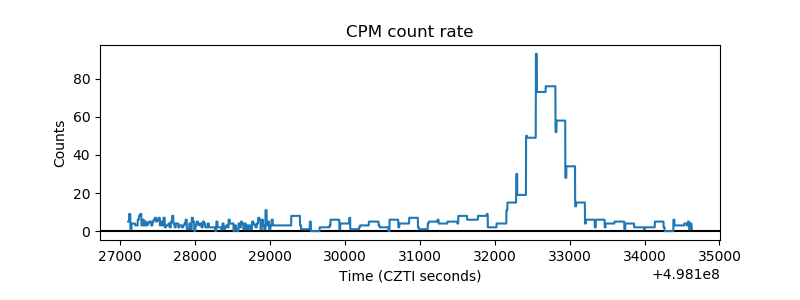 |
| CZT Counter | 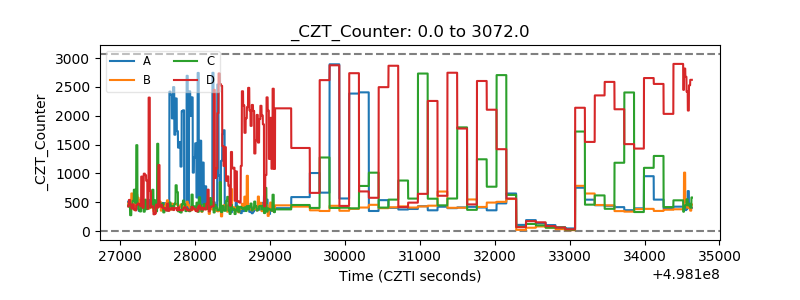 |
| +2.5 Volts monitor |  |
| +5 Volts monitor | 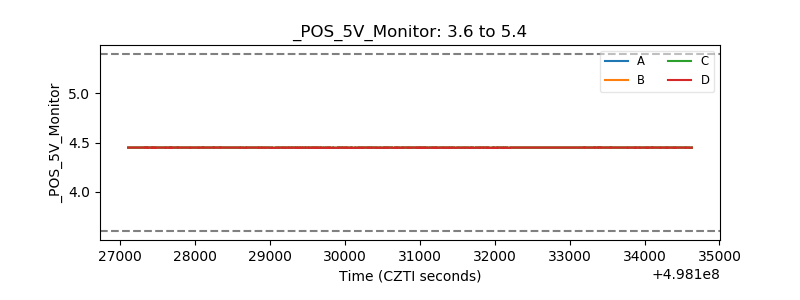 |
| _ROLL_ROT | 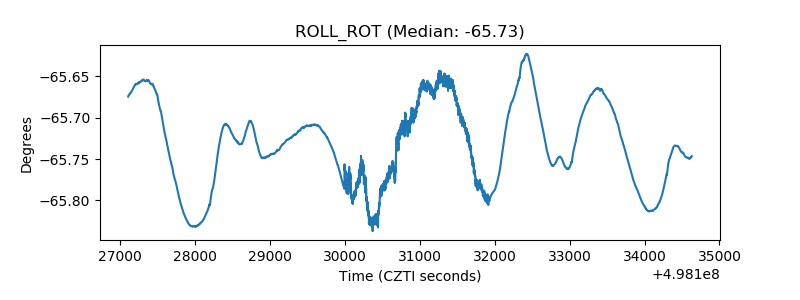 |
| _Roll_DEC | 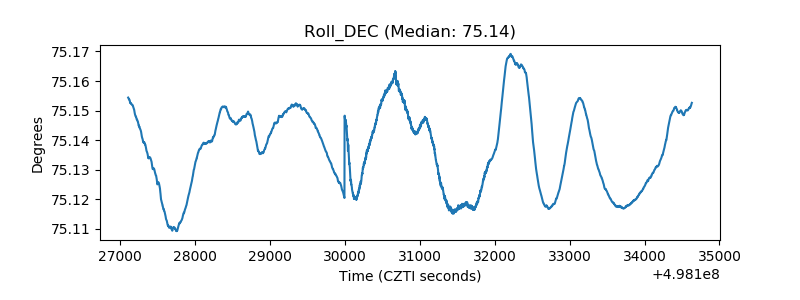 |
| _Roll_RA | 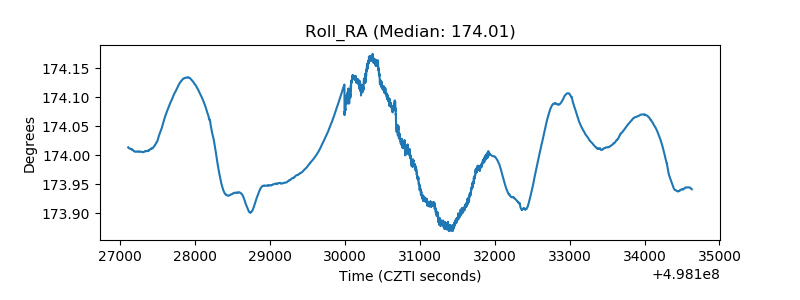 |
| Veto Counter | 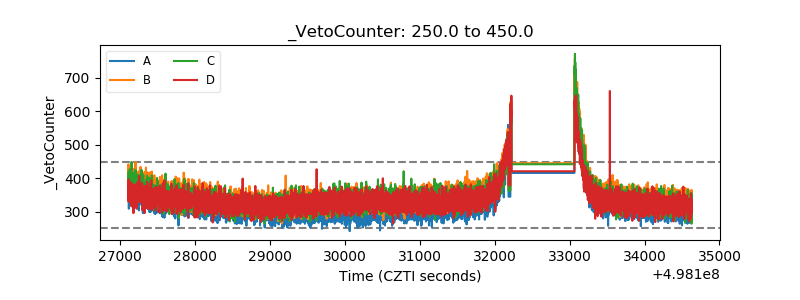 |