| Param | Original file | Final file |
|---|---|---|
| Filename | modeM0/AS1A14_126T15_9000006516_54346cztM0_level2.fits | modeM0/AS1A14_126T15_9000006516_54346cztM0_level2_quad_clean.evt |
| Size (bytes) | 784,687,680 | 83,600,640 |
| Size | 748.3 MB | 79.7 MB |
| Events in quadrant A | 3,007,244 | 669,023 |
| Events in quadrant B | 3,243,662 | 707,657 |
| Events in quadrant C | 5,873,433 | 540,913 |
| Events in quadrant D | 16,377,237 | 125,232 |
| Mode SS | |||
|---|---|---|---|
| Quadrant | BADHDUFLAG | Total packets | Discarded packets |
| A | 0 | 140 | 0 |
| B | 0 | 140 | 0 |
| C | 0 | 140 | 0 |
| D | 0 | 140 | 0 |
| Mode M0 | |||
|---|---|---|---|
| Quadrant | BADHDUFLAG | Total packets | Discarded packets |
| A | 0 | 14277 | 0 |
| B | 0 | 14739 | 0 |
| C | 0 | 22541 | 1 |
| D | 0 | 53398 | 0 |
| Quadrant | Total seconds | Saturated seconds | Saturation percentage |
|---|---|---|---|
| A | 7012 | 5 | 0.071306% |
| B | 7013 | 24 | 0.342222% |
| C | 7012 | 984 | 14.033086% |
| D | 7012 | 5710 | 81.431831% |
Noise dominated data is calculated using 1-second bins in cleaned event files. If a bin has >2000 counts, and if more than 50% of those come from <1% of pixels, then it is considered to be noise-dominated and hence unusable.
| Quadrant | # 1 sec bins | Bins with >0 counts | Bins with >2000 counts | High rate bins dominated by noise | Noise dominated (total time) | Noise dominated (detector-on time) | Marked lightcurve |
|---|---|---|---|---|---|---|---|
| A | 7012 | 7012 | 2 | 2 | 0.03% | 0.03% | 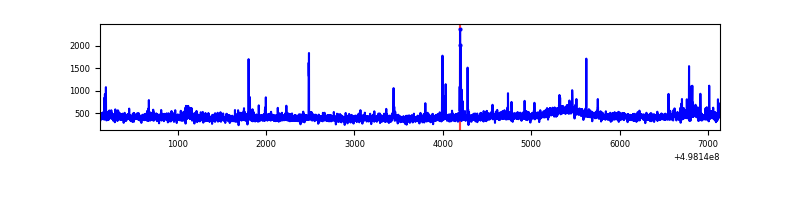 |
| B | 7013 | 7013 | 13 | 13 | 0.19% | 0.19% | 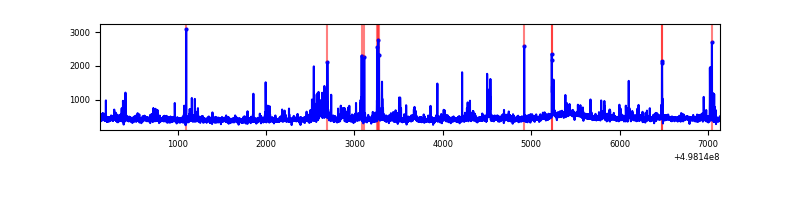 |
| C | 7012 | 7012 | 977 | 977 | 13.93% | 13.93% | 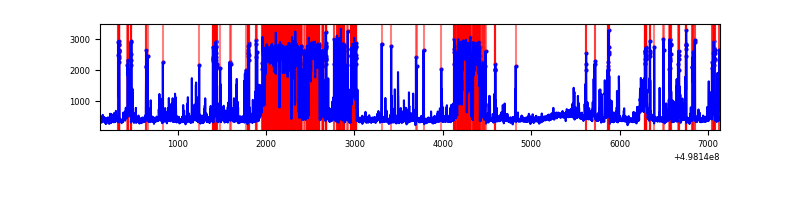 |
| D | 7011 | 7011 | 5584 | 5584 | 79.65% | 79.65% | 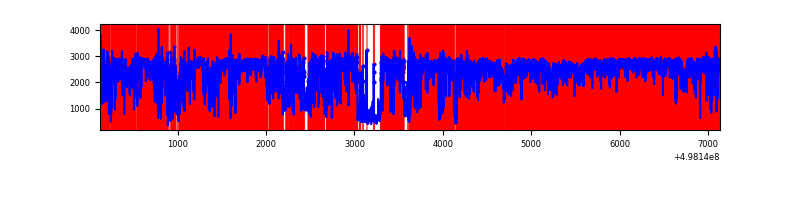 |
Top three noisy pixels from each quadrant. If the there are fewer than three noisy pixels in the level2.evt file, extra rows are filled as -1
| Pixel properties | Quadrant properties | ||||||
|---|---|---|---|---|---|---|---|
| Quadrant | DetID | PixID | Counts | Sigma | Mean | Median | Sigma |
| A | 4 | 3 | 28462 | 152.91 | 736 | 718 | 181.4 |
| A | 6 | 161 | 27509 | 147.66 | 736 | 718 | 181.4 |
| A | 3 | 114 | 23529 | 125.72 | 736 | 718 | 181.4 |
| B | 0 | 171 | 88607 | 561.69 | 721 | 692 | 156.5 |
| B | 10 | 247 | 75363 | 477.07 | 721 | 692 | 156.5 |
| B | 14 | 167 | 40630 | 255.16 | 721 | 692 | 156.5 |
| C | 1 | 241 | 1793145 | 9857.99 | 663 | 654 | 181.8 |
| C | 13 | 3 | 625765 | 3437.86 | 663 | 654 | 181.8 |
| C | 14 | 254 | 434381 | 2385.33 | 663 | 654 | 181.8 |
| D | 8 | 176 | 11463798 | 135200.84 | 294 | 279 | 84.8 |
| D | 15 | 108 | 3460145 | 40805.69 | 294 | 279 | 84.8 |
| D | 1 | 3 | 89607 | 1053.54 | 294 | 279 | 84.8 |
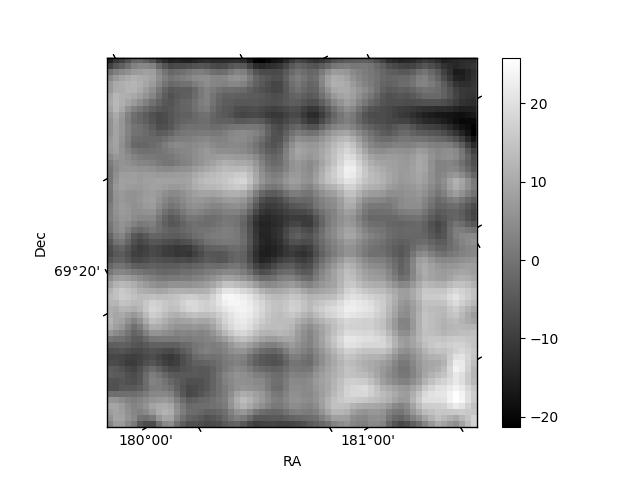
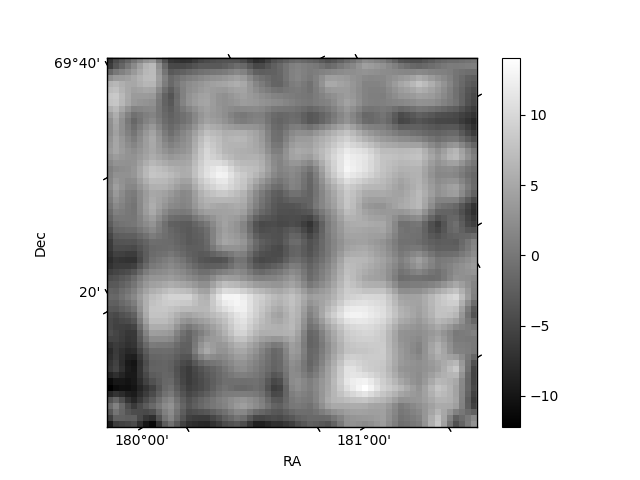
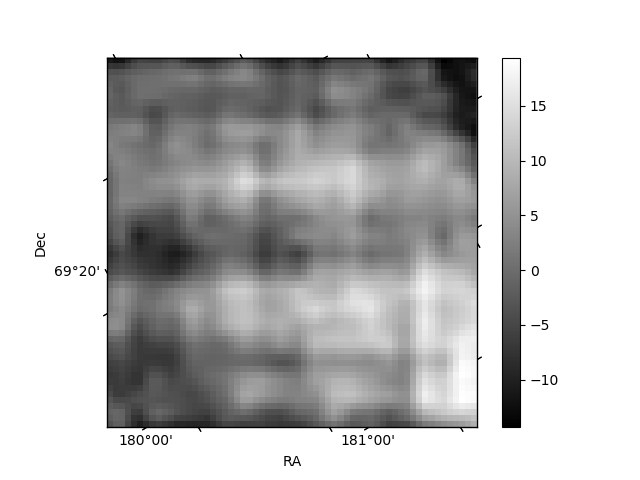
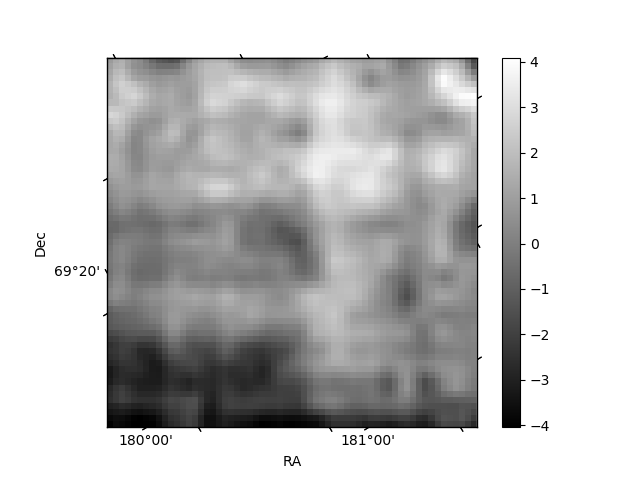
Histogram calculated using DETX and DETY for each event in the final _common_clean file
| Quadrant A | 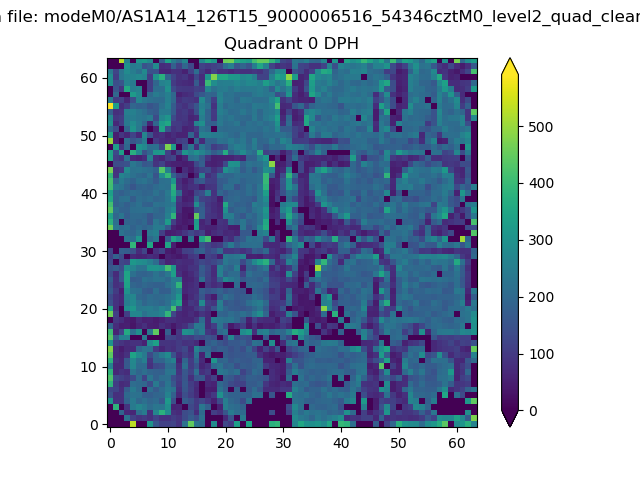 |
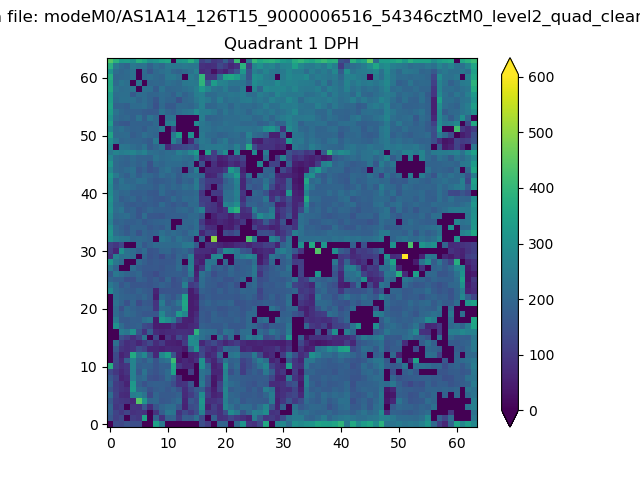 |
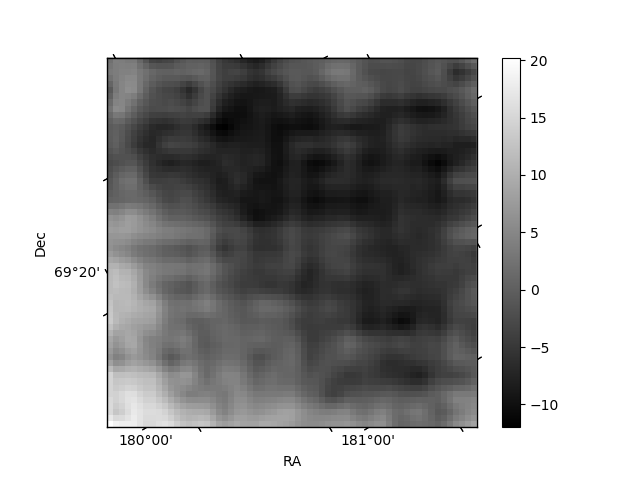
Quadrant B |
|---|---|---|---|
| Quadrant D | 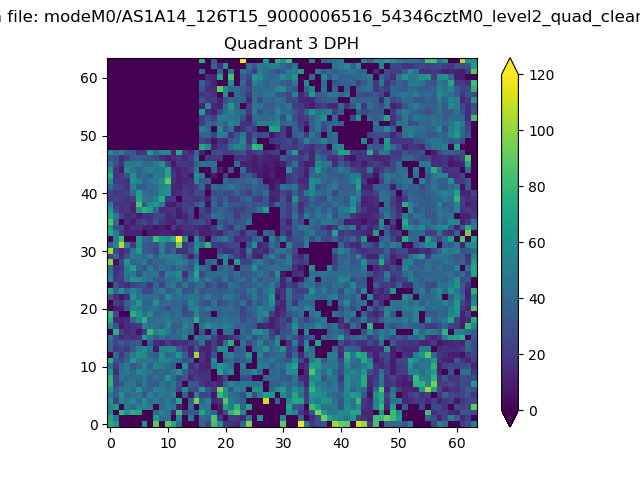 |
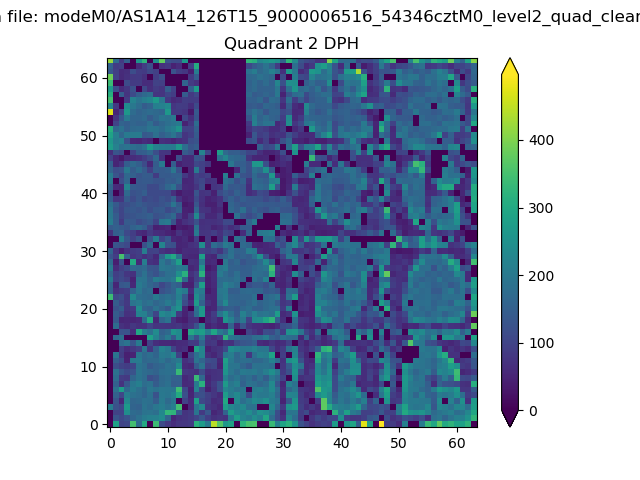 |
Quadrant C |
| Plot type | Count rate plots | Images |
|---|---|---|
| Comparison with Poisson distribution Blue bars denote a histogram of data divided into 1 sec bins. Red curve is a Poisson curve with rate = median count rate of data. |
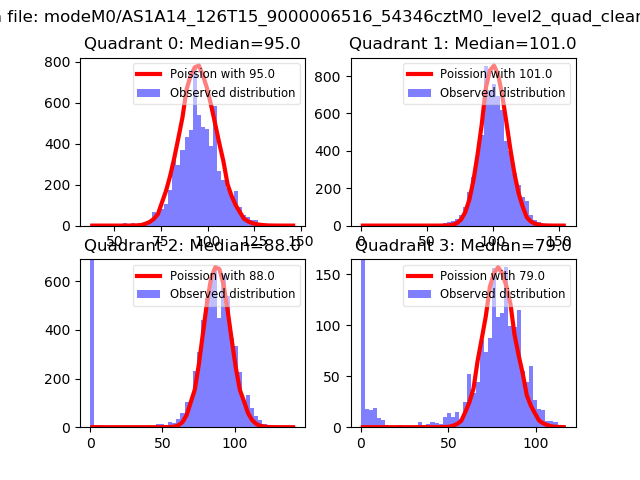 |
 |
| Quadrant-wise count rates Data is divided into 100 sec bins |
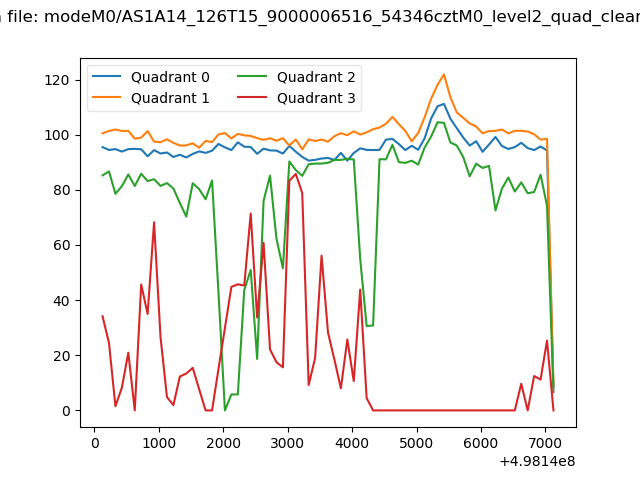 |
|
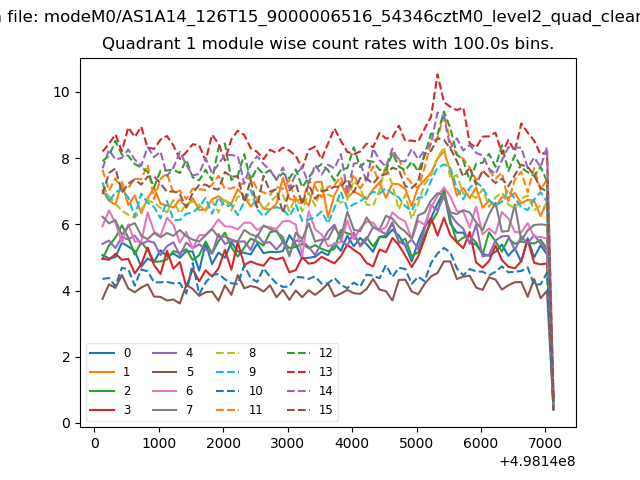
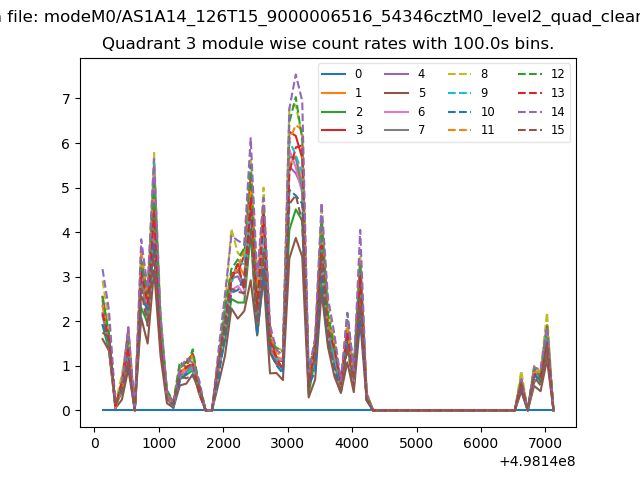
| Module-wise count rates for Quadrant A Data is divided into 100 sec bins |
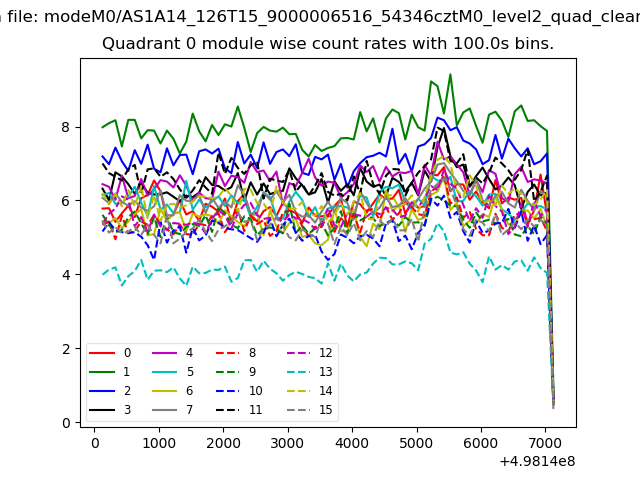 |
 |
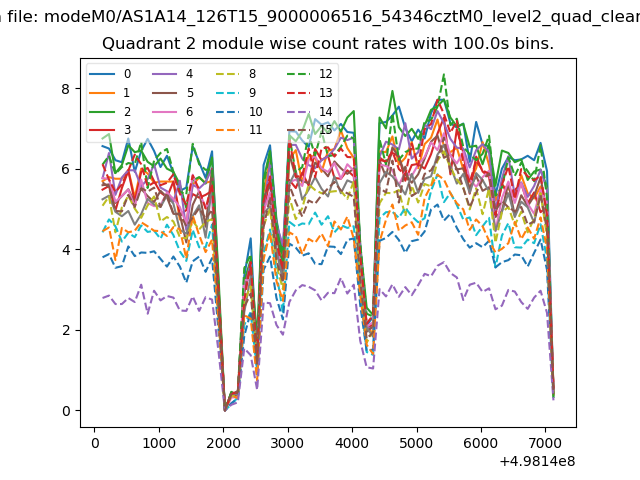
| Module-wise count rates for Quadrant B Data is divided into 100 sec bins |
 |
 |
| Module-wise count rates for Quadrant C Data is divided into 100 sec bins |
 |
 |
| Module-wise count rates for Quadrant D Data is divided into 100 sec bins |
 |
 |
| Parameter | Plot |
|---|---|
| CZT HV Monitor | 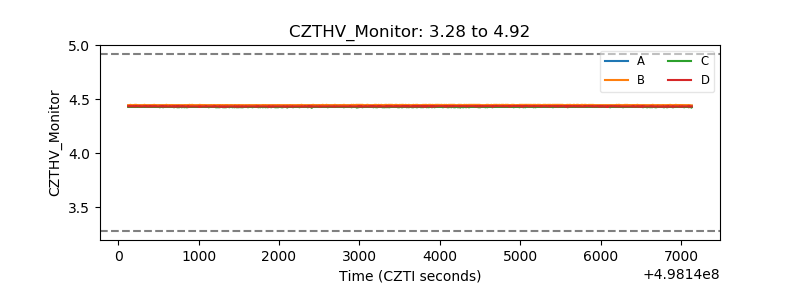 |
| D_VDD | 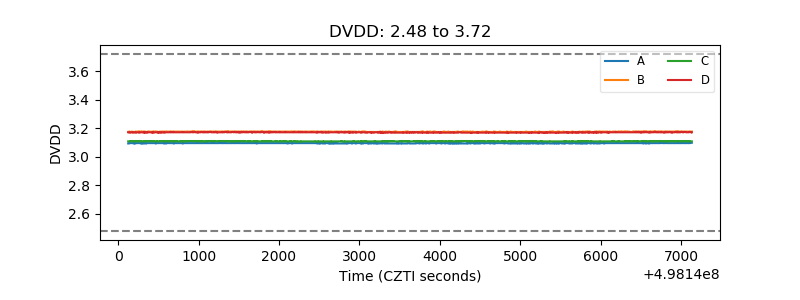 |
| Temperature 1 | 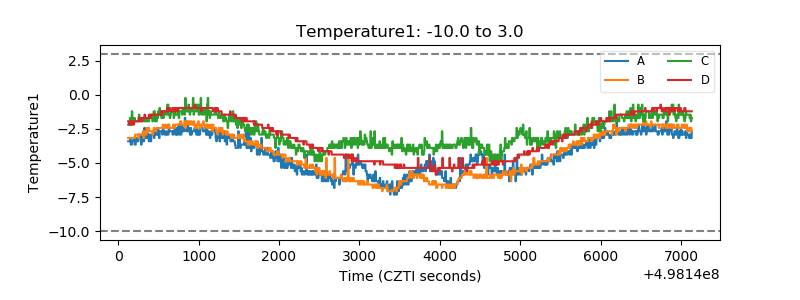 |
| Veto HV Monitor | 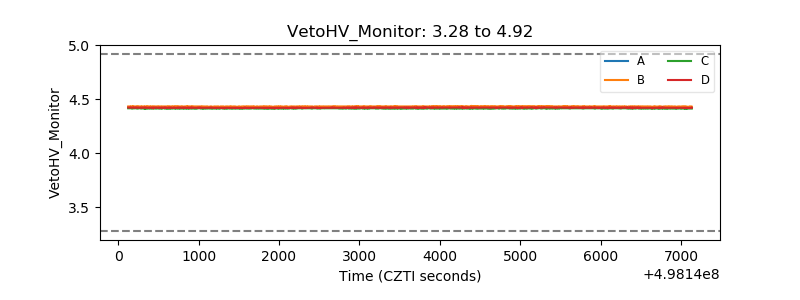 |
| Veto LLD | 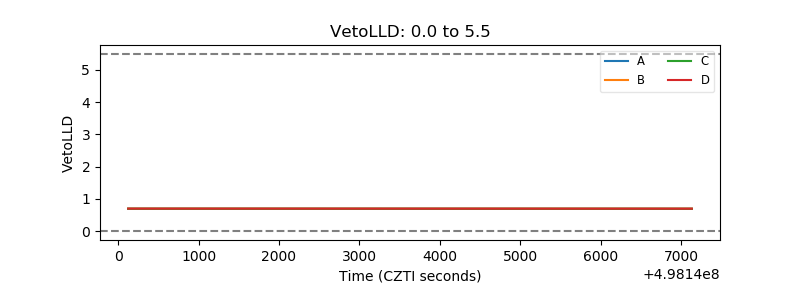 |
| Alpha Counter | 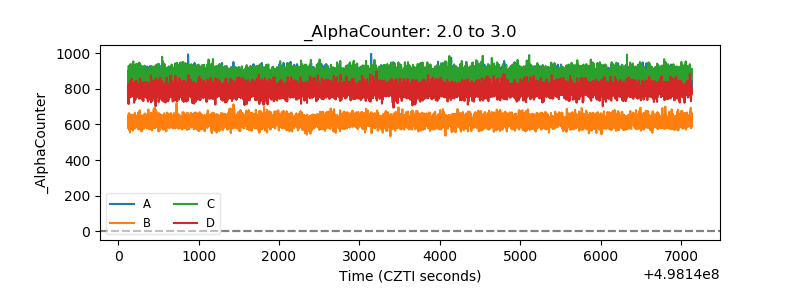 |
| _CPM_Rate | 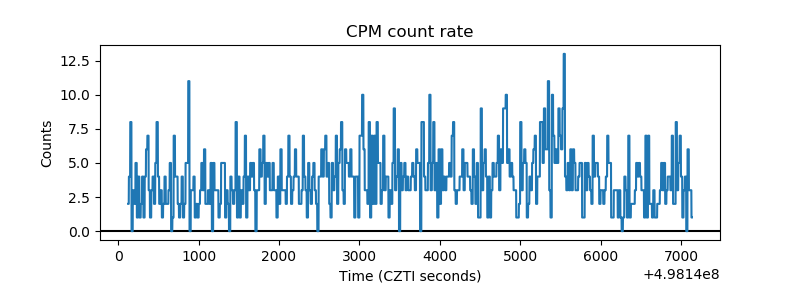 |
| CZT Counter | 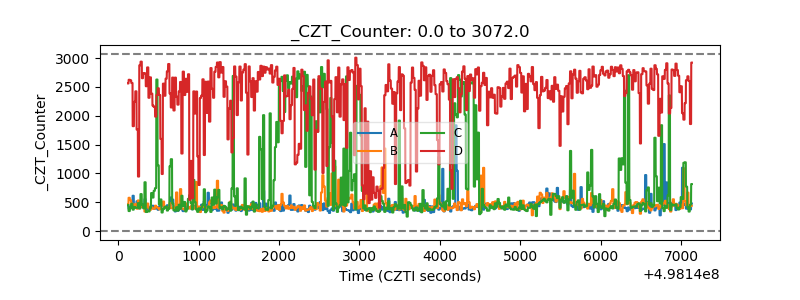 |
| +2.5 Volts monitor |  |
| +5 Volts monitor |  |
| _ROLL_ROT | 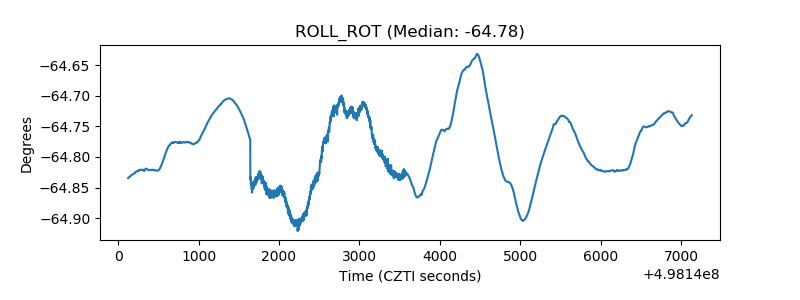 |
| _Roll_DEC | 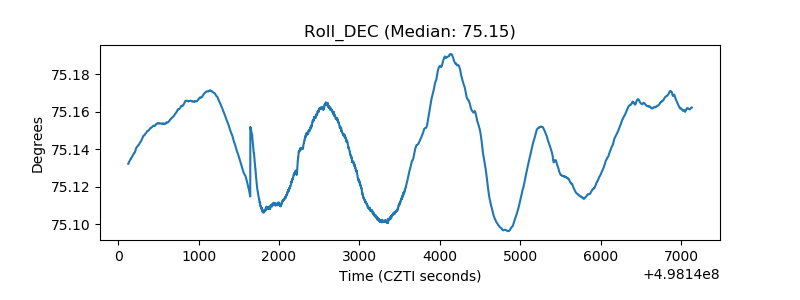 |
| _Roll_RA | 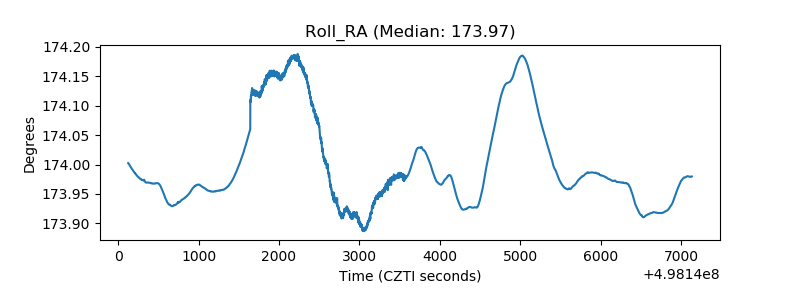 |
| Veto Counter | 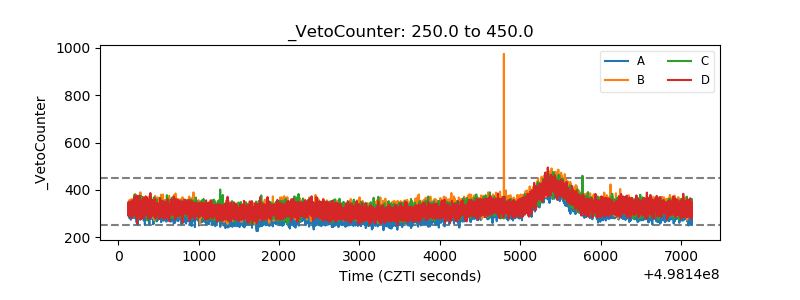 |