| Param | Original file | Final file |
|---|---|---|
| Filename | modeM0/AS1A14_126T15_9000006516_54347cztM0_level2.fits | modeM0/AS1A14_126T15_9000006516_54347cztM0_level2_quad_clean.evt |
| Size (bytes) | 819,624,960 | 88,079,040 |
| Size | 781.7 MB | 84.0 MB |
| Events in quadrant A | 3,310,228 | 698,658 |
| Events in quadrant B | 3,377,240 | 739,777 |
| Events in quadrant C | 6,657,530 | 558,096 |
| Events in quadrant D | 16,421,992 | 156,621 |
| Mode SS | |||
|---|---|---|---|
| Quadrant | BADHDUFLAG | Total packets | Discarded packets |
| A | 0 | 148 | 0 |
| B | 0 | 148 | 0 |
| C | 0 | 148 | 0 |
| D | 0 | 148 | 0 |
| Mode M0 | |||
|---|---|---|---|
| Quadrant | BADHDUFLAG | Total packets | Discarded packets |
| A | 0 | 15464 | 1 |
| B | 0 | 15442 | 0 |
| C | 0 | 25093 | 0 |
| D | 0 | 53813 | 0 |
| Quadrant | Total seconds | Saturated seconds | Saturation percentage |
|---|---|---|---|
| A | 7378 | 24 | 0.325291% |
| B | 7378 | 32 | 0.433722% |
| C | 7378 | 1169 | 15.844402% |
| D | 7379 | 5600 | 75.891042% |
Noise dominated data is calculated using 1-second bins in cleaned event files. If a bin has >2000 counts, and if more than 50% of those come from <1% of pixels, then it is considered to be noise-dominated and hence unusable.
| Quadrant | # 1 sec bins | Bins with >0 counts | Bins with >2000 counts | High rate bins dominated by noise | Noise dominated (total time) | Noise dominated (detector-on time) | Marked lightcurve |
|---|---|---|---|---|---|---|---|
| A | 7378 | 7378 | 19 | 19 | 0.26% | 0.26% | 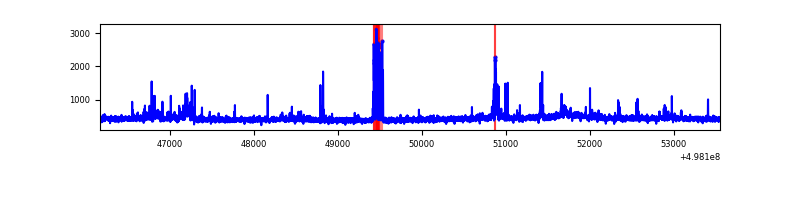 |
| B | 7378 | 7378 | 19 | 19 | 0.26% | 0.26% | 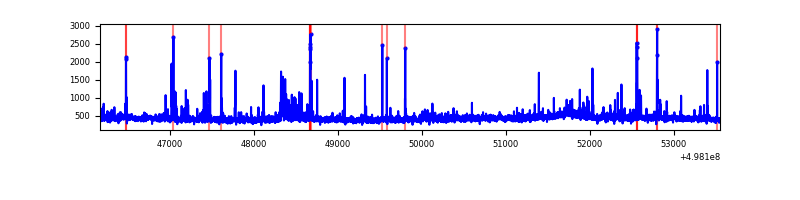 |
| C | 7378 | 7378 | 1116 | 1116 | 15.13% | 15.13% | 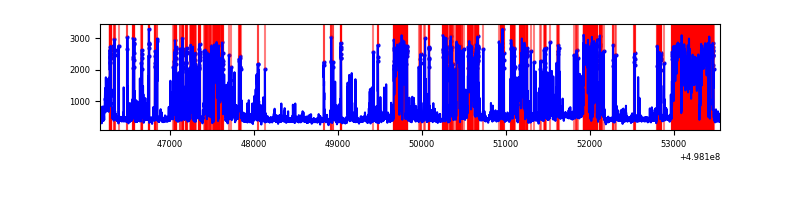 |
| D | 7379 | 7379 | 5537 | 5537 | 75.04% | 75.04% | 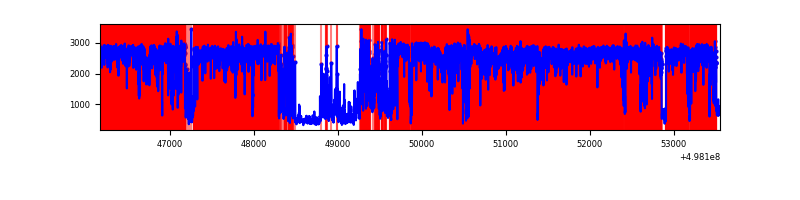 |
Top three noisy pixels from each quadrant. If the there are fewer than three noisy pixels in the level2.evt file, extra rows are filled as -1
| Pixel properties | Quadrant properties | ||||||
|---|---|---|---|---|---|---|---|
| Quadrant | DetID | PixID | Counts | Sigma | Mean | Median | Sigma |
| A | 0 | 8 | 155149 | 809.16 | 770 | 749 | 190.8 |
| A | 3 | 114 | 34881 | 178.87 | 770 | 749 | 190.8 |
| A | 15 | 174 | 31175 | 159.45 | 770 | 749 | 190.8 |
| B | 10 | 247 | 79672 | 484.62 | 759 | 731 | 162.9 |
| B | 0 | 171 | 75378 | 458.26 | 759 | 731 | 162.9 |
| B | 5 | 172 | 40437 | 243.76 | 759 | 731 | 162.9 |
| C | 1 | 241 | 2214352 | 11889.26 | 687 | 680 | 186.2 |
| C | 13 | 3 | 839298 | 4504.08 | 687 | 680 | 186.2 |
| C | 14 | 254 | 381659 | 2046.17 | 687 | 680 | 186.2 |
| D | 8 | 176 | 10871863 | 111566.08 | 338 | 322 | 97.4 |
| D | 15 | 108 | 3884024 | 39855.38 | 338 | 322 | 97.4 |
| D | 2 | 172 | 76897 | 785.83 | 338 | 322 | 97.4 |
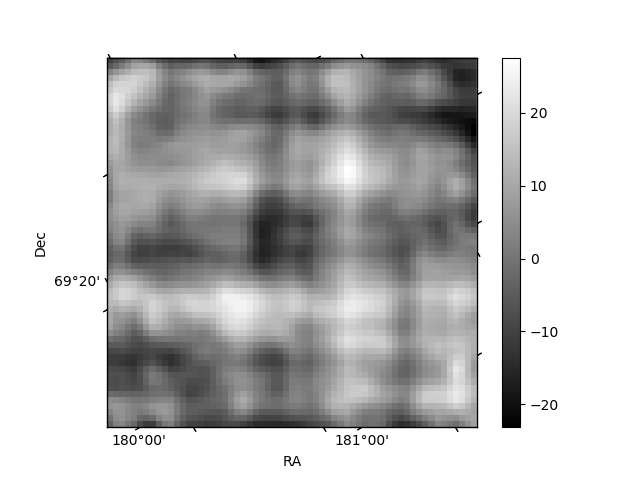
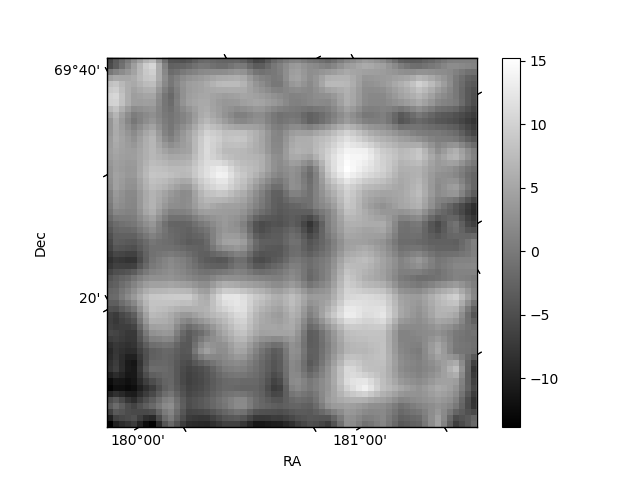
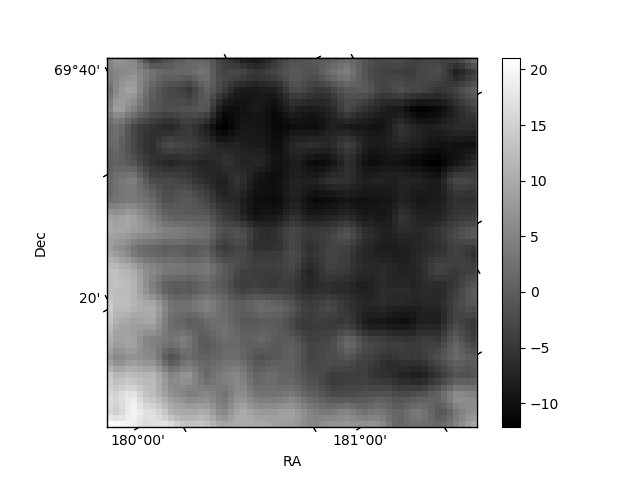
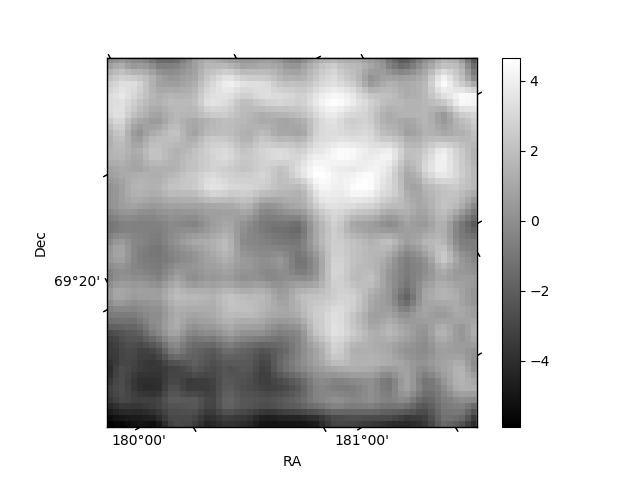
Histogram calculated using DETX and DETY for each event in the final _common_clean file
| Quadrant A | 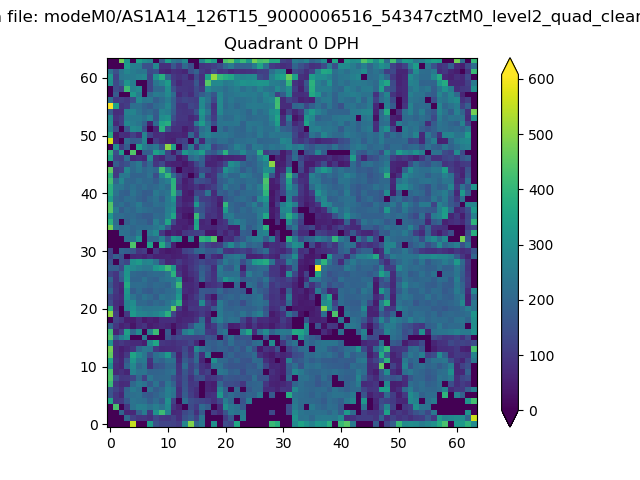 |
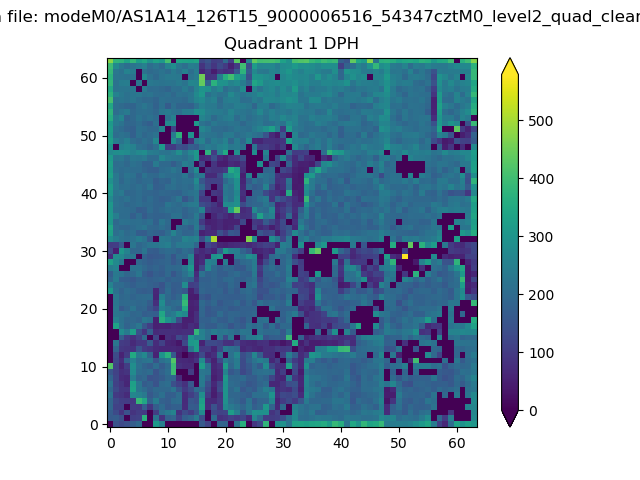 |
Quadrant B |
|---|---|---|---|
| Quadrant D | 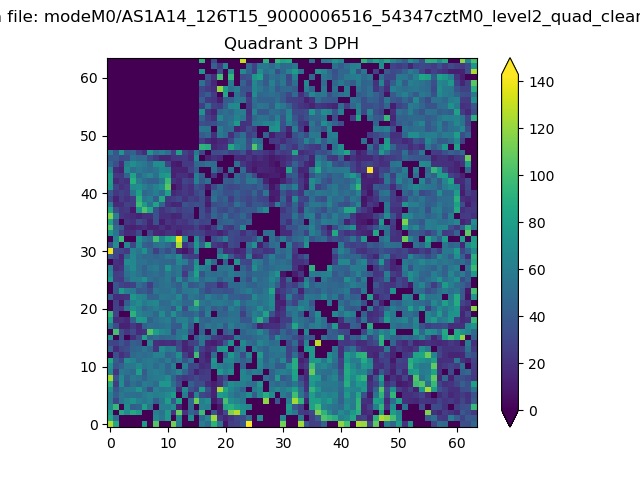 |
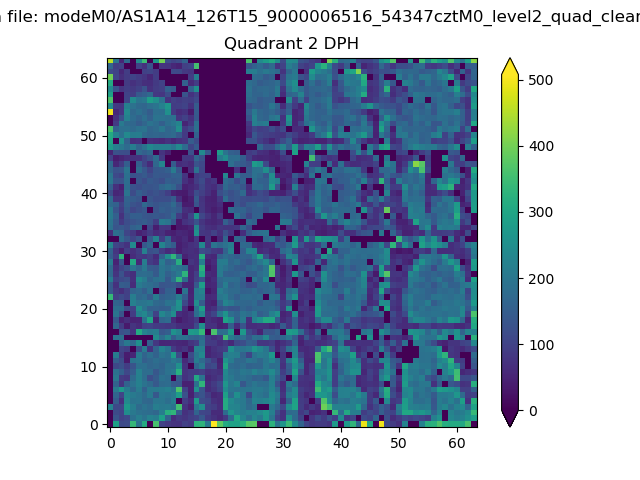 |
Quadrant C |
| Plot type | Count rate plots | Images |
|---|---|---|
| Comparison with Poisson distribution Blue bars denote a histogram of data divided into 1 sec bins. Red curve is a Poisson curve with rate = median count rate of data. |
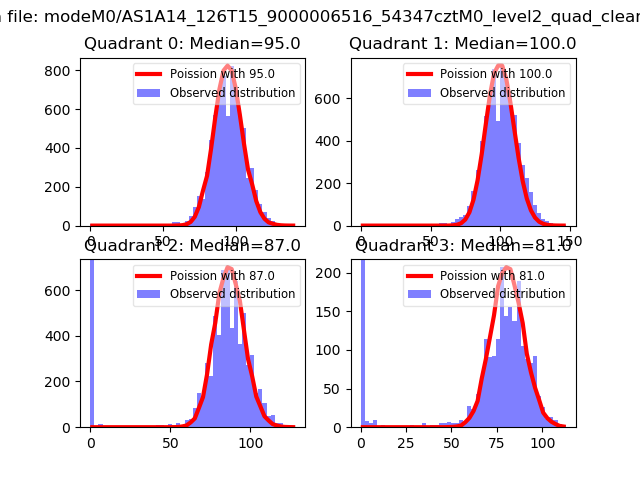 |
 |
| Quadrant-wise count rates Data is divided into 100 sec bins |
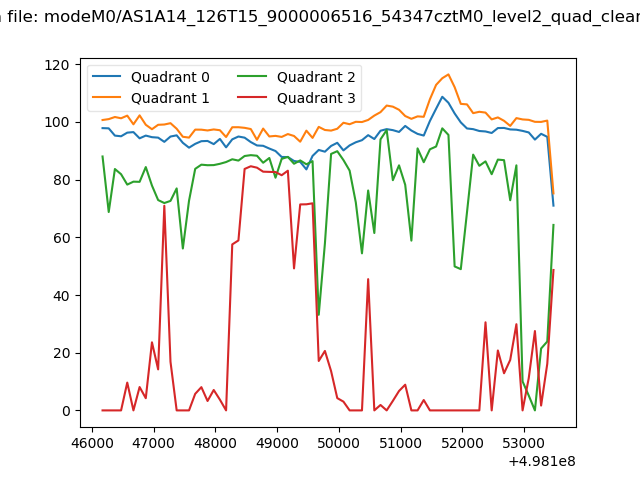 |
|
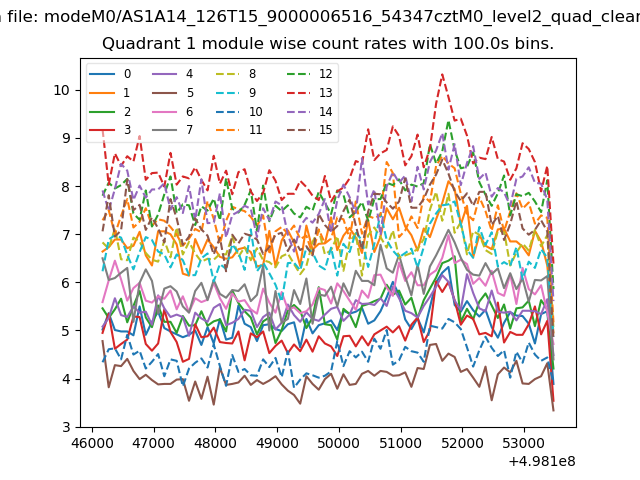
| Module-wise count rates for Quadrant A Data is divided into 100 sec bins |
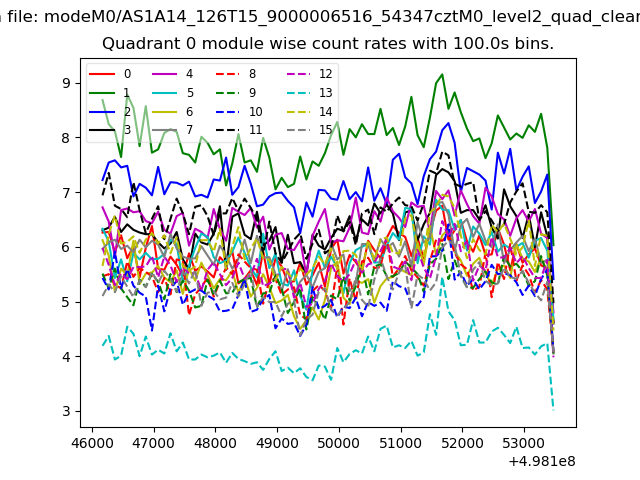 |
 |
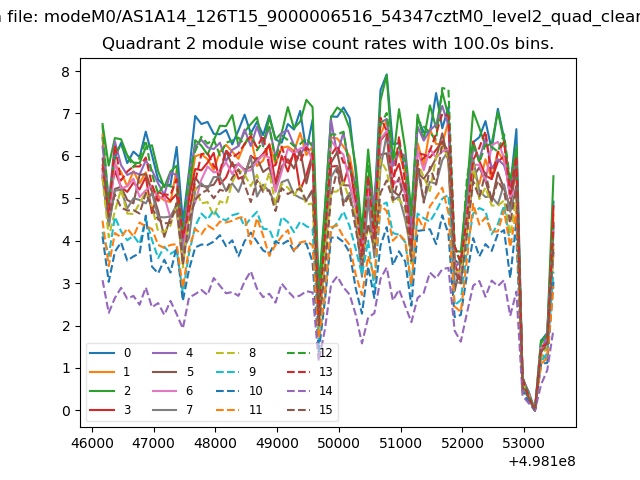
| Module-wise count rates for Quadrant B Data is divided into 100 sec bins |
 |
 |
| Module-wise count rates for Quadrant C Data is divided into 100 sec bins |
 |
 |
| Module-wise count rates for Quadrant D Data is divided into 100 sec bins |
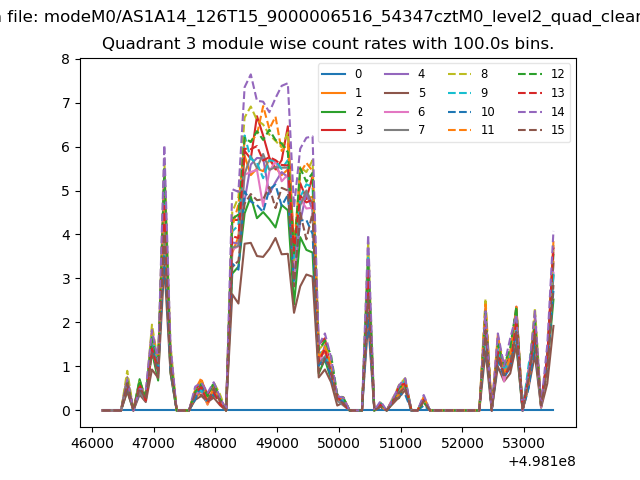 |
 |
| Parameter | Plot |
|---|---|
| CZT HV Monitor | 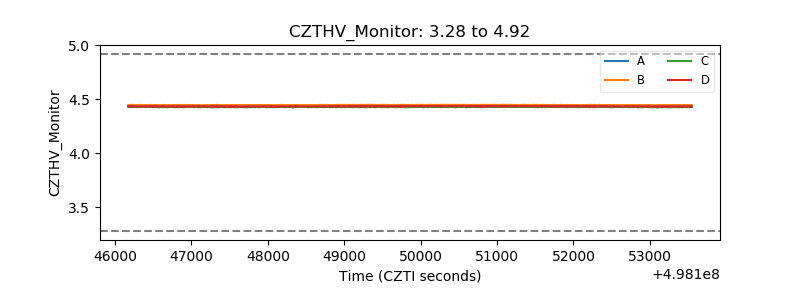 |
| D_VDD | 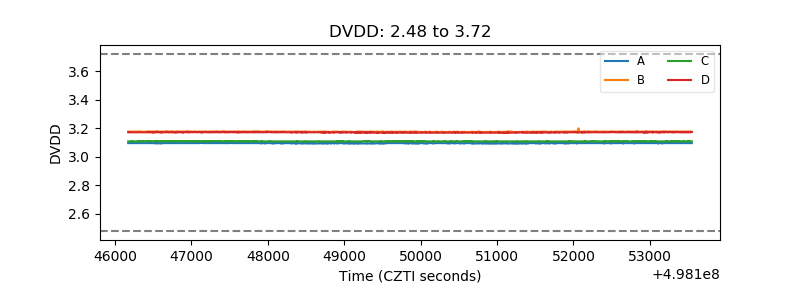 |
| Temperature 1 | 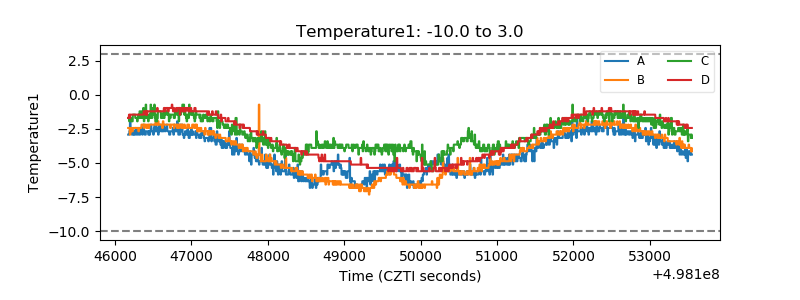 |
| Veto HV Monitor |  |
| Veto LLD | 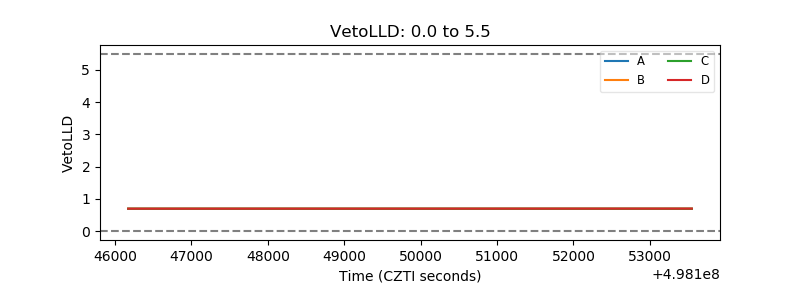 |
| Alpha Counter | 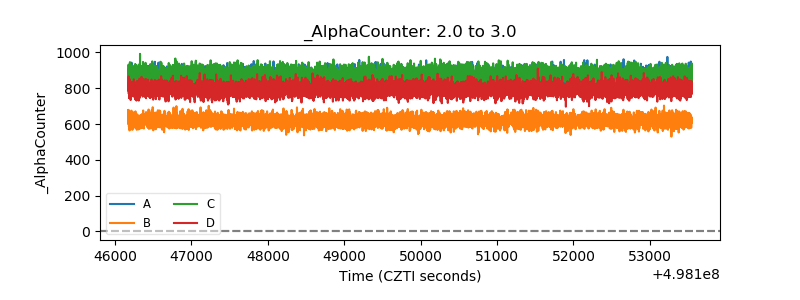 |
| _CPM_Rate | 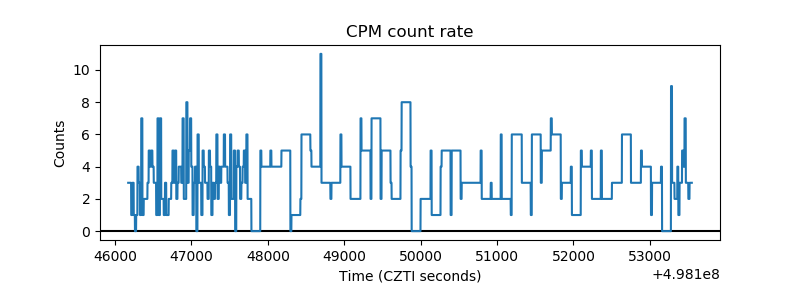 |
| CZT Counter | 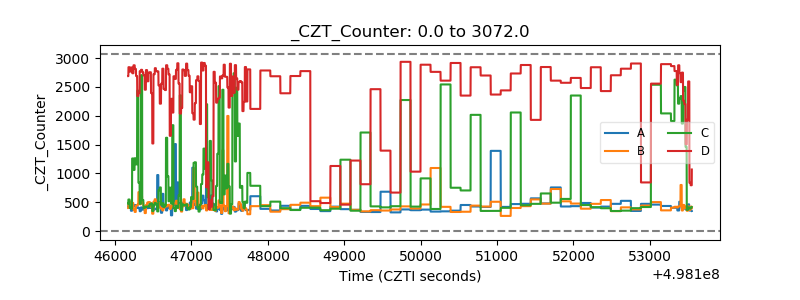 |
| +2.5 Volts monitor |  |
| +5 Volts monitor |  |
| _ROLL_ROT | 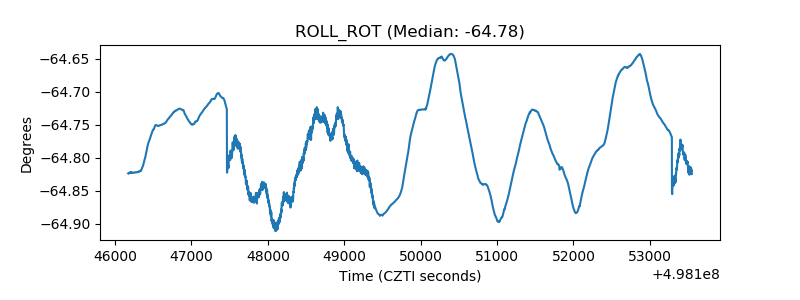 |
| _Roll_DEC | 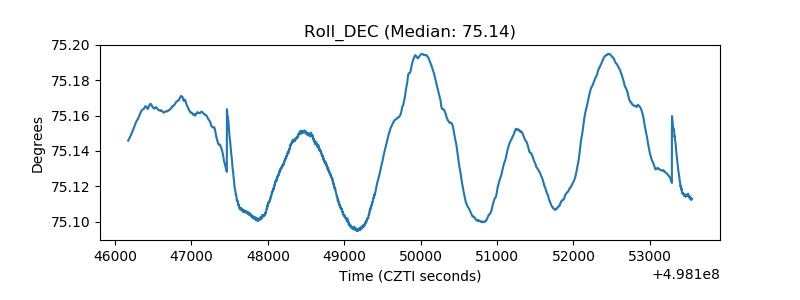 |
| _Roll_RA | 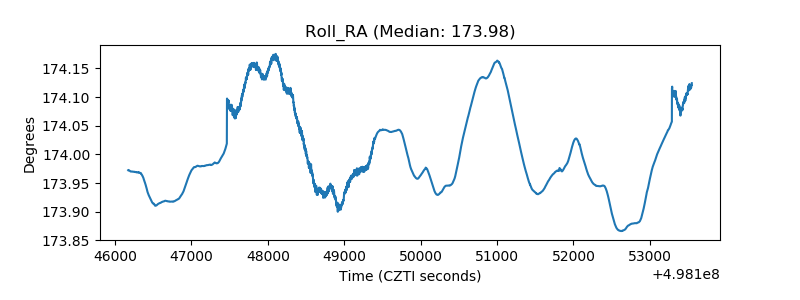 |
| Veto Counter | 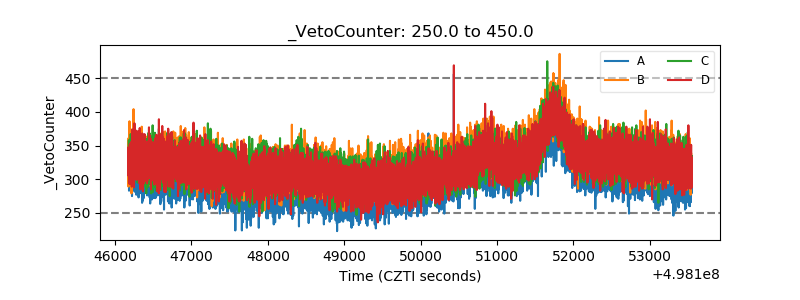 |