| Param | Original file | Final file |
|---|---|---|
| Filename | modeM0/AS1A14_126T15_9000006516_54350cztM0_level2.fits | modeM0/AS1A14_126T15_9000006516_54350cztM0_level2_quad_clean.evt |
| Size (bytes) | 965,099,520 | 120,386,880 |
| Size | 920.4 MB | 114.8 MB |
| Events in quadrant A | 4,876,523 | 870,193 |
| Events in quadrant B | 4,648,467 | 946,723 |
| Events in quadrant C | 7,948,278 | 746,557 |
| Events in quadrant D | 17,511,308 | 418,635 |
| Mode SS | |||
|---|---|---|---|
| Quadrant | BADHDUFLAG | Total packets | Discarded packets |
| A | 0 | 192 | 0 |
| B | 0 | 192 | 0 |
| C | 0 | 192 | 0 |
| D | 0 | 192 | 0 |
| Mode M0 | |||
|---|---|---|---|
| Quadrant | BADHDUFLAG | Total packets | Discarded packets |
| A | 0 | 21876 | 0 |
| B | 0 | 20946 | 0 |
| C | 0 | 30546 | 0 |
| D | 0 | 58579 | 0 |
| Quadrant | Total seconds | Saturated seconds | Saturation percentage |
|---|---|---|---|
| A | 9556 | 281 | 2.940561% |
| B | 9557 | 99 | 1.035890% |
| C | 9557 | 1168 | 12.221408% |
| D | 9557 | 4762 | 49.827352% |
Noise dominated data is calculated using 1-second bins in cleaned event files. If a bin has >2000 counts, and if more than 50% of those come from <1% of pixels, then it is considered to be noise-dominated and hence unusable.
| Quadrant | # 1 sec bins | Bins with >0 counts | Bins with >2000 counts | High rate bins dominated by noise | Noise dominated (total time) | Noise dominated (detector-on time) | Marked lightcurve |
|---|---|---|---|---|---|---|---|
| A | 9556 | 9556 | 269 | 269 | 2.81% | 2.81% | 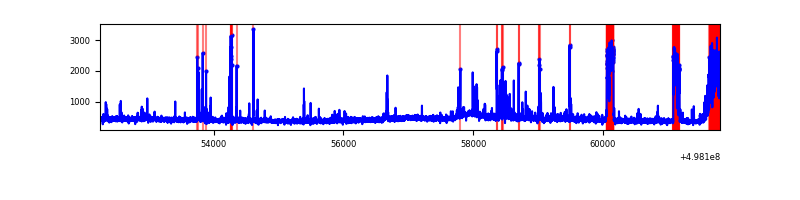 |
| B | 9557 | 9557 | 71 | 71 | 0.74% | 0.74% | 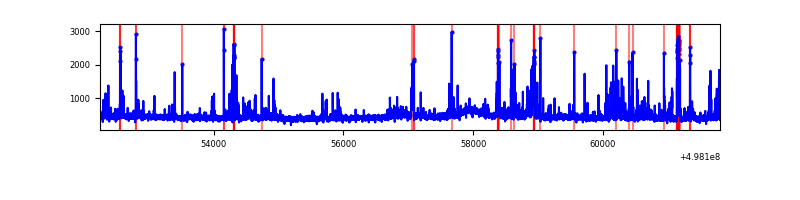 |
| C | 9557 | 9557 | 1058 | 1058 | 11.07% | 11.07% | 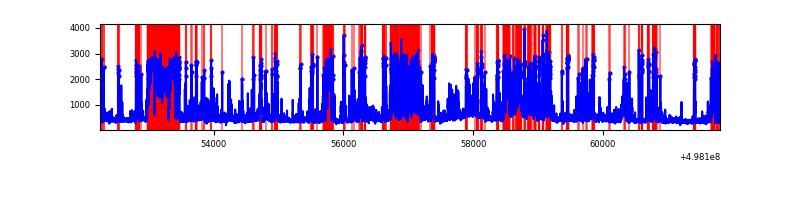 |
| D | 9556 | 9556 | 4839 | 4839 | 50.64% | 50.64% | 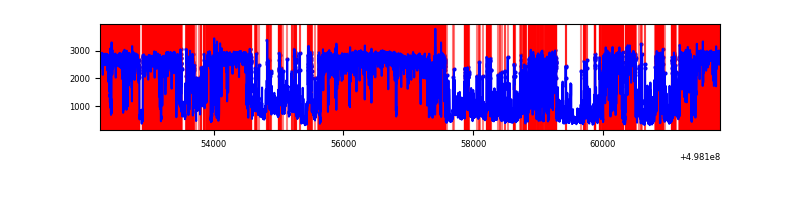 |
Top three noisy pixels from each quadrant. If the there are fewer than three noisy pixels in the level2.evt file, extra rows are filled as -1
| Pixel properties | Quadrant properties | ||||||
|---|---|---|---|---|---|---|---|
| Quadrant | DetID | PixID | Counts | Sigma | Mean | Median | Sigma |
| A | 7 | 29 | 784918 | 3190.56 | 979 | 953 | 245.7 |
| A | 0 | 8 | 123193 | 497.49 | 979 | 953 | 245.7 |
| A | 8 | 246 | 52585 | 210.13 | 979 | 953 | 245.7 |
| B | 0 | 171 | 189724 | 901.02 | 976 | 941 | 209.5 |
| B | 0 | 213 | 140055 | 663.96 | 976 | 941 | 209.5 |
| B | 10 | 247 | 87111 | 411.27 | 976 | 941 | 209.5 |
| C | 1 | 241 | 953235 | 3868.72 | 902 | 896 | 246.2 |
| C | 14 | 254 | 941505 | 3821.07 | 902 | 896 | 246.2 |
| C | 13 | 3 | 794349 | 3223.27 | 902 | 896 | 246.2 |
| D | 8 | 176 | 7292263 | 37569.98 | 684 | 653 | 194.1 |
| D | 15 | 108 | 6436549 | 33160.92 | 684 | 653 | 194.1 |
| D | 12 | 3 | 342456 | 1761.14 | 684 | 653 | 194.1 |
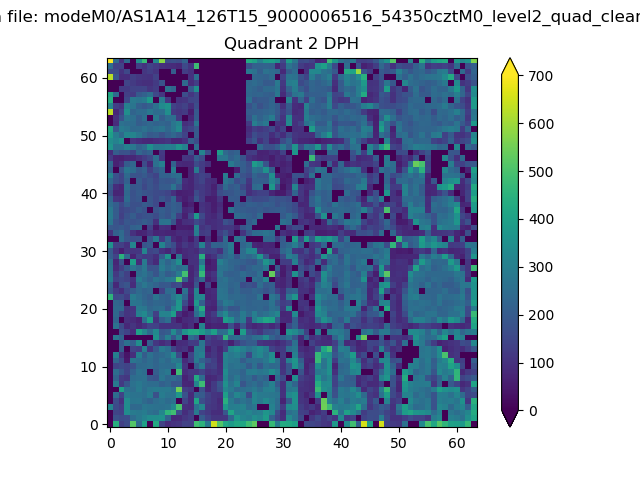
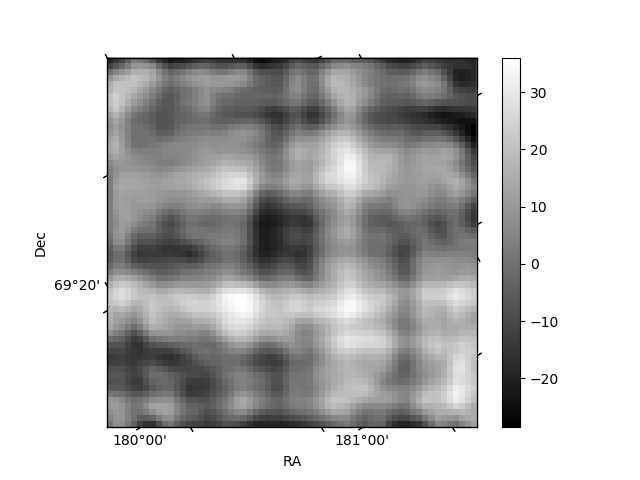
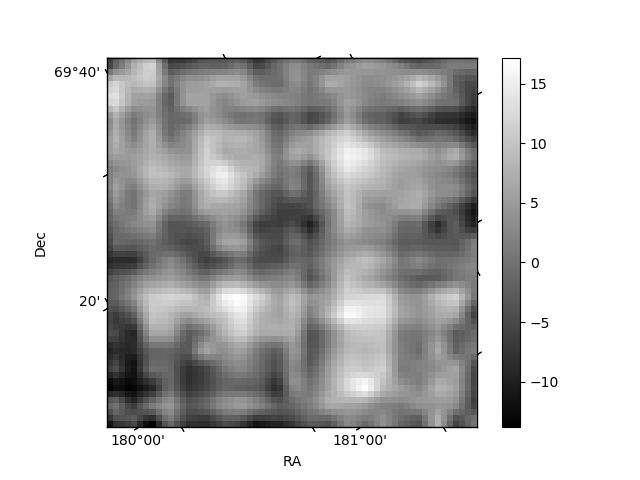
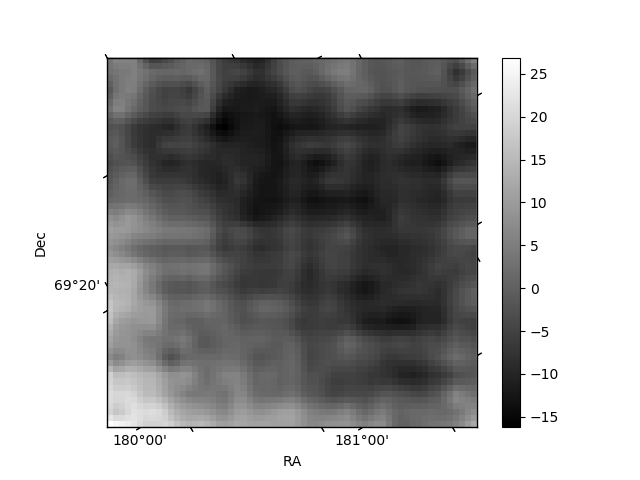
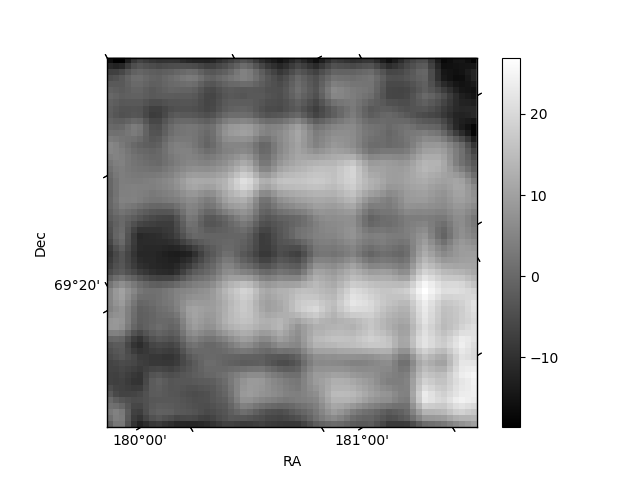
Histogram calculated using DETX and DETY for each event in the final _common_clean file
| Quadrant A |  |
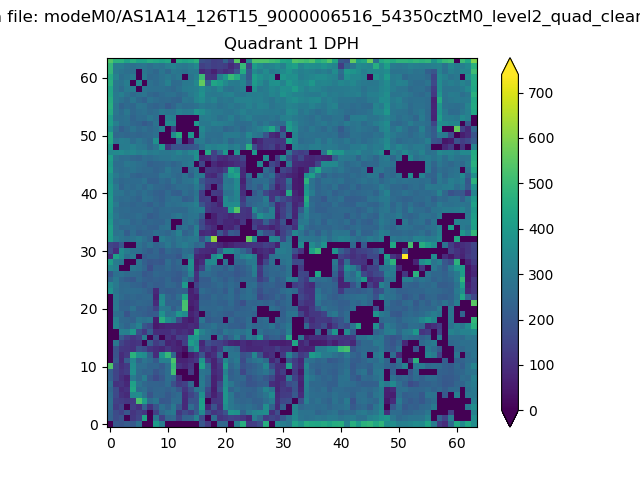 |
Quadrant B |
|---|---|---|---|
| Quadrant D | 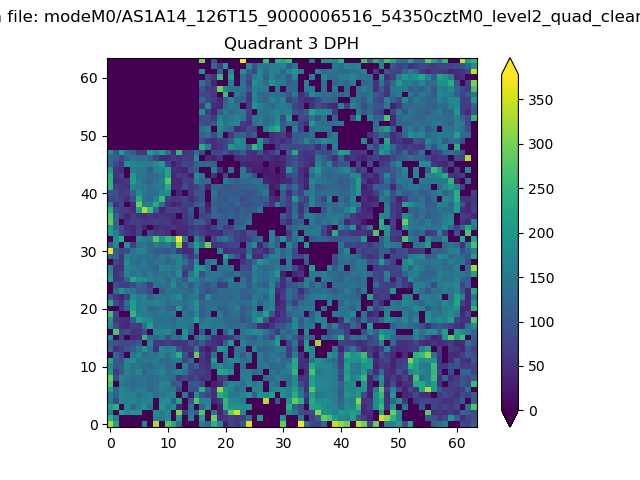 |
 |
Quadrant C |
| Plot type | Count rate plots | Images |
|---|---|---|
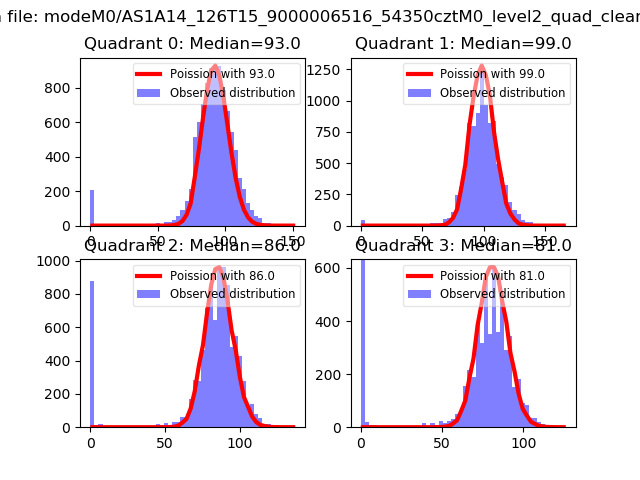
| Comparison with Poisson distribution Blue bars denote a histogram of data divided into 1 sec bins. Red curve is a Poisson curve with rate = median count rate of data. |
 |
 |
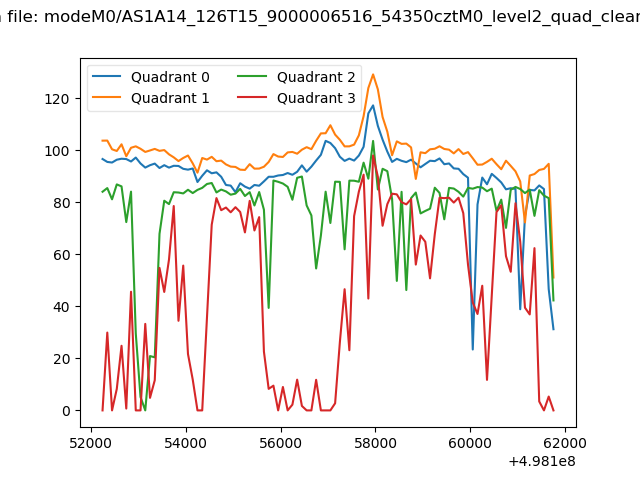
| Quadrant-wise count rates Data is divided into 100 sec bins |
 |
|
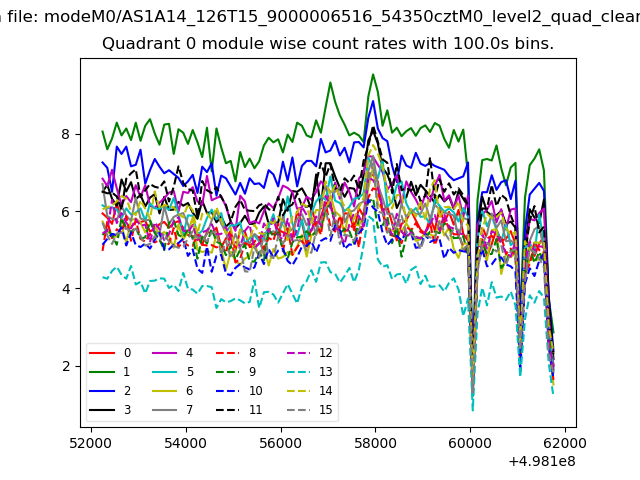
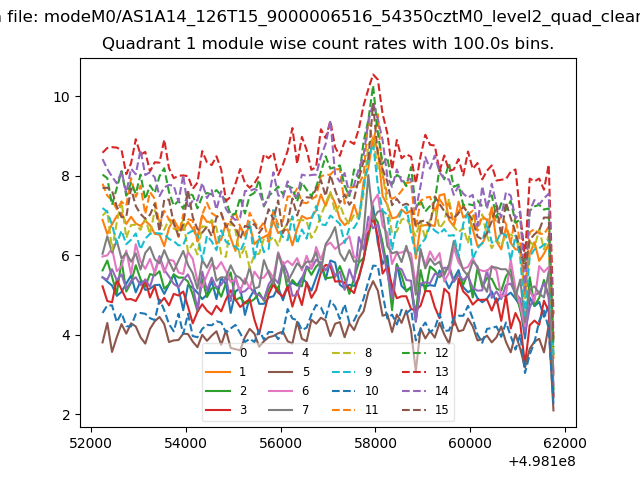
| Module-wise count rates for Quadrant A Data is divided into 100 sec bins |
 |
 |
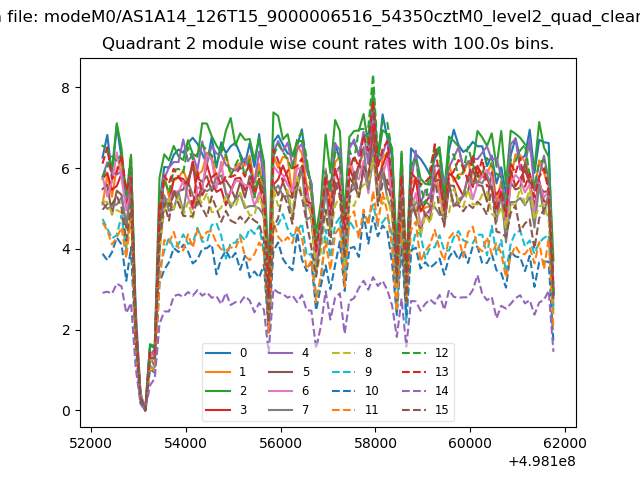
| Module-wise count rates for Quadrant B Data is divided into 100 sec bins |
 |
 |
| Module-wise count rates for Quadrant C Data is divided into 100 sec bins |
 |
 |
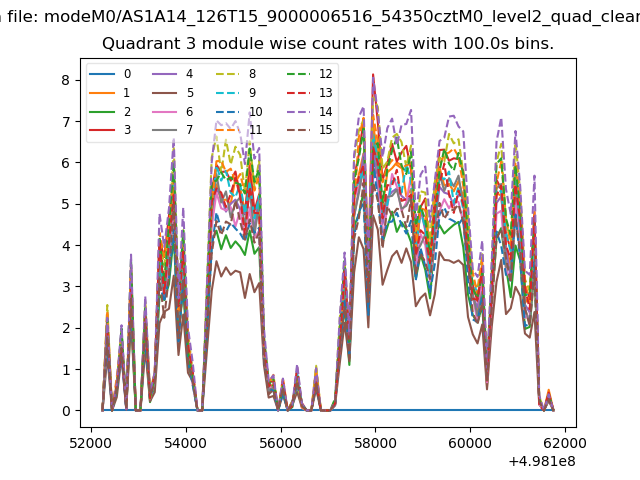
| Module-wise count rates for Quadrant D Data is divided into 100 sec bins |
 |
 |
| Parameter | Plot |
|---|---|
| CZT HV Monitor | 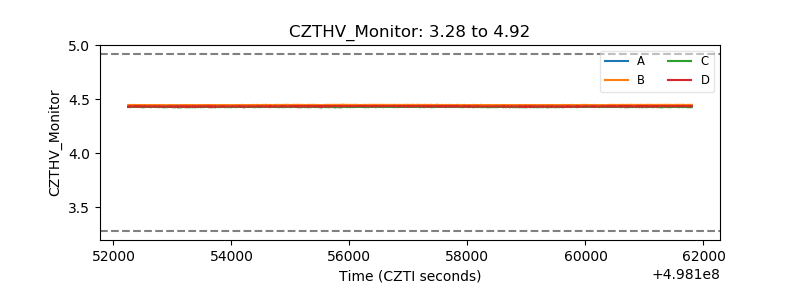 |
| D_VDD | 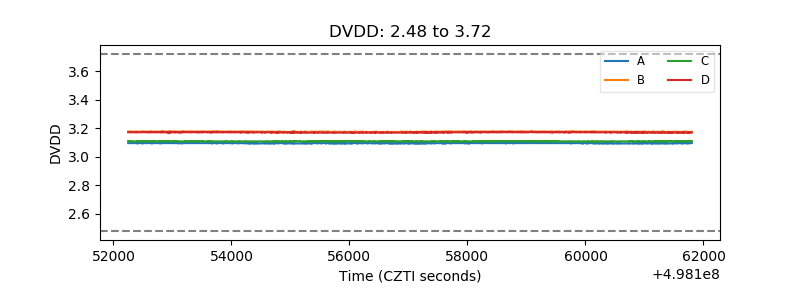 |
| Temperature 1 | 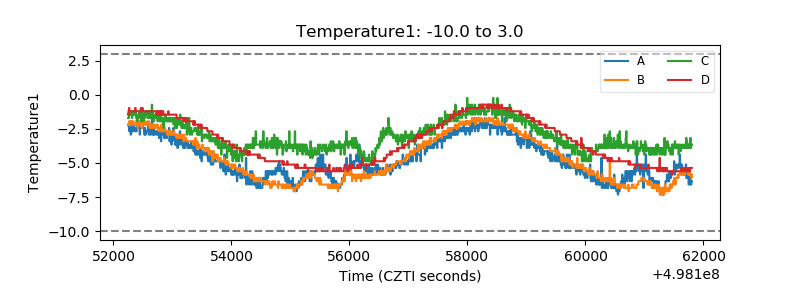 |
| Veto HV Monitor | 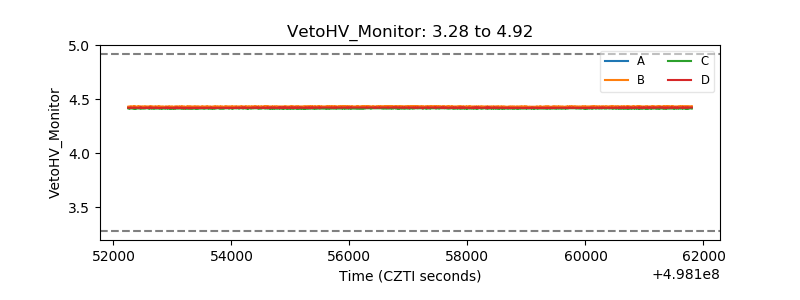 |
| Veto LLD | 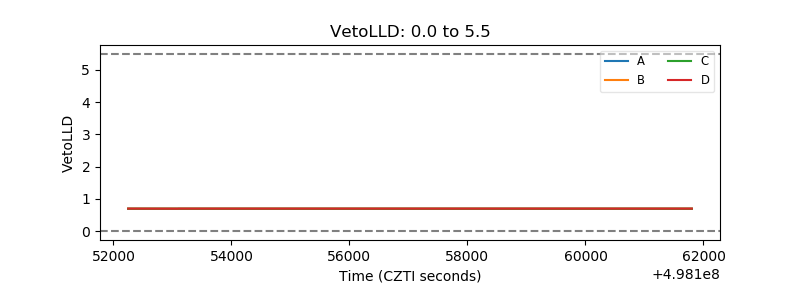 |
| Alpha Counter | 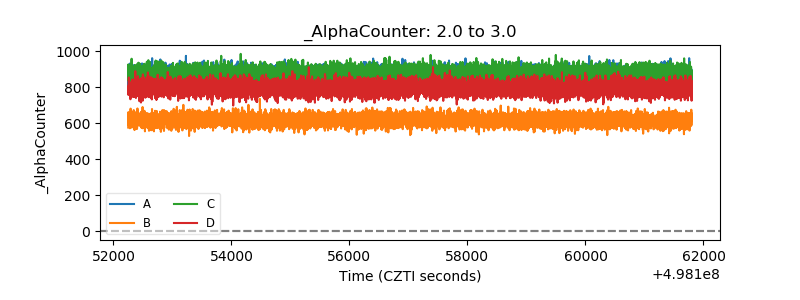 |
| _CPM_Rate | 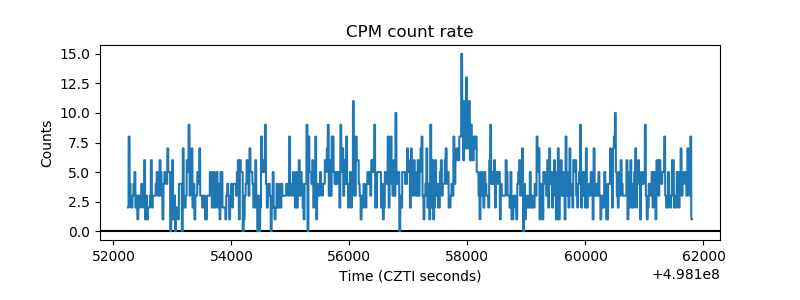 |
| CZT Counter | 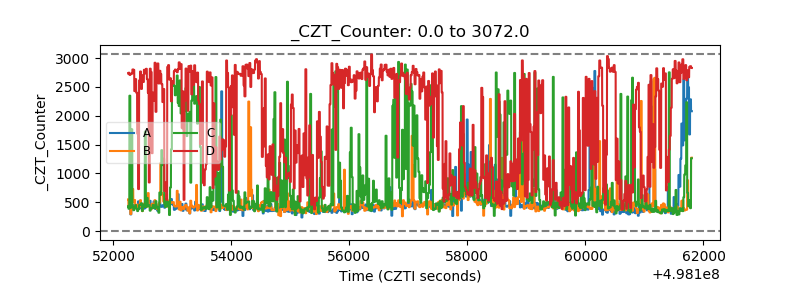 |
| +2.5 Volts monitor | 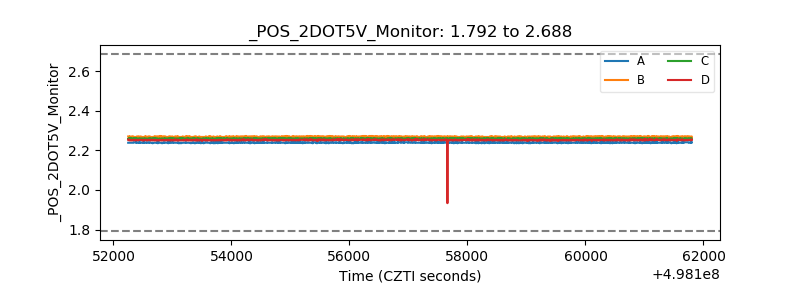 |
| +5 Volts monitor | 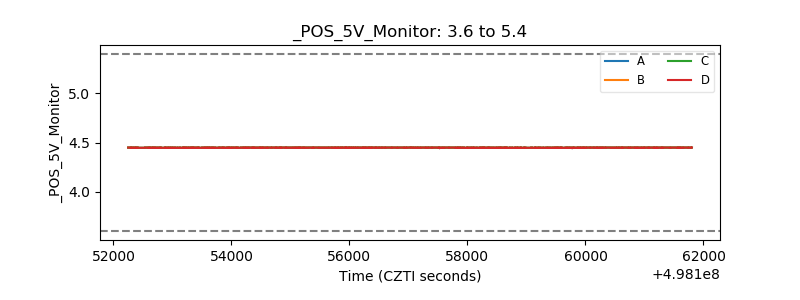 |
| _ROLL_ROT | 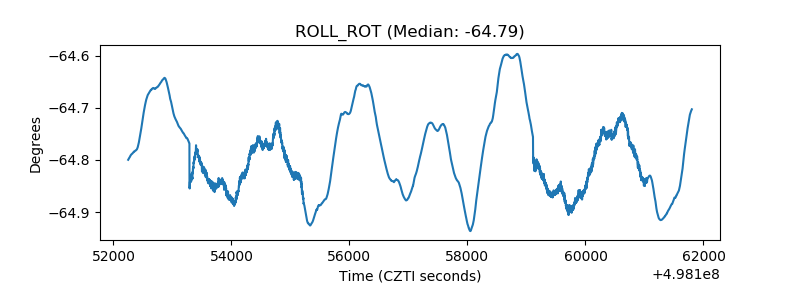 |
| _Roll_DEC | 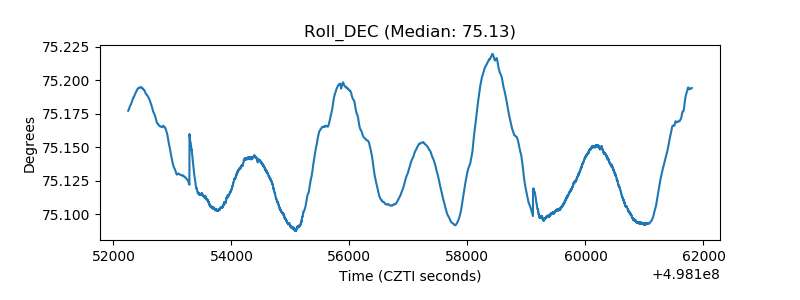 |
| _Roll_RA | 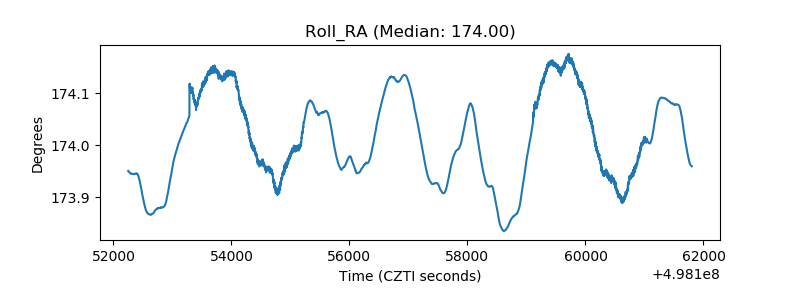 |
| Veto Counter | 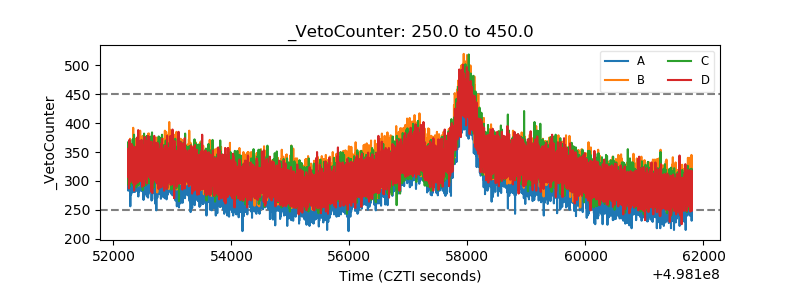 |