| Param | Original file | Final file |
|---|---|---|
| Filename | modeM0/AS1A14_126T15_9000006516_54352cztM0_level2.fits | modeM0/AS1A14_126T15_9000006516_54352cztM0_level2_quad_clean.evt |
| Size (bytes) | 584,671,680 | 93,487,680 |
| Size | 557.6 MB | 89.2 MB |
| Events in quadrant A | 3,092,486 | 664,206 |
| Events in quadrant B | 3,301,620 | 706,757 |
| Events in quadrant C | 3,188,414 | 637,521 |
| Events in quadrant D | 11,513,555 | 333,150 |
| Mode SS | |||
|---|---|---|---|
| Quadrant | BADHDUFLAG | Total packets | Discarded packets |
| A | 0 | 144 | 0 |
| B | 0 | 144 | 0 |
| C | 0 | 144 | 0 |
| D | 0 | 144 | 0 |
| Mode M0 | |||
|---|---|---|---|
| Quadrant | BADHDUFLAG | Total packets | Discarded packets |
| A | 0 | 14623 | 2 |
| B | 0 | 15037 | 3 |
| C | 0 | 14878 | 2 |
| D | 0 | 39054 | 2 |
| Mode M9 | |||
|---|---|---|---|
| Quadrant | BADHDUFLAG | Total packets | Discarded packets |
| A | 0 | 17 | 0 |
| B | 0 | 17 | 0 |
| C | 0 | 17 | 0 |
| D | 0 | 17 | 0 |
| Quadrant | Total seconds | Saturated seconds | Saturation percentage |
|---|---|---|---|
| A | 7022 | 31 | 0.441470% |
| B | 7021 | 67 | 0.954280% |
| C | 7022 | 41 | 0.583879% |
| D | 7022 | 3388 | 48.248362% |
Noise dominated data is calculated using 1-second bins in cleaned event files. If a bin has >2000 counts, and if more than 50% of those come from <1% of pixels, then it is considered to be noise-dominated and hence unusable.
| Quadrant | # 1 sec bins | Bins with >0 counts | Bins with >2000 counts | High rate bins dominated by noise | Noise dominated (total time) | Noise dominated (detector-on time) | Marked lightcurve |
|---|---|---|---|---|---|---|---|
| A | 8737 | 7024 | 3 | 3 | 0.03% | 0.04% | 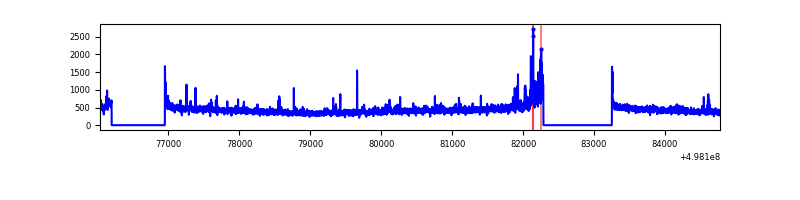 |
| B | 8736 | 7022 | 21 | 21 | 0.24% | 0.30% | 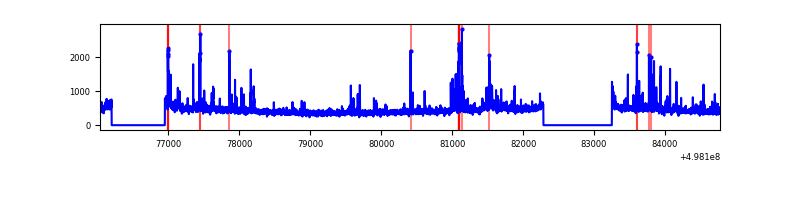 |
| C | 8737 | 7024 | 22 | 22 | 0.25% | 0.31% | 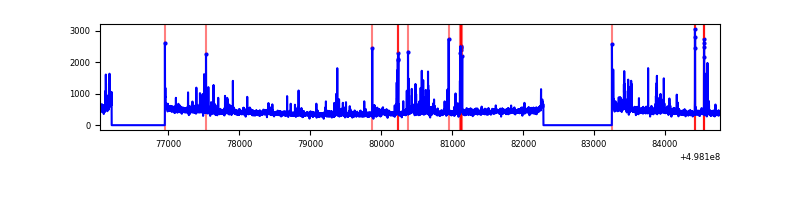 |
| D | 8736 | 7022 | 3251 | 3251 | 37.21% | 46.30% | 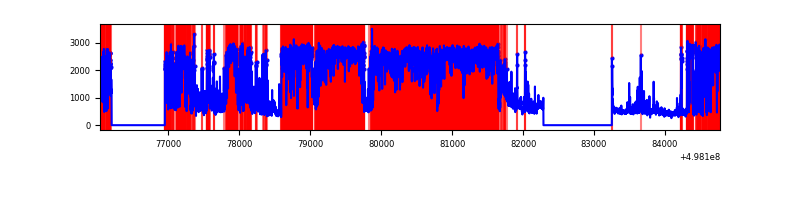 |
Top three noisy pixels from each quadrant. If the there are fewer than three noisy pixels in the level2.evt file, extra rows are filled as -1
| Pixel properties | Quadrant properties | ||||||
|---|---|---|---|---|---|---|---|
| Quadrant | DetID | PixID | Counts | Sigma | Mean | Median | Sigma |
| A | 7 | 206 | 150908 | 815.23 | 741 | 721 | 184.2 |
| A | 15 | 174 | 21610 | 113.39 | 741 | 721 | 184.2 |
| A | 0 | 8 | 16989 | 88.3 | 741 | 721 | 184.2 |
| B | 0 | 171 | 106313 | 666.91 | 734 | 704 | 158.4 |
| B | 9 | 251 | 75804 | 474.25 | 734 | 704 | 158.4 |
| B | 0 | 213 | 66127 | 413.14 | 734 | 704 | 158.4 |
| C | 14 | 254 | 153245 | 770.5 | 723 | 715 | 198.0 |
| C | 12 | 252 | 44744 | 222.41 | 723 | 715 | 198.0 |
| C | 5 | 144 | 39460 | 195.72 | 723 | 715 | 198.0 |
| D | 8 | 176 | 8161269 | 56934.2 | 503 | 480 | 143.3 |
| D | 15 | 108 | 833505 | 5811.65 | 503 | 480 | 143.3 |
| D | 12 | 3 | 225900 | 1572.66 | 503 | 480 | 143.3 |
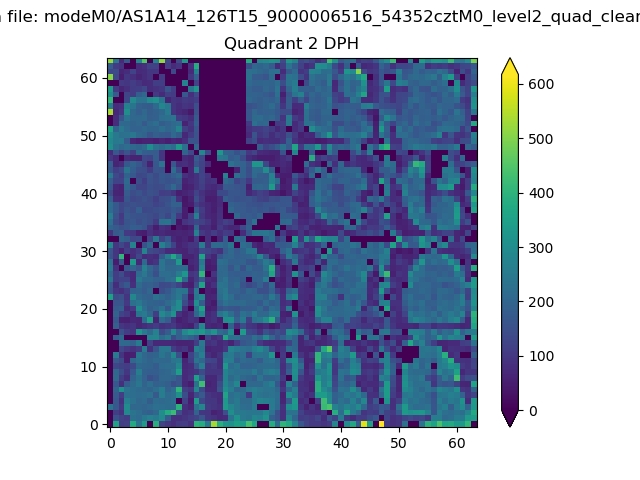
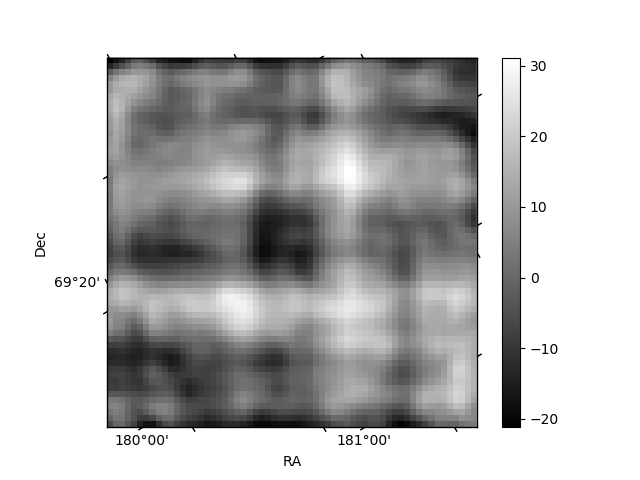
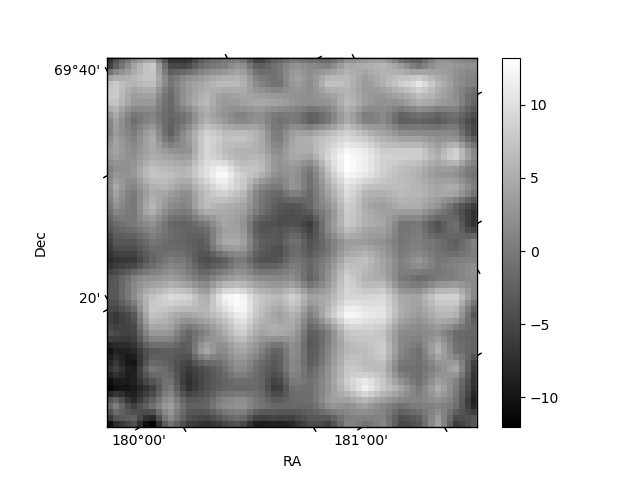
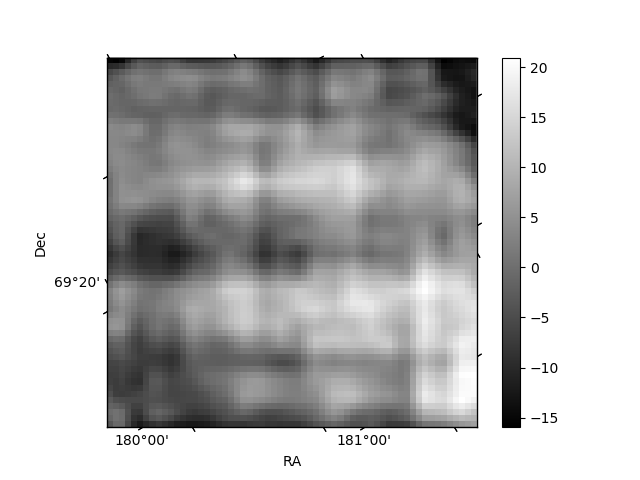
Histogram calculated using DETX and DETY for each event in the final _common_clean file
| Quadrant A | 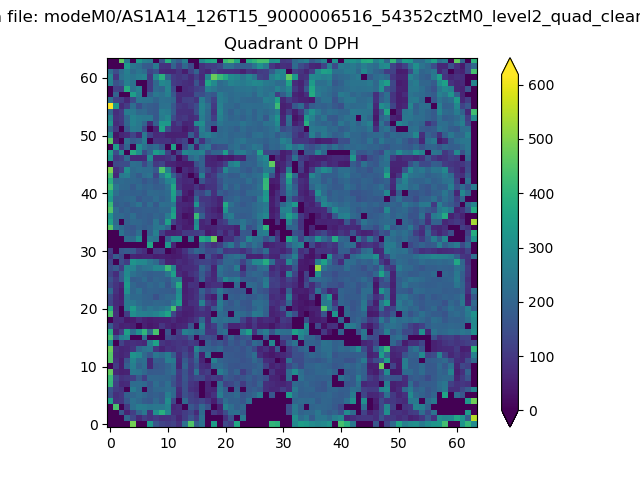 |
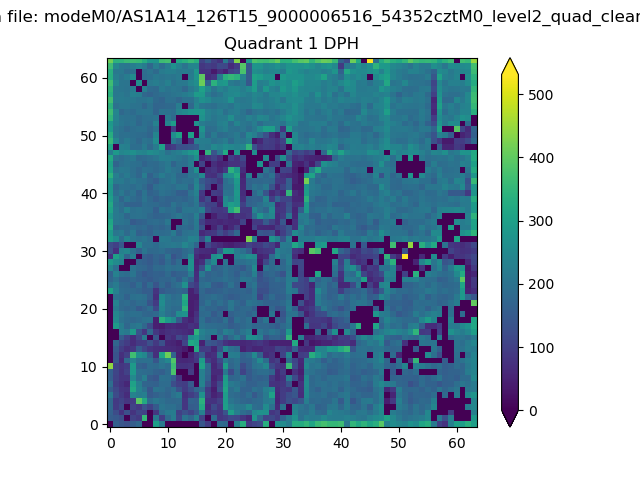 |
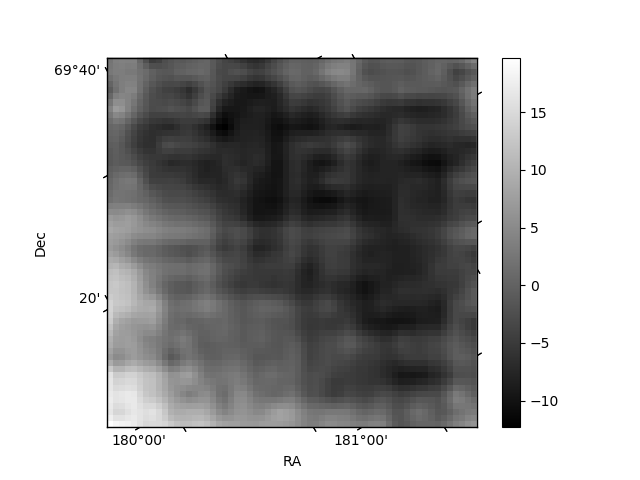
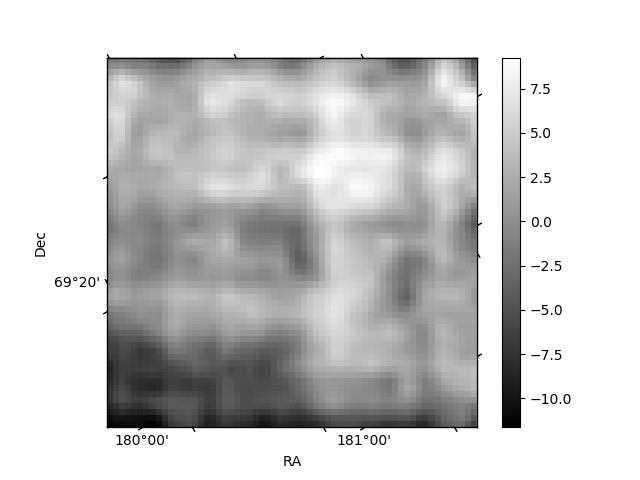
Quadrant B |
|---|---|---|---|
| Quadrant D | 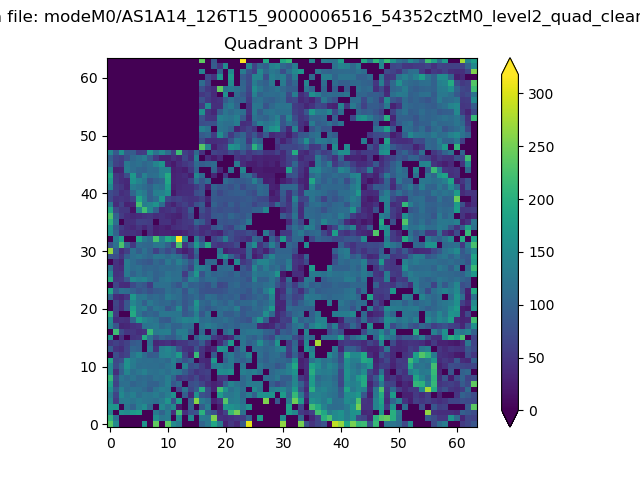 |
 |
Quadrant C |
| Plot type | Count rate plots | Images |
|---|---|---|
| Comparison with Poisson distribution Blue bars denote a histogram of data divided into 1 sec bins. Red curve is a Poisson curve with rate = median count rate of data. |
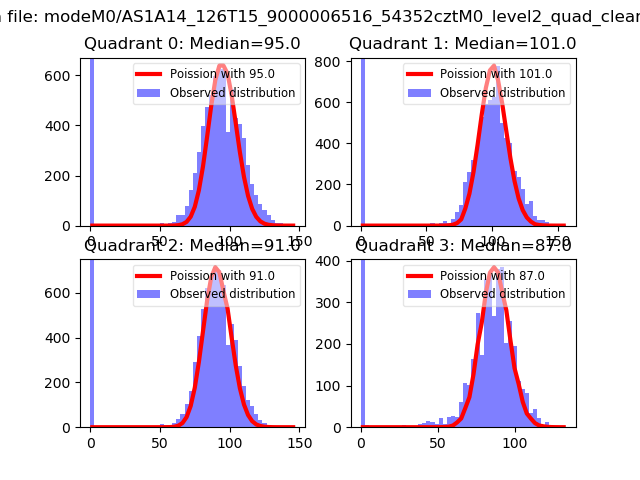 |
 |
| Quadrant-wise count rates Data is divided into 100 sec bins |
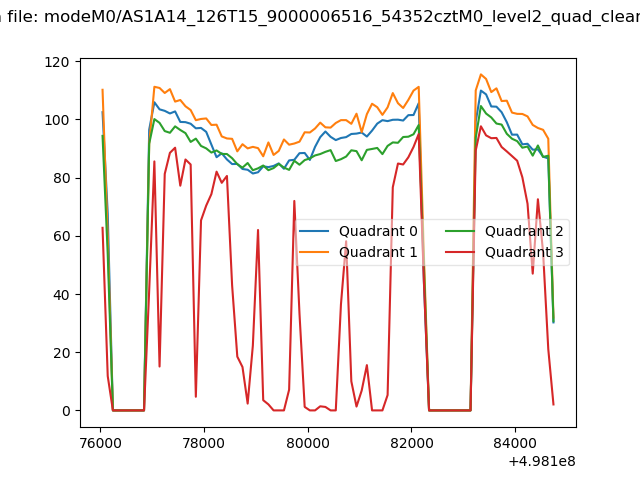 |
|
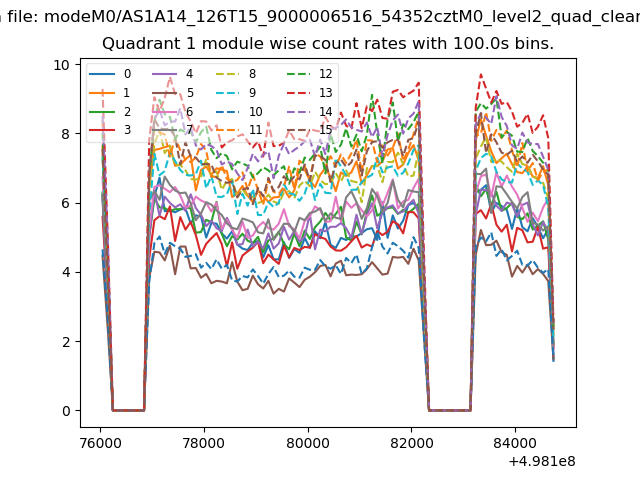
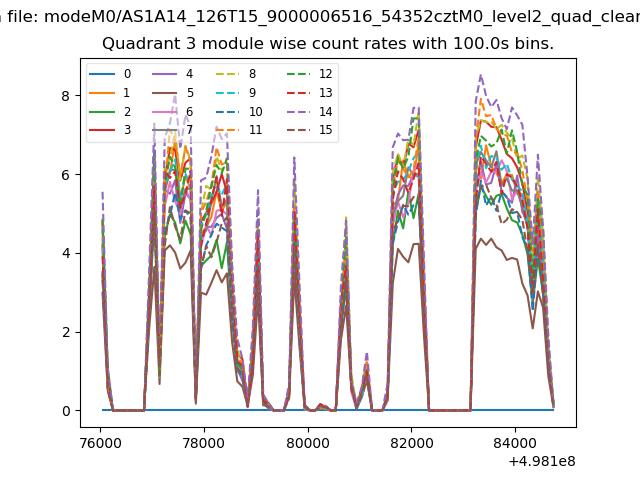
| Module-wise count rates for Quadrant A Data is divided into 100 sec bins |
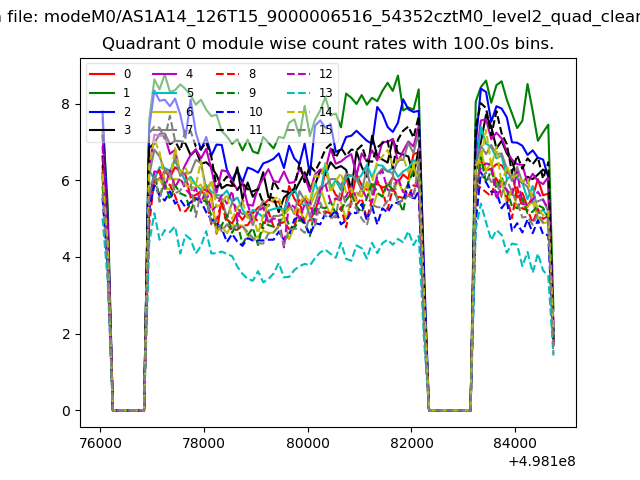 |
 |
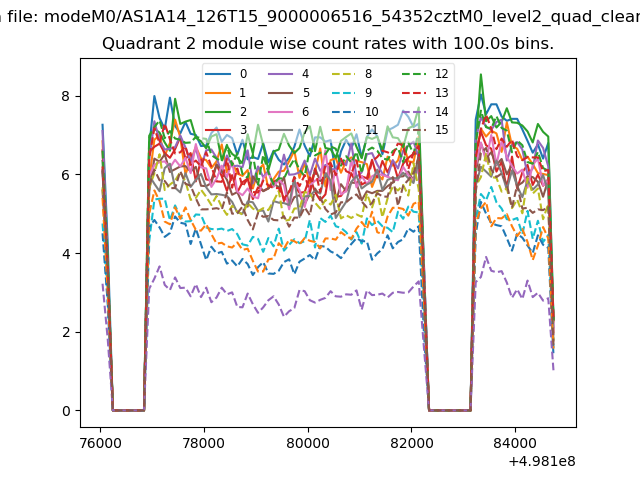
| Module-wise count rates for Quadrant B Data is divided into 100 sec bins |
 |
 |
| Module-wise count rates for Quadrant C Data is divided into 100 sec bins |
 |
 |
| Module-wise count rates for Quadrant D Data is divided into 100 sec bins |
 |
 |
| Parameter | Plot |
|---|---|
| CZT HV Monitor | 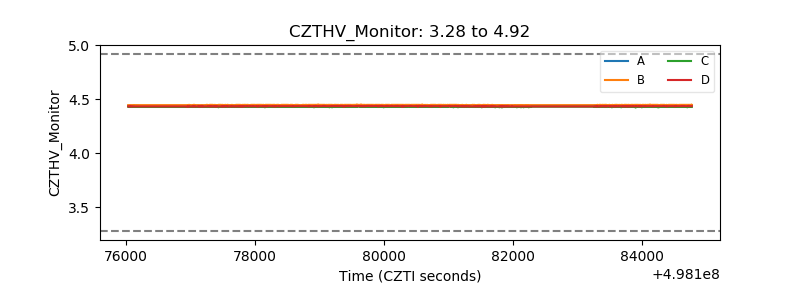 |
| D_VDD | 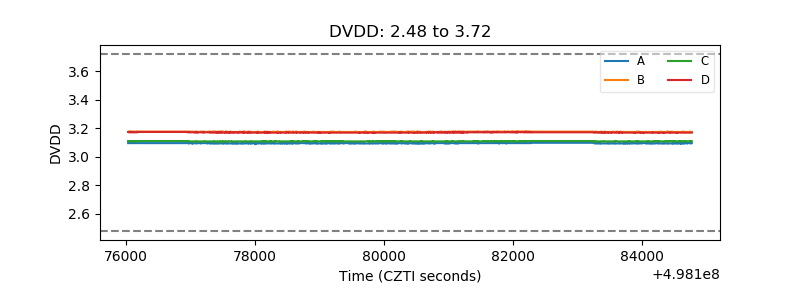 |
| Temperature 1 | 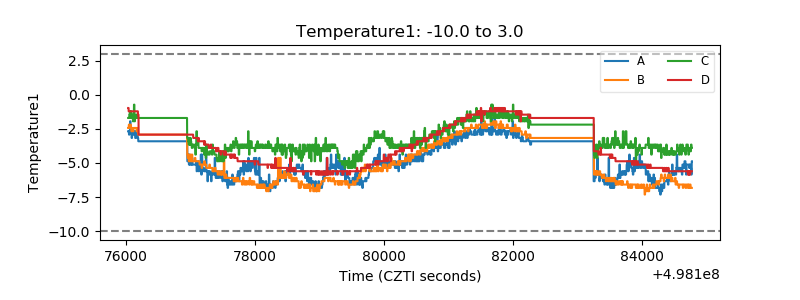 |
| Veto HV Monitor | 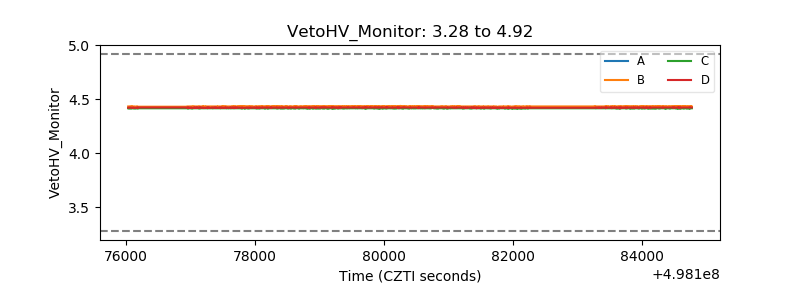 |
| Veto LLD | 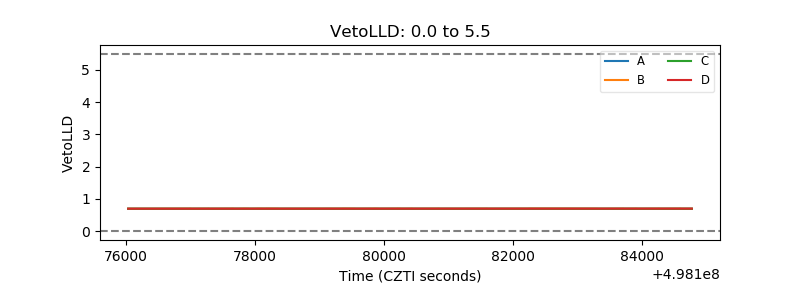 |
| Alpha Counter | 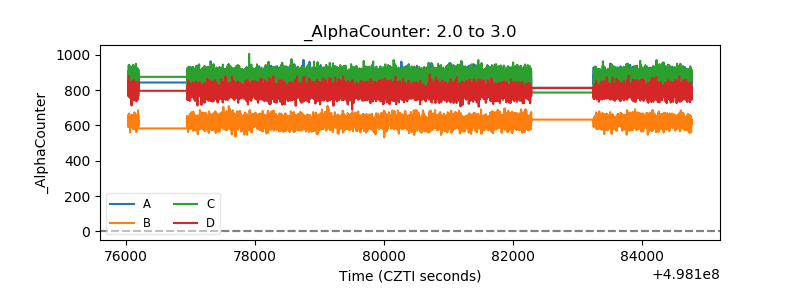 |
| _CPM_Rate | 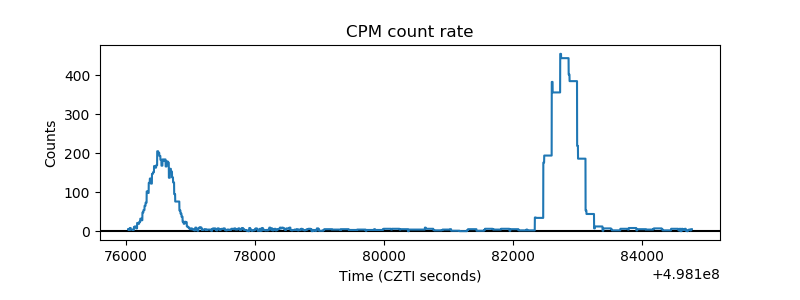 |
| CZT Counter | 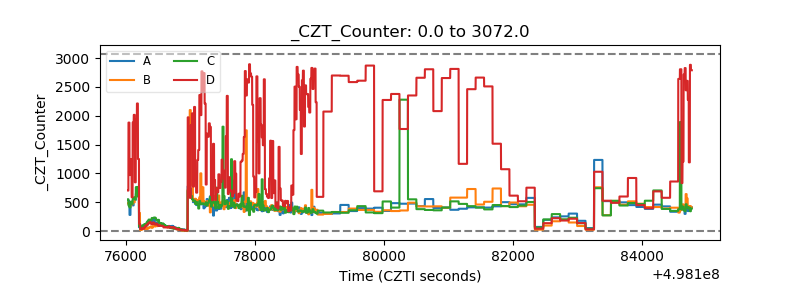 |
| +2.5 Volts monitor |  |
| +5 Volts monitor |  |
| _ROLL_ROT | 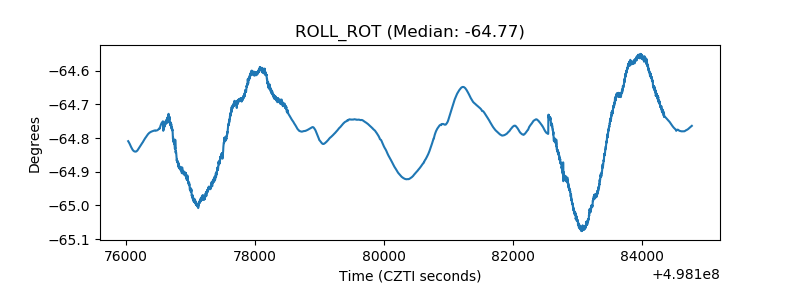 |
| _Roll_DEC | 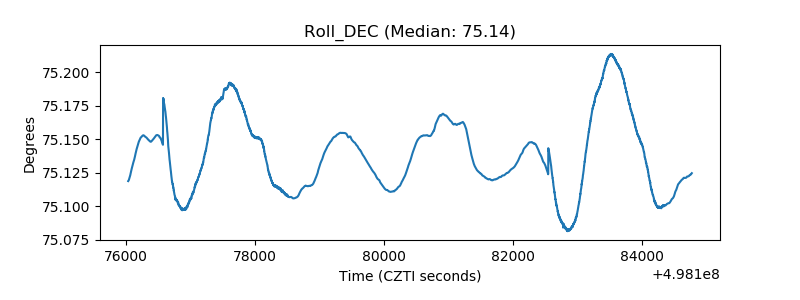 |
| _Roll_RA | 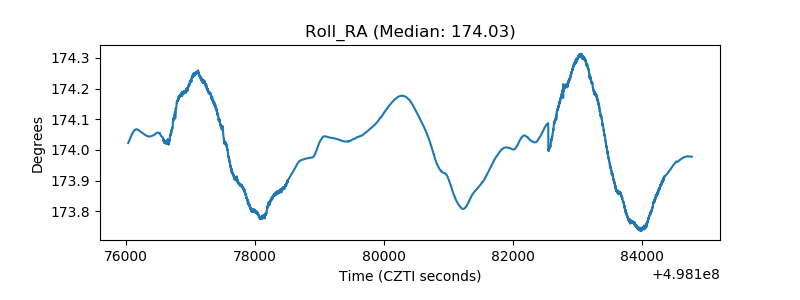 |
| Veto Counter | 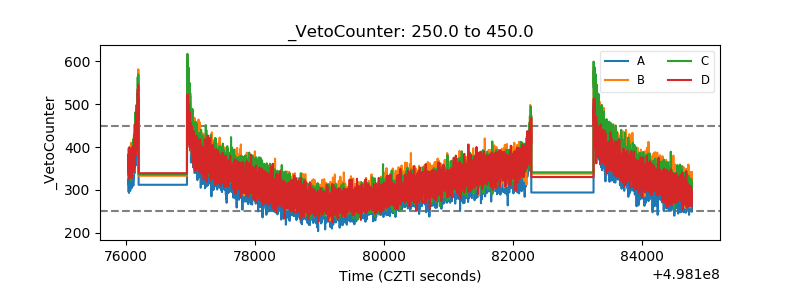 |