| Param | Original file | Final file |
|---|---|---|
| Filename | modeM0/AS1A14_126T15_9000006516_54354cztM0_level2.fits | modeM0/AS1A14_126T15_9000006516_54354cztM0_level2_quad_clean.evt |
| Size (bytes) | 502,876,800 | 101,479,680 |
| Size | 479.6 MB | 96.8 MB |
| Events in quadrant A | 3,295,893 | 682,923 |
| Events in quadrant B | 3,524,244 | 728,129 |
| Events in quadrant C | 4,075,574 | 639,545 |
| Events in quadrant D | 7,169,432 | 529,611 |
| Mode SS | |||
|---|---|---|---|
| Quadrant | BADHDUFLAG | Total packets | Discarded packets |
| A | 0 | 144 | 0 |
| B | 0 | 144 | 0 |
| C | 0 | 144 | 0 |
| D | 0 | 144 | 0 |
| Mode M0 | |||
|---|---|---|---|
| Quadrant | BADHDUFLAG | Total packets | Discarded packets |
| A | 0 | 15103 | 1 |
| B | 0 | 15584 | 1 |
| C | 0 | 17421 | 1 |
| D | 0 | 26272 | 1 |
| Mode M9 | |||
|---|---|---|---|
| Quadrant | BADHDUFLAG | Total packets | Discarded packets |
| A | 0 | 21 | 0 |
| B | 0 | 21 | 0 |
| C | 0 | 21 | 0 |
| D | 0 | 21 | 0 |
| Quadrant | Total seconds | Saturated seconds | Saturation percentage |
|---|---|---|---|
| A | 7075 | 31 | 0.438163% |
| B | 7075 | 71 | 1.003534% |
| C | 7076 | 201 | 2.840588% |
| D | 7076 | 1070 | 15.121538% |
Noise dominated data is calculated using 1-second bins in cleaned event files. If a bin has >2000 counts, and if more than 50% of those come from <1% of pixels, then it is considered to be noise-dominated and hence unusable.
| Quadrant | # 1 sec bins | Bins with >0 counts | Bins with >2000 counts | High rate bins dominated by noise | Noise dominated (total time) | Noise dominated (detector-on time) | Marked lightcurve |
|---|---|---|---|---|---|---|---|
| A | 9105 | 7076 | 4 | 4 | 0.04% | 0.06% | 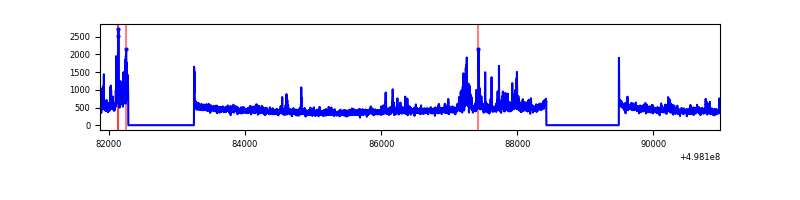 |
| B | 9105 | 7076 | 34 | 34 | 0.37% | 0.48% | 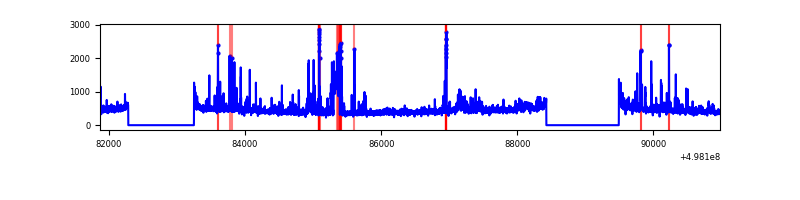 |
| C | 9106 | 7078 | 186 | 186 | 2.04% | 2.63% | 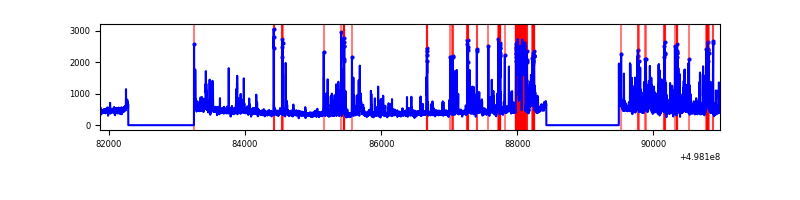 |
| D | 9106 | 7078 | 1093 | 1093 | 12.00% | 15.44% | 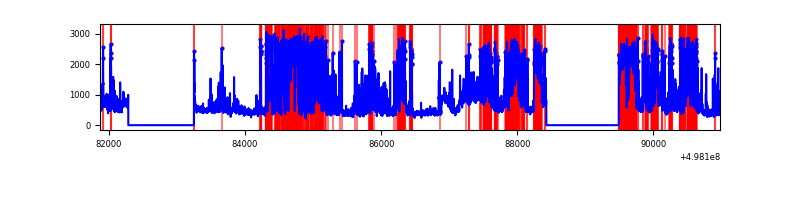 |
Top three noisy pixels from each quadrant. If the there are fewer than three noisy pixels in the level2.evt file, extra rows are filled as -1
| Pixel properties | Quadrant properties | ||||||
|---|---|---|---|---|---|---|---|
| Quadrant | DetID | PixID | Counts | Sigma | Mean | Median | Sigma |
| A | 7 | 206 | 312299 | 1673.76 | 749 | 731 | 186.1 |
| A | 15 | 174 | 24070 | 125.38 | 749 | 731 | 186.1 |
| A | 4 | 3 | 18645 | 96.24 | 749 | 731 | 186.1 |
| B | 0 | 213 | 253444 | 1590.6 | 743 | 715 | 158.9 |
| B | 0 | 171 | 100225 | 626.29 | 743 | 715 | 158.9 |
| B | 10 | 245 | 71467 | 445.29 | 743 | 715 | 158.9 |
| C | 1 | 241 | 333478 | 1669.26 | 724 | 716 | 199.3 |
| C | 12 | 252 | 313460 | 1568.84 | 724 | 716 | 199.3 |
| C | 13 | 3 | 213687 | 1068.34 | 724 | 716 | 199.3 |
| D | 8 | 176 | 3482709 | 17989.45 | 674 | 644 | 193.6 |
| D | 2 | 252 | 224214 | 1155.03 | 674 | 644 | 193.6 |
| D | 5 | 113 | 217646 | 1121.1 | 674 | 644 | 193.6 |
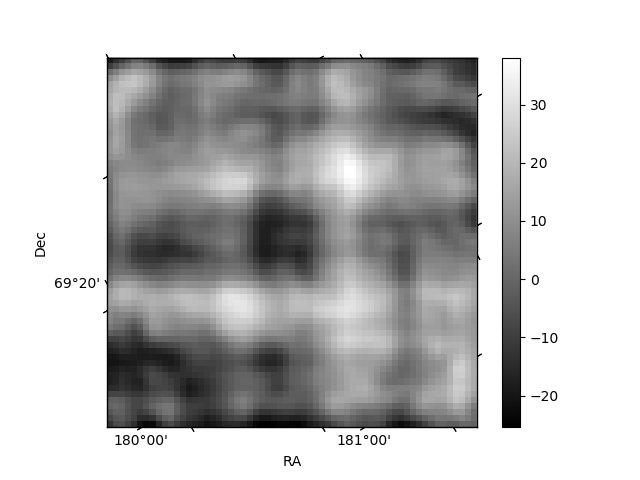
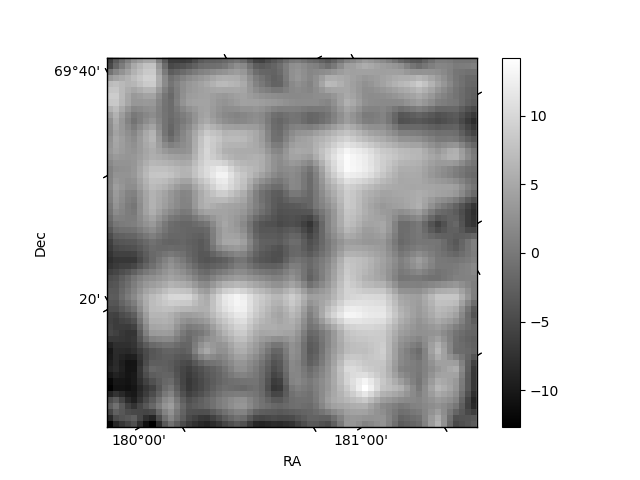
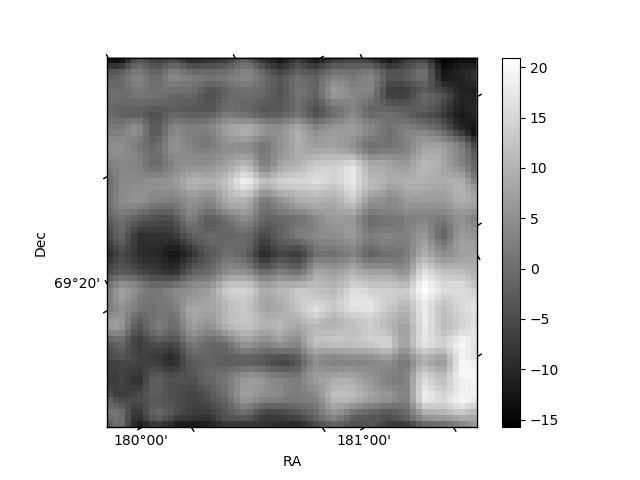
Histogram calculated using DETX and DETY for each event in the final _common_clean file
| Quadrant A | 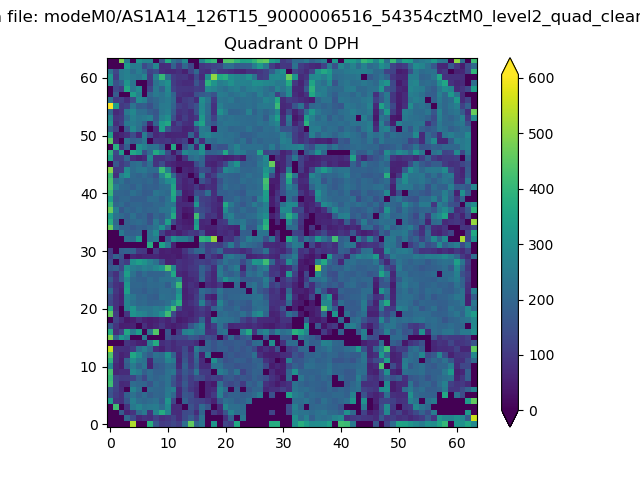 |
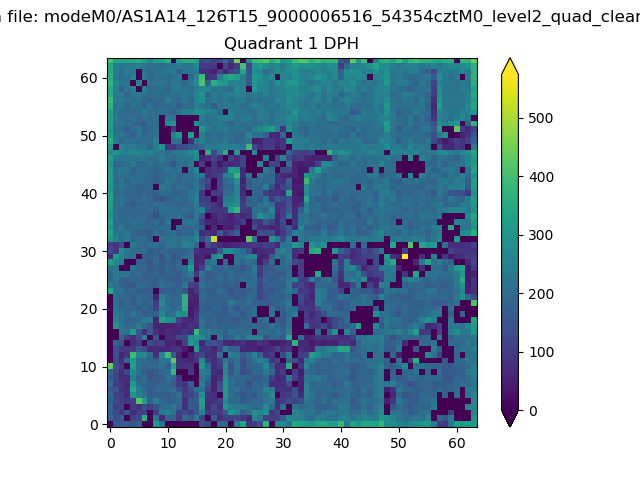 |
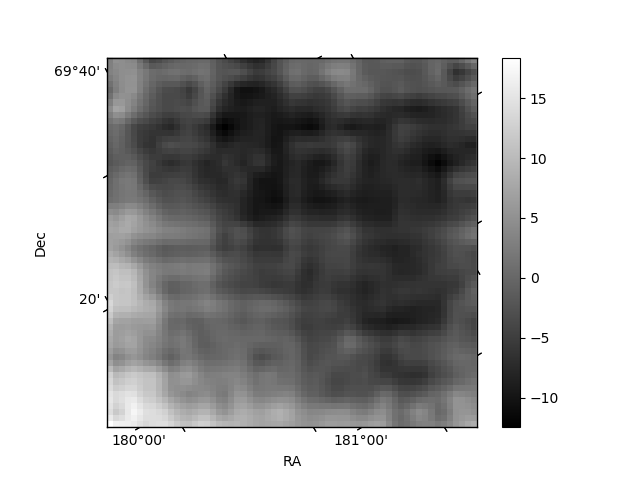
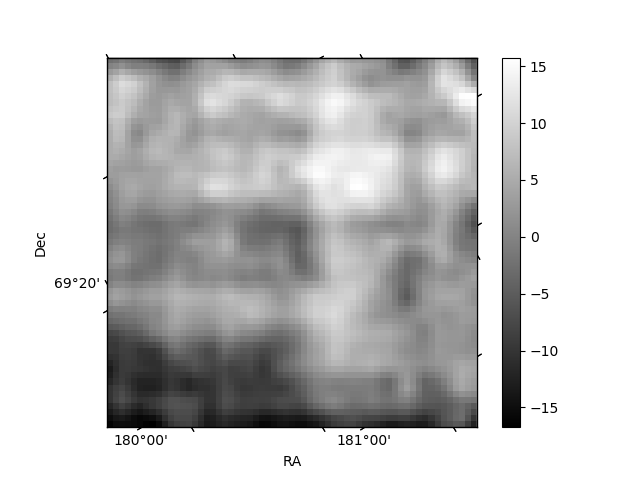
Quadrant B |
|---|---|---|---|
| Quadrant D | 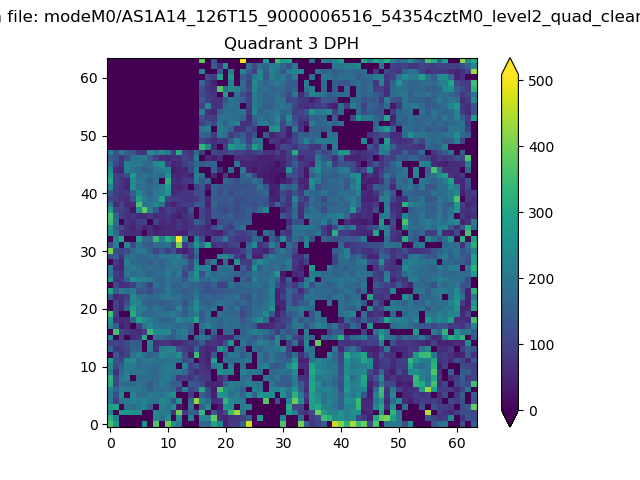 |
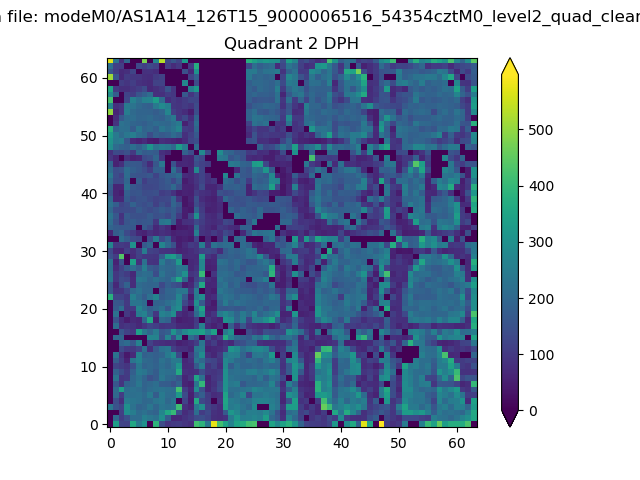 |
Quadrant C |
| Plot type | Count rate plots | Images |
|---|---|---|
| Comparison with Poisson distribution Blue bars denote a histogram of data divided into 1 sec bins. Red curve is a Poisson curve with rate = median count rate of data. |
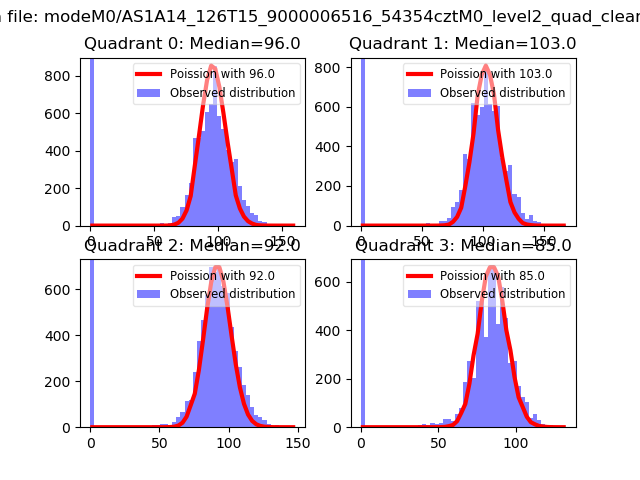 |
 |
| Quadrant-wise count rates Data is divided into 100 sec bins |
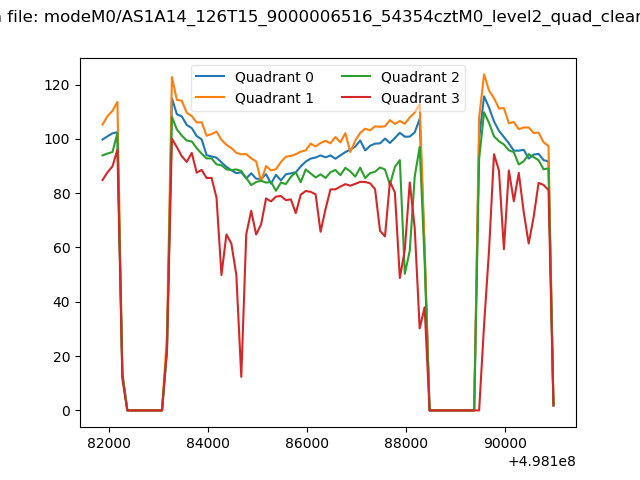 |
|
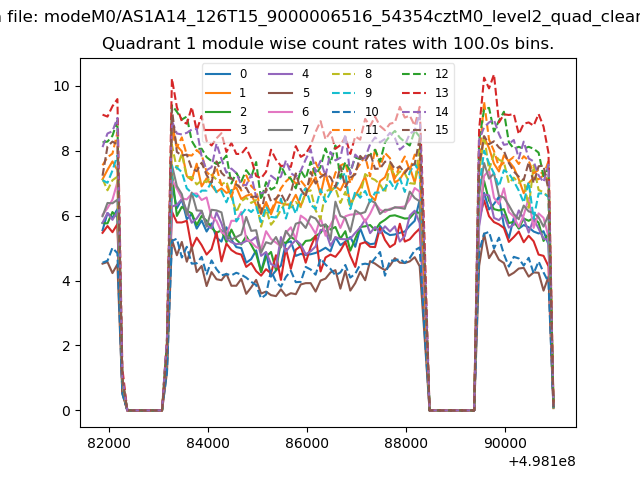
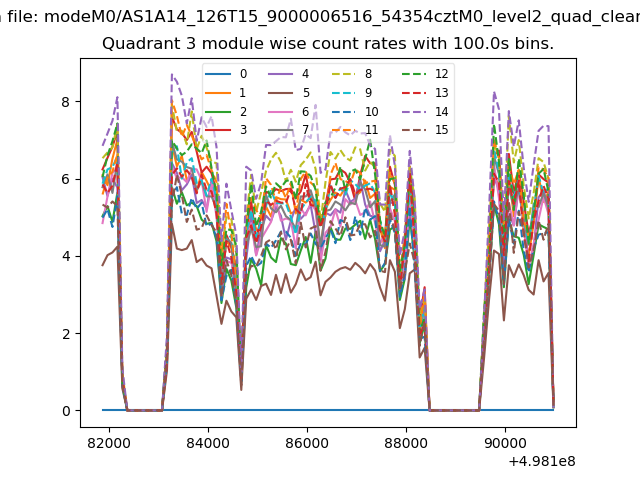
| Module-wise count rates for Quadrant A Data is divided into 100 sec bins |
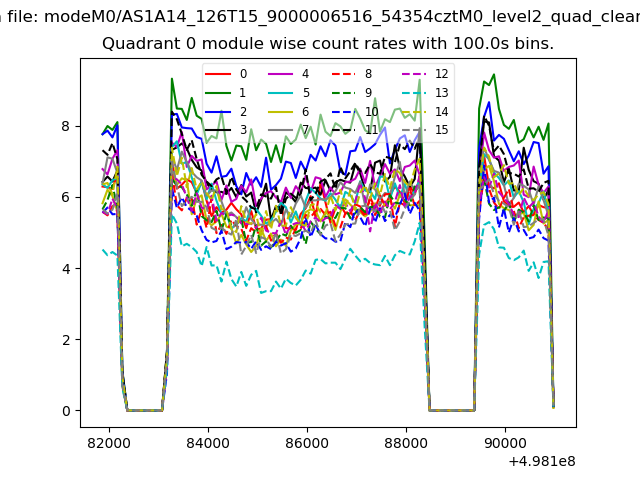 |
 |
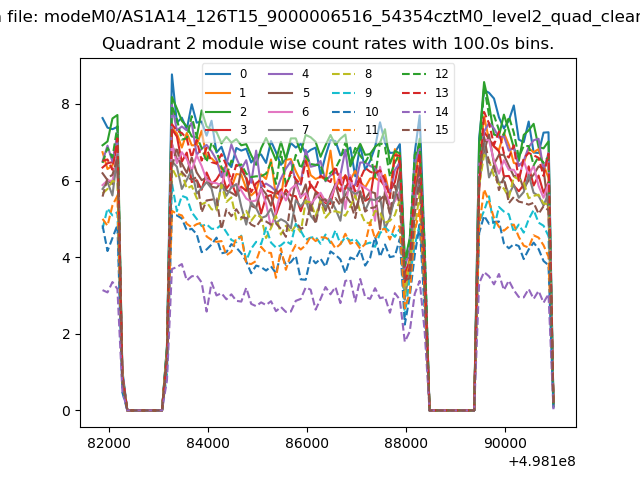
| Module-wise count rates for Quadrant B Data is divided into 100 sec bins |
 |
 |
| Module-wise count rates for Quadrant C Data is divided into 100 sec bins |
 |
 |
| Module-wise count rates for Quadrant D Data is divided into 100 sec bins |
 |
 |
| Parameter | Plot |
|---|---|
| CZT HV Monitor | 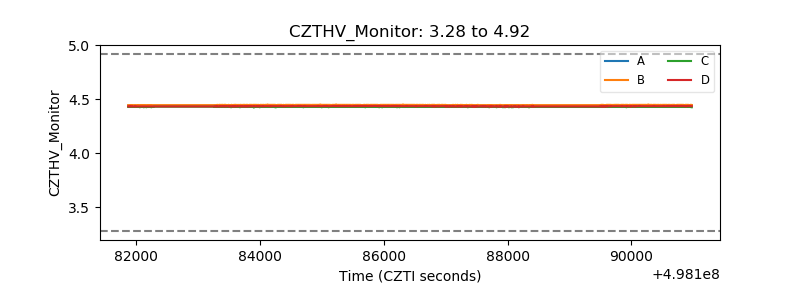 |
| D_VDD | 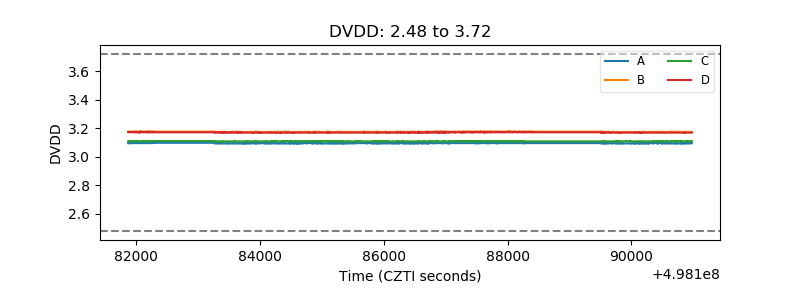 |
| Temperature 1 | 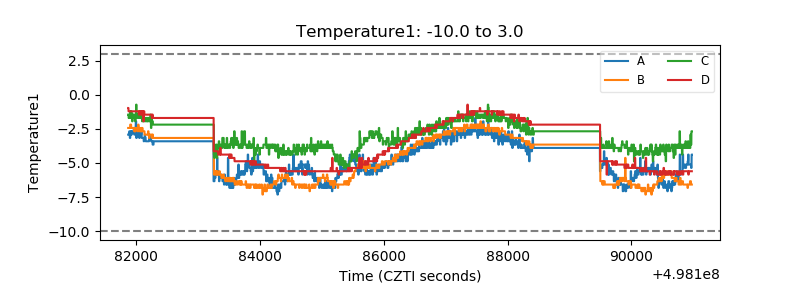 |
| Veto HV Monitor | 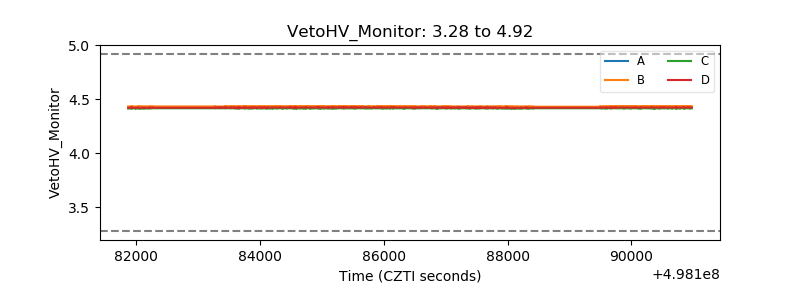 |
| Veto LLD | 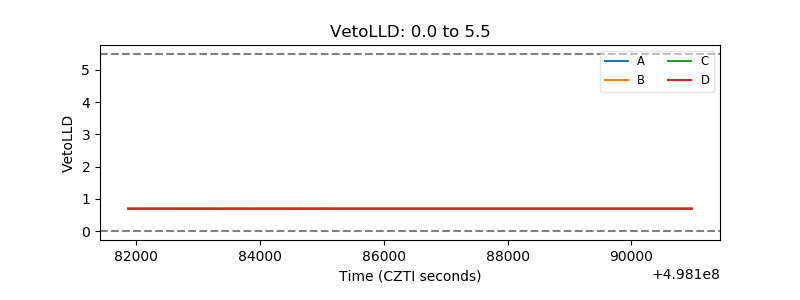 |
| Alpha Counter | 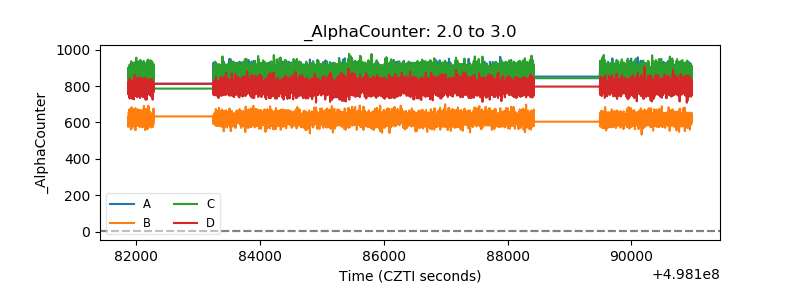 |
| _CPM_Rate | 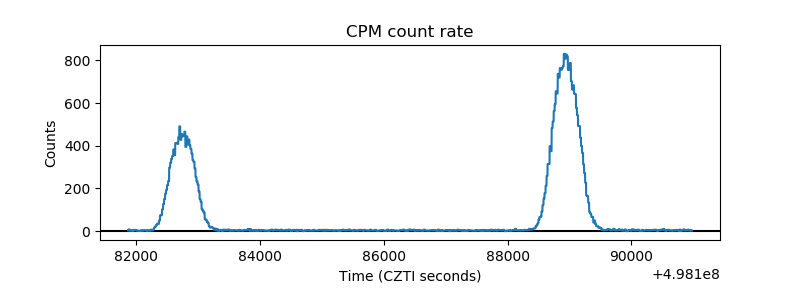 |
| CZT Counter | 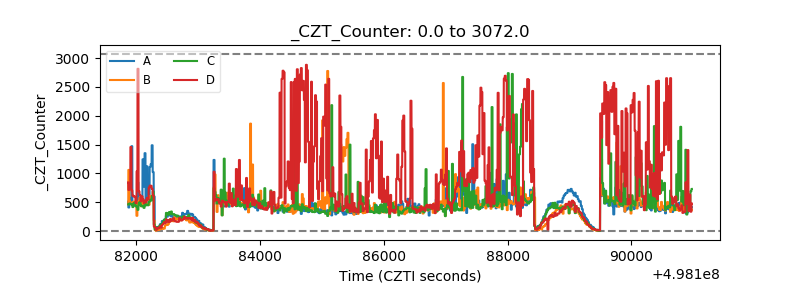 |
| +2.5 Volts monitor | 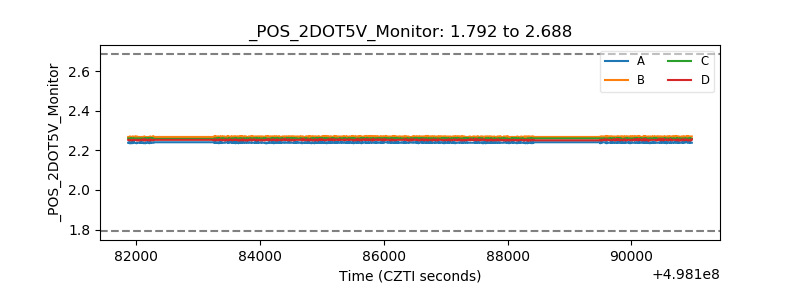 |
| +5 Volts monitor | 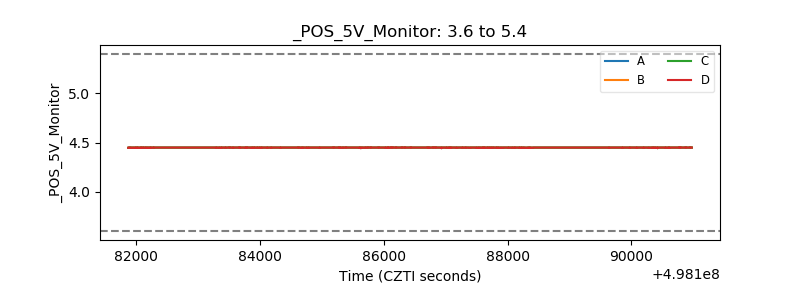 |
| _ROLL_ROT | 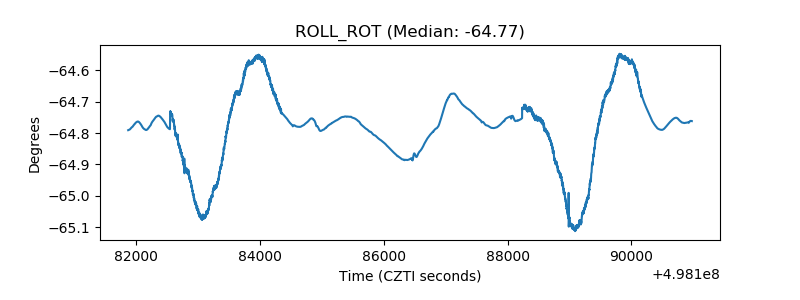 |
| _Roll_DEC | 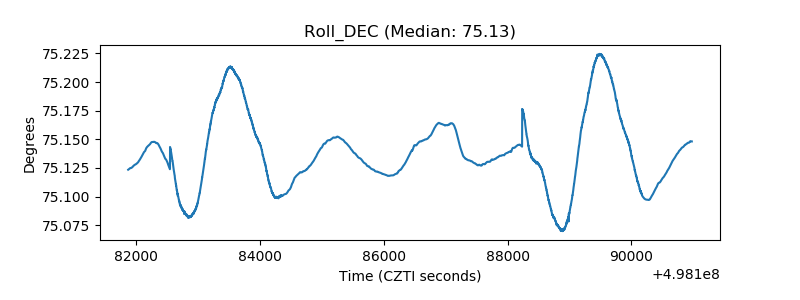 |
| _Roll_RA | 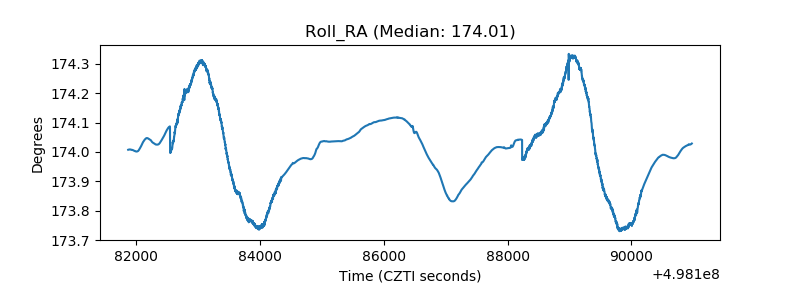 |
| Veto Counter | 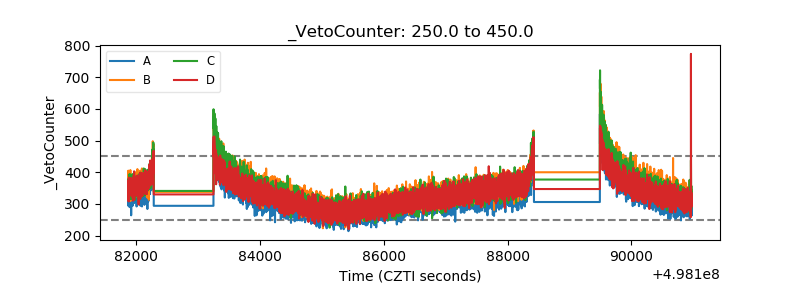 |