| Param | Original file | Final file |
|---|---|---|
| Filename | modeM0/AS1A14_126T15_9000006516_54355cztM0_level2.fits | modeM0/AS1A14_126T15_9000006516_54355cztM0_level2_quad_clean.evt |
| Size (bytes) | 576,984,960 | 82,215,360 |
| Size | 550.3 MB | 78.4 MB |
| Events in quadrant A | 2,859,150 | 609,342 |
| Events in quadrant B | 2,980,128 | 652,552 |
| Events in quadrant C | 3,402,063 | 572,920 |
| Events in quadrant D | 11,629,807 | 218,677 |
| Mode SS | |||
|---|---|---|---|
| Quadrant | BADHDUFLAG | Total packets | Discarded packets |
| A | 0 | 124 | 0 |
| B | 0 | 126 | 0 |
| C | 0 | 126 | 0 |
| D | 0 | 126 | 0 |
| Mode M0 | |||
|---|---|---|---|
| Quadrant | BADHDUFLAG | Total packets | Discarded packets |
| A | 0 | 13248 | 1 |
| B | 0 | 13406 | 1 |
| C | 0 | 14787 | 1 |
| D | 0 | 38879 | 1 |
| Mode M9 | |||
|---|---|---|---|
| Quadrant | BADHDUFLAG | Total packets | Discarded packets |
| A | 0 | 12 | 0 |
| B | 0 | 12 | 0 |
| C | 0 | 12 | 0 |
| D | 0 | 12 | 0 |
| Quadrant | Total seconds | Saturated seconds | Saturation percentage |
|---|---|---|---|
| A | 6251 | 27 | 0.431931% |
| B | 6251 | 60 | 0.959846% |
| C | 6252 | 123 | 1.967370% |
| D | 6252 | 3891 | 62.236084% |
Noise dominated data is calculated using 1-second bins in cleaned event files. If a bin has >2000 counts, and if more than 50% of those come from <1% of pixels, then it is considered to be noise-dominated and hence unusable.
| Quadrant | # 1 sec bins | Bins with >0 counts | Bins with >2000 counts | High rate bins dominated by noise | Noise dominated (total time) | Noise dominated (detector-on time) | Marked lightcurve |
|---|---|---|---|---|---|---|---|
| A | 7395 | 6251 | 13 | 13 | 0.18% | 0.21% | 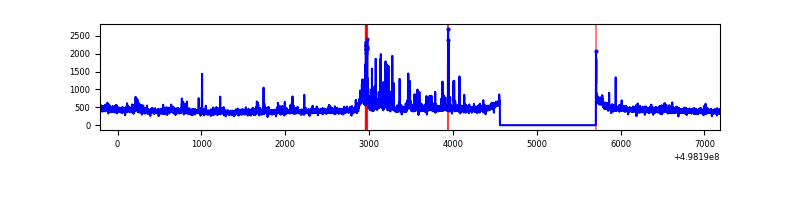 |
| B | 7396 | 6252 | 31 | 31 | 0.42% | 0.50% | 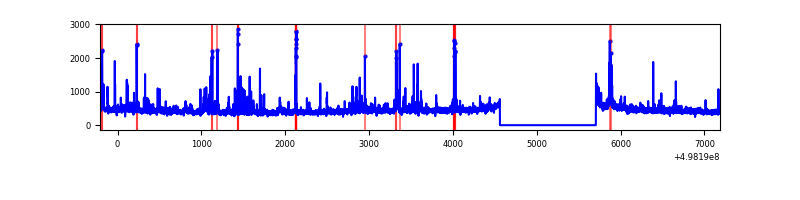 |
| C | 7397 | 6253 | 141 | 141 | 1.91% | 2.25% | 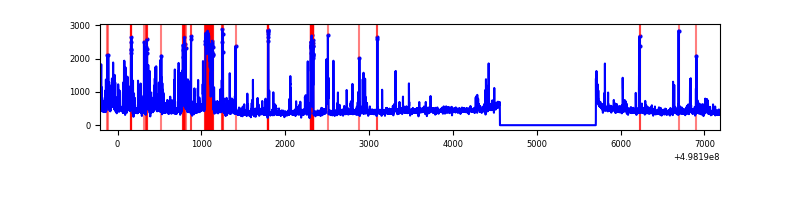 |
| D | 7396 | 6251 | 3589 | 3589 | 48.53% | 57.41% | 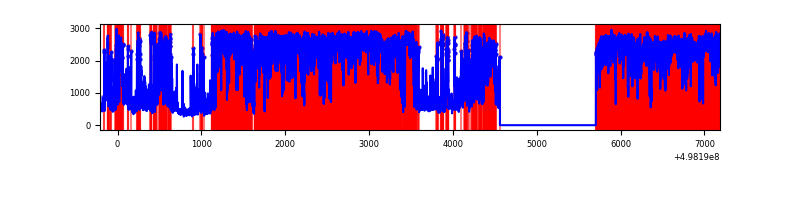 |
Top three noisy pixels from each quadrant. If the there are fewer than three noisy pixels in the level2.evt file, extra rows are filled as -1
| Pixel properties | Quadrant properties | ||||||
|---|---|---|---|---|---|---|---|
| Quadrant | DetID | PixID | Counts | Sigma | Mean | Median | Sigma |
| A | 3 | 110 | 139763 | 864.38 | 653 | 640 | 161.0 |
| A | 7 | 206 | 111275 | 687.38 | 653 | 640 | 161.0 |
| A | 4 | 3 | 17196 | 102.86 | 653 | 640 | 161.0 |
| B | 0 | 213 | 107822 | 770.08 | 650 | 628 | 139.2 |
| B | 10 | 247 | 85998 | 613.29 | 650 | 628 | 139.2 |
| B | 0 | 171 | 73044 | 520.23 | 650 | 628 | 139.2 |
| C | 12 | 252 | 421800 | 2436.07 | 628 | 620 | 172.9 |
| C | 15 | 147 | 169498 | 976.78 | 628 | 620 | 172.9 |
| C | 14 | 254 | 155982 | 898.6 | 628 | 620 | 172.9 |
| D | 8 | 176 | 9425746 | 91207.12 | 359 | 341 | 103.3 |
| D | 12 | 3 | 315823 | 3052.83 | 359 | 341 | 103.3 |
| D | 15 | 108 | 211928 | 2047.47 | 359 | 341 | 103.3 |
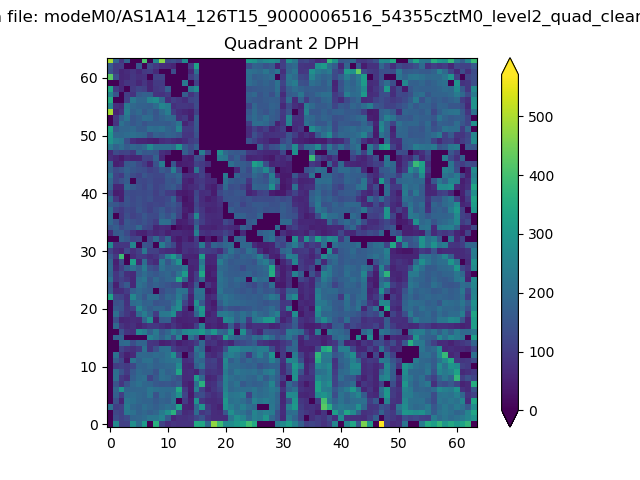
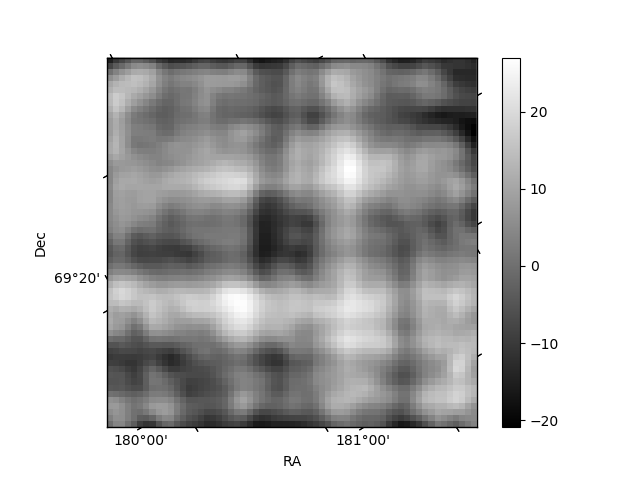
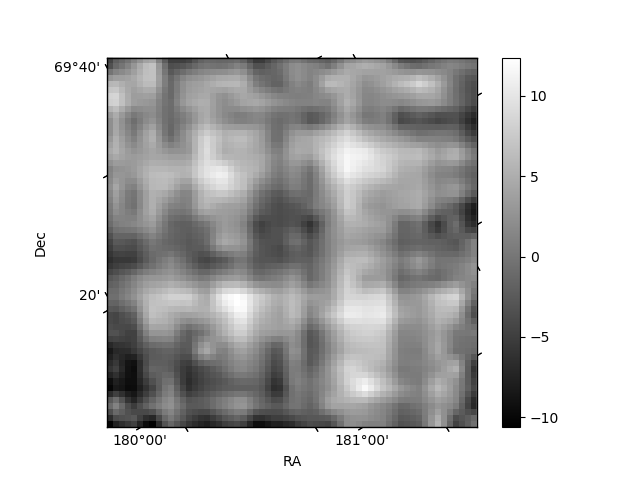
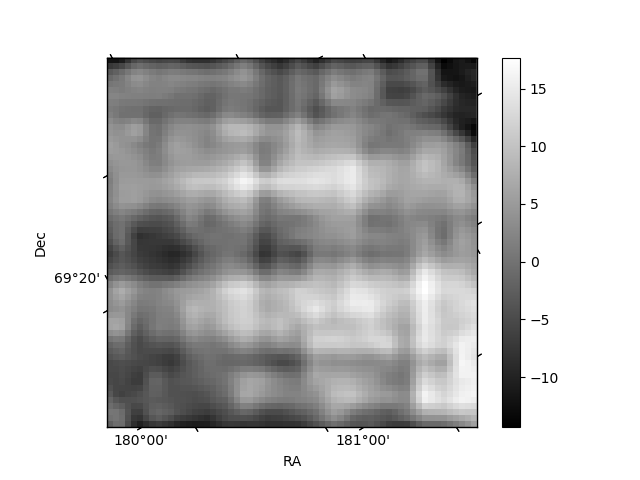
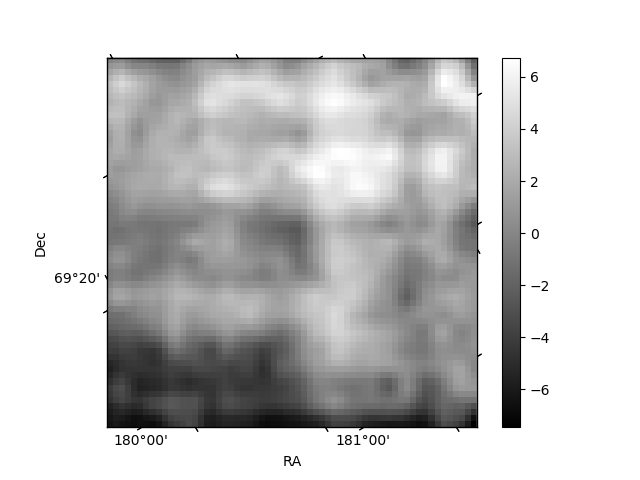
Histogram calculated using DETX and DETY for each event in the final _common_clean file
| Quadrant A | 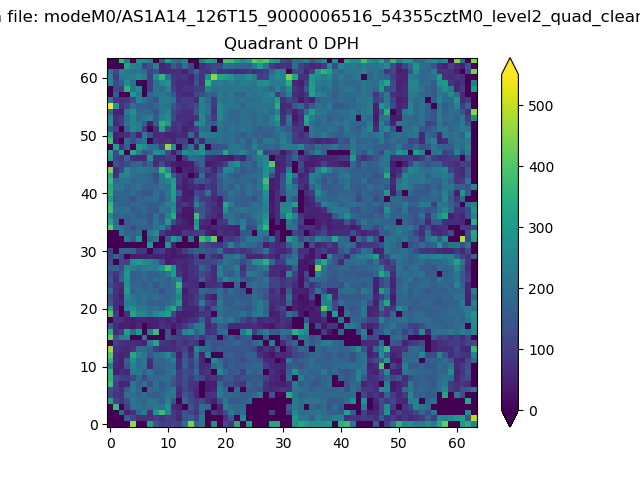 |
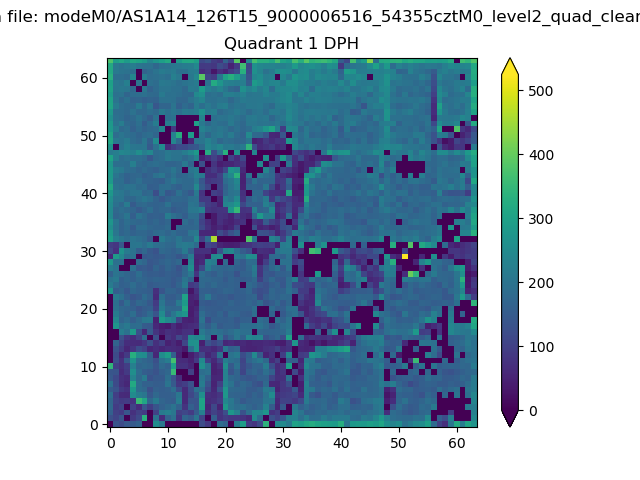 |
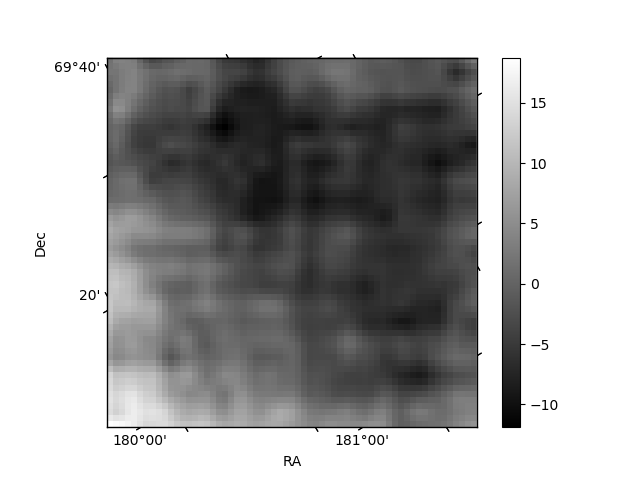
Quadrant B |
|---|---|---|---|
| Quadrant D | 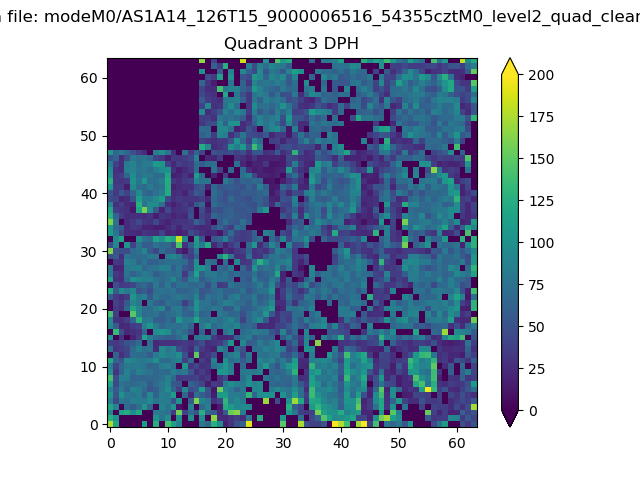 |
 |
Quadrant C |
| Plot type | Count rate plots | Images |
|---|---|---|
| Comparison with Poisson distribution Blue bars denote a histogram of data divided into 1 sec bins. Red curve is a Poisson curve with rate = median count rate of data. |
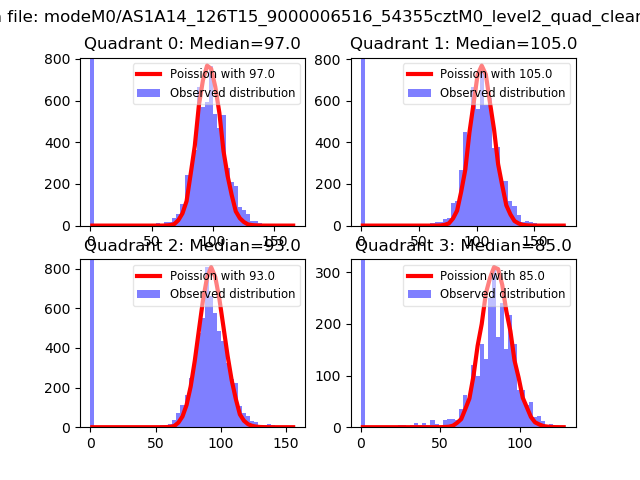 |
 |
| Quadrant-wise count rates Data is divided into 100 sec bins |
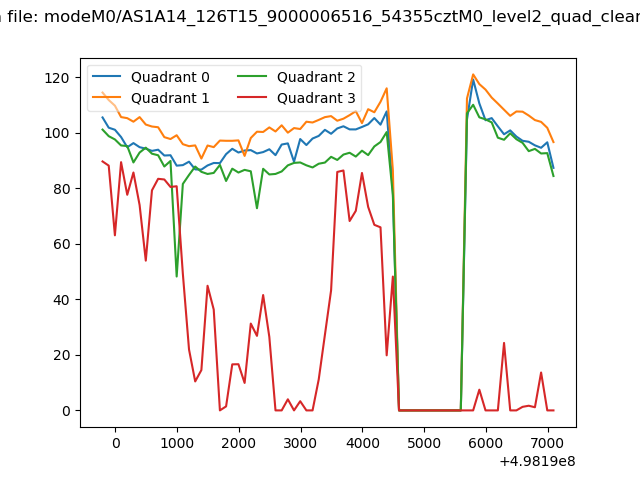 |
|
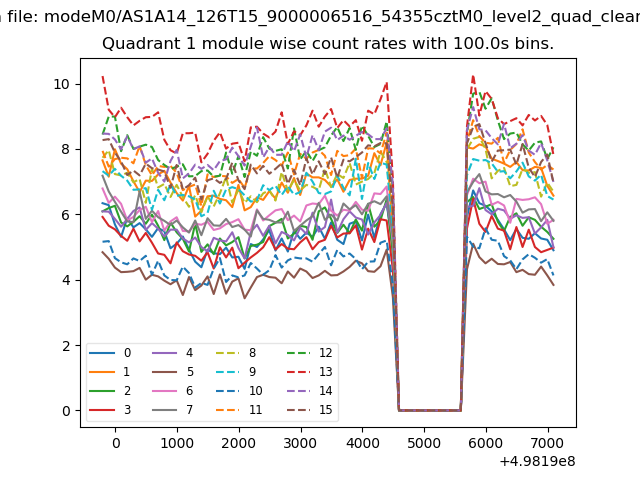
| Module-wise count rates for Quadrant A Data is divided into 100 sec bins |
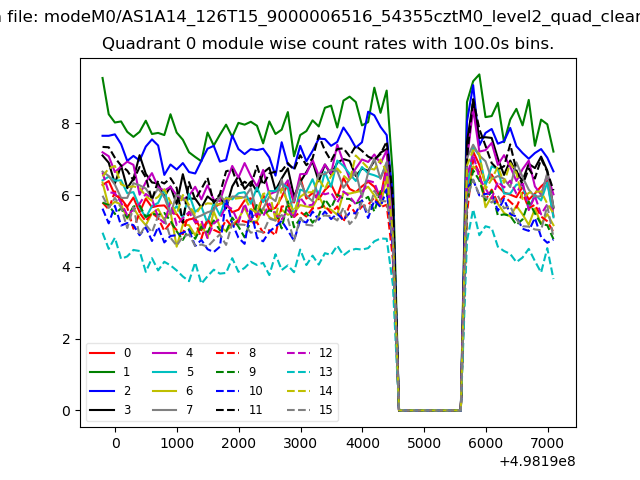 |
 |
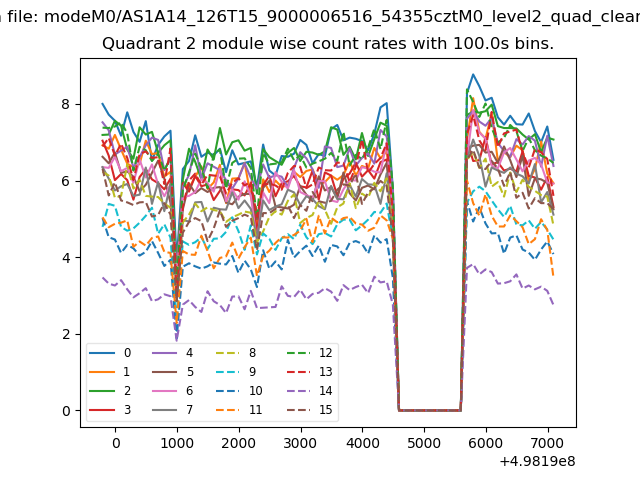
| Module-wise count rates for Quadrant B Data is divided into 100 sec bins |
 |
 |
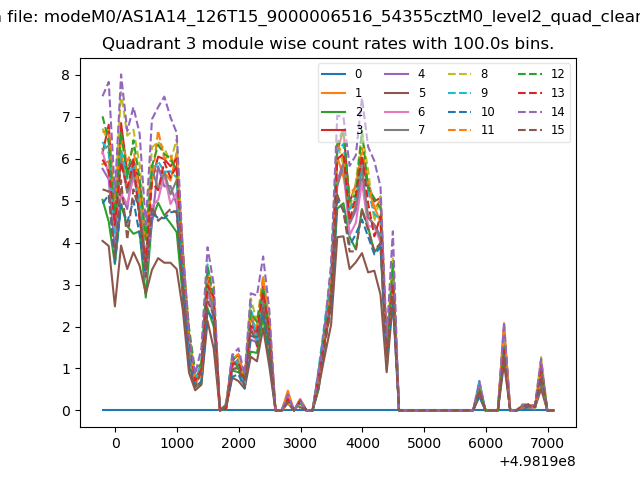
| Module-wise count rates for Quadrant C Data is divided into 100 sec bins |
 |
 |
| Module-wise count rates for Quadrant D Data is divided into 100 sec bins |
 |
 |
| Parameter | Plot |
|---|---|
| CZT HV Monitor | 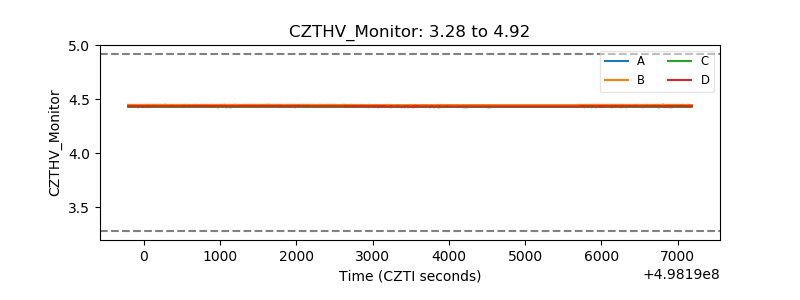 |
| D_VDD | 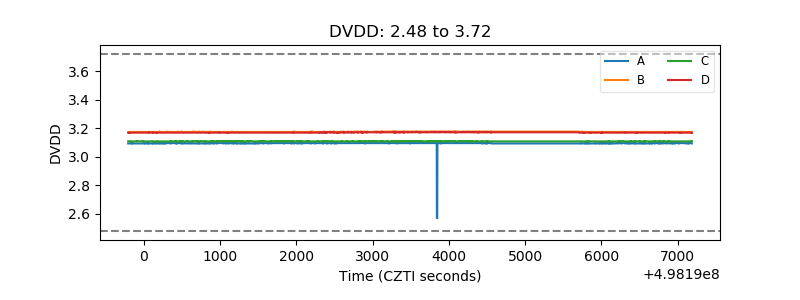 |
| Temperature 1 | 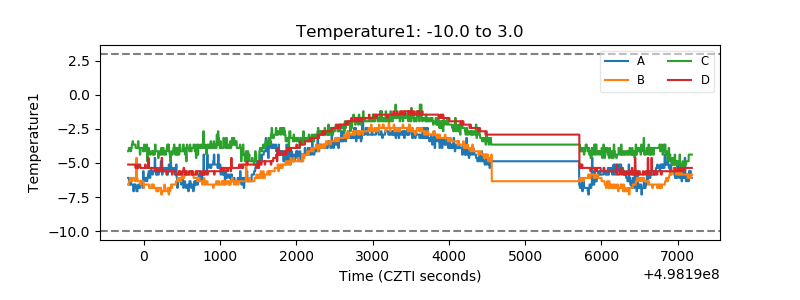 |
| Veto HV Monitor | 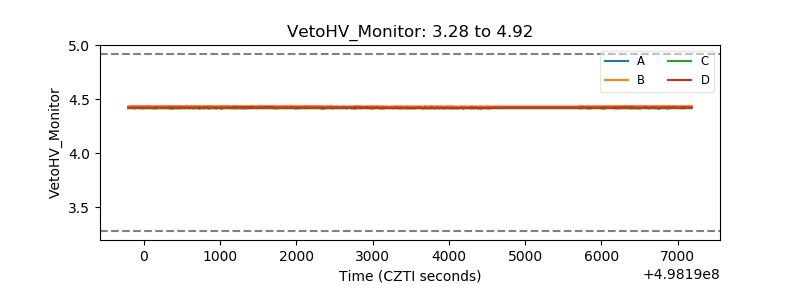 |
| Veto LLD | 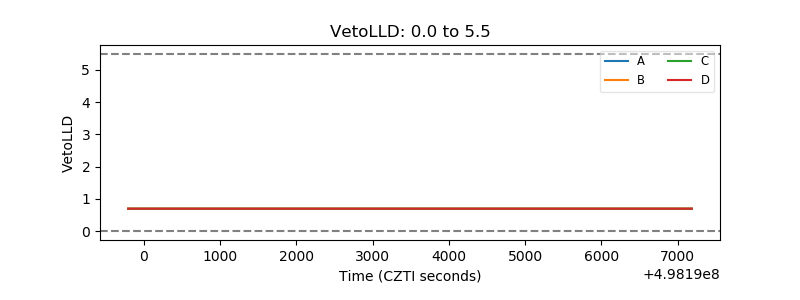 |
| Alpha Counter | 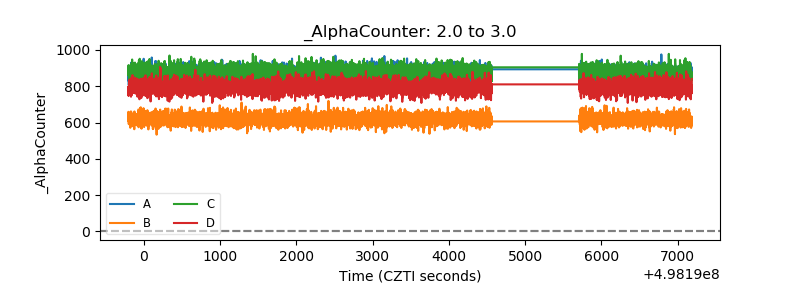 |
| _CPM_Rate | 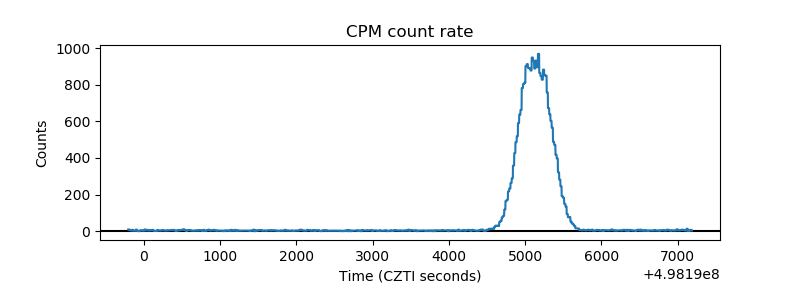 |
| CZT Counter | 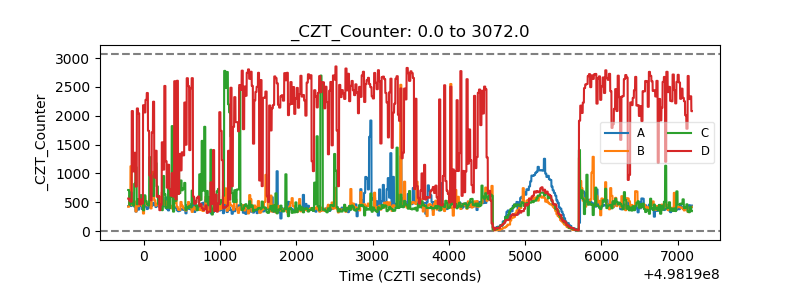 |
| +2.5 Volts monitor |  |
| +5 Volts monitor |  |
| _ROLL_ROT | 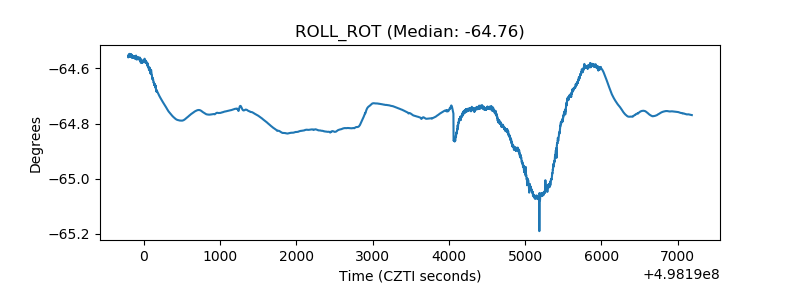 |
| _Roll_DEC | 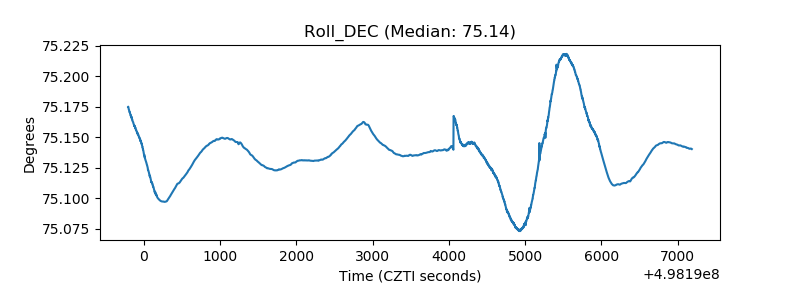 |
| _Roll_RA | 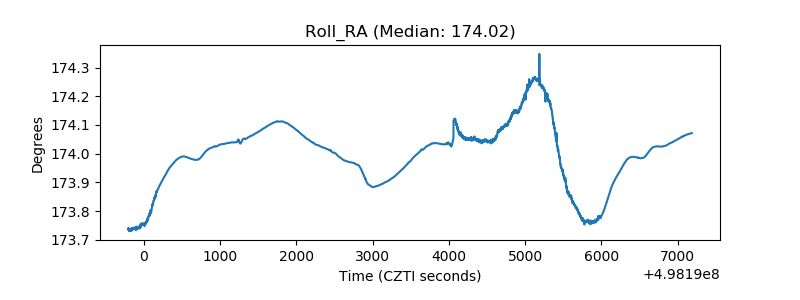 |
| Veto Counter | 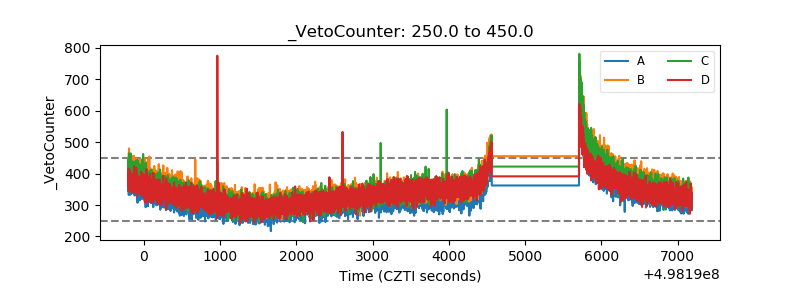 |