| Param | Original file | Final file |
|---|---|---|
| Filename | modeM0/AS1A14_126T15_9000006516_54356cztM0_level2.fits | modeM0/AS1A14_126T15_9000006516_54356cztM0_level2_quad_clean.evt |
| Size (bytes) | 353,269,440 | 48,807,360 |
| Size | 336.9 MB | 46.5 MB |
| Events in quadrant A | 1,838,796 | 388,955 |
| Events in quadrant B | 1,827,983 | 417,159 |
| Events in quadrant C | 1,893,513 | 353,751 |
| Events in quadrant D | 7,213,219 | 43,485 |
| Mode SS | |||
|---|---|---|---|
| Quadrant | BADHDUFLAG | Total packets | Discarded packets |
| A | 0 | 113 | 27 |
| B | 0 | 113 | 25 |
| C | 0 | 113 | 29 |
| D | 0 | 108 | 22 |
| Mode M0 | |||
|---|---|---|---|
| Quadrant | BADHDUFLAG | Total packets | Discarded packets |
| A | 0 | 11808 | 3290 |
| B | 0 | 11802 | 3229 |
| C | 0 | 13017 | 4263 |
| D | 0 | 41368 | 17719 |
| Mode M9 | |||
|---|---|---|---|
| Quadrant | BADHDUFLAG | Total packets | Discarded packets |
| A | 0 | 15 | 3 |
| B | 0 | 14 | 5 |
| C | 0 | 15 | 2 |
| D | 0 | 14 | 4 |
| Quadrant | Total seconds | Saturated seconds | Saturation percentage |
|---|---|---|---|
| A | 4095 | 4 | 0.097680% |
| B | 4120 | 12 | 0.291262% |
| C | 4037 | 28 | 0.693584% |
| D | 3210 | 2717 | 84.641745% |
Noise dominated data is calculated using 1-second bins in cleaned event files. If a bin has >2000 counts, and if more than 50% of those come from <1% of pixels, then it is considered to be noise-dominated and hence unusable.
| Quadrant | # 1 sec bins | Bins with >0 counts | Bins with >2000 counts | High rate bins dominated by noise | Noise dominated (total time) | Noise dominated (detector-on time) | Marked lightcurve |
|---|---|---|---|---|---|---|---|
| A | 6989 | 4404 | 0 | 0 | 0.00% | 0.00% | 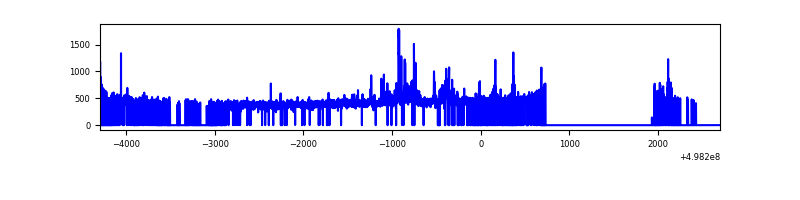 |
| B | 6978 | 4396 | 3 | 3 | 0.04% | 0.07% | 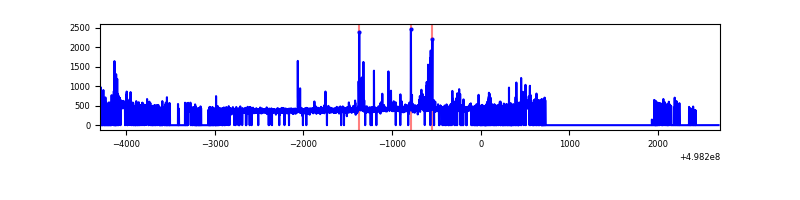 |
| C | 6957 | 4355 | 24 | 24 | 0.34% | 0.55% | 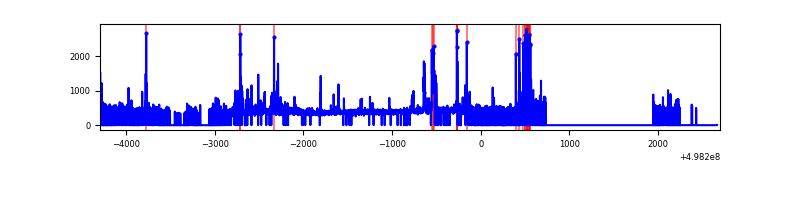 |
| D | 6505 | 3468 | 2463 | 2463 | 37.86% | 71.02% |  |
Top three noisy pixels from each quadrant. If the there are fewer than three noisy pixels in the level2.evt file, extra rows are filled as -1
| Pixel properties | Quadrant properties | ||||||
|---|---|---|---|---|---|---|---|
| Quadrant | DetID | PixID | Counts | Sigma | Mean | Median | Sigma |
| A | 7 | 206 | 127715 | 1180.9 | 433 | 422 | 107.8 |
| A | 4 | 3 | 10931 | 97.49 | 433 | 422 | 107.8 |
| A | 13 | 254 | 8252 | 72.64 | 433 | 422 | 107.8 |
| B | 10 | 247 | 47693 | 507.28 | 429 | 413 | 93.2 |
| B | 0 | 213 | 42829 | 455.1 | 429 | 413 | 93.2 |
| B | 0 | 171 | 18999 | 199.42 | 429 | 413 | 93.2 |
| C | 14 | 254 | 96268 | 845.2 | 406 | 402 | 113.4 |
| C | 1 | 29 | 64990 | 569.44 | 406 | 402 | 113.4 |
| C | 12 | 2 | 44583 | 389.52 | 406 | 402 | 113.4 |
| D | 8 | 176 | 6344731 | 177404.13 | 121 | 115 | 35.8 |
| D | 12 | 3 | 158407 | 4426.06 | 121 | 115 | 35.8 |
| D | 15 | 108 | 125746 | 3512.81 | 121 | 115 | 35.8 |
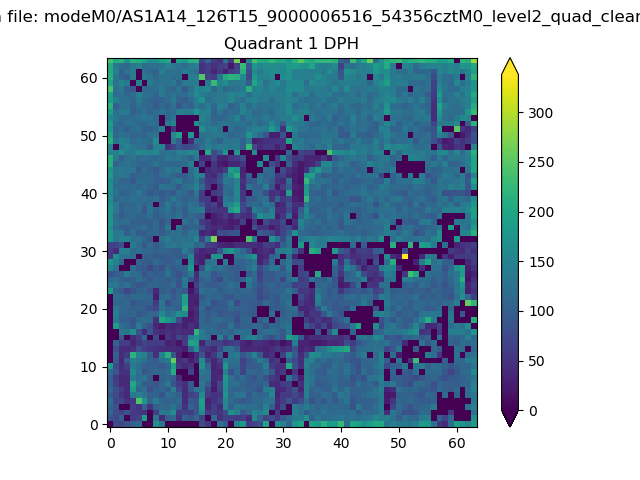
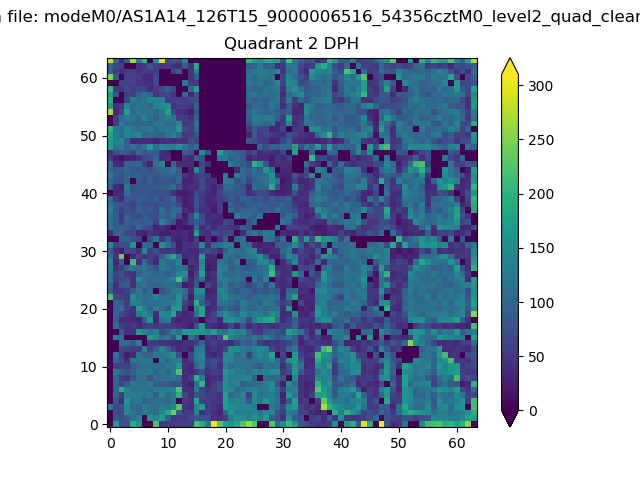
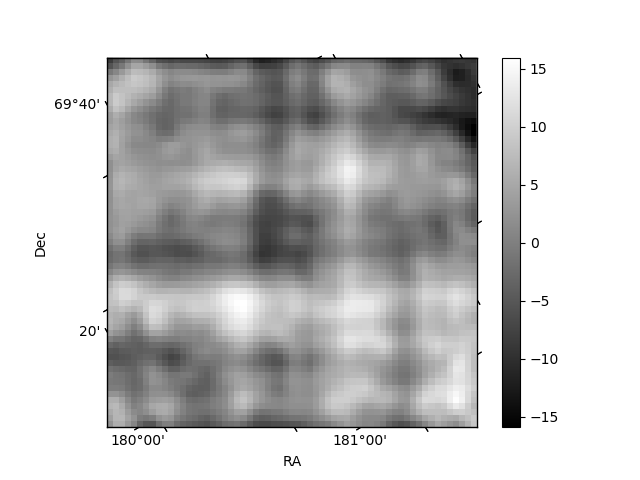
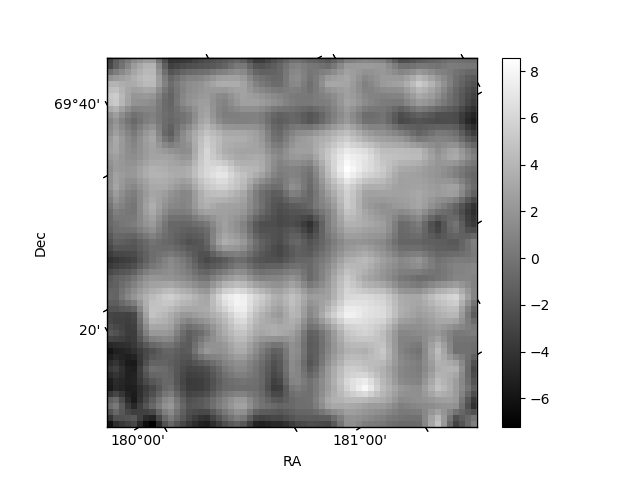
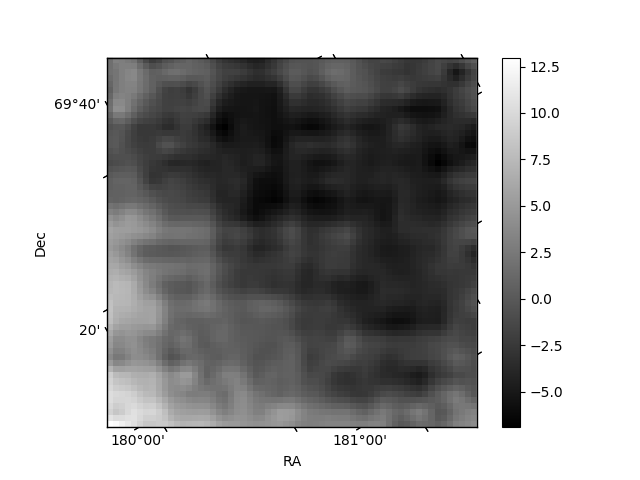
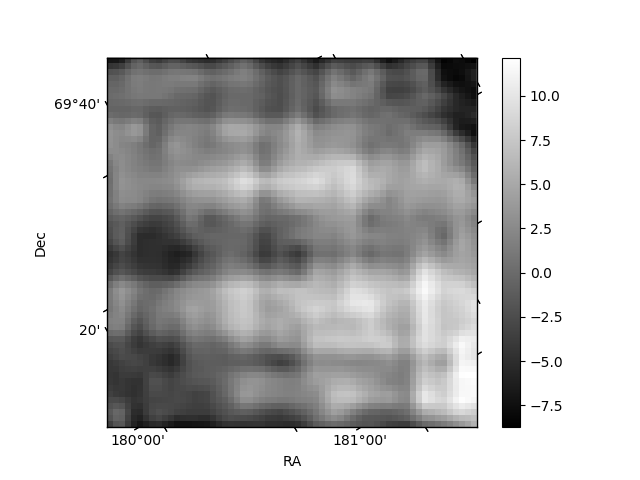
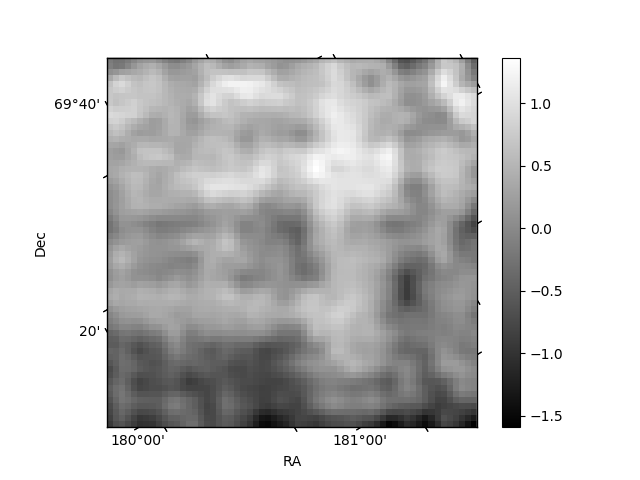
Histogram calculated using DETX and DETY for each event in the final _common_clean file
| Quadrant A | 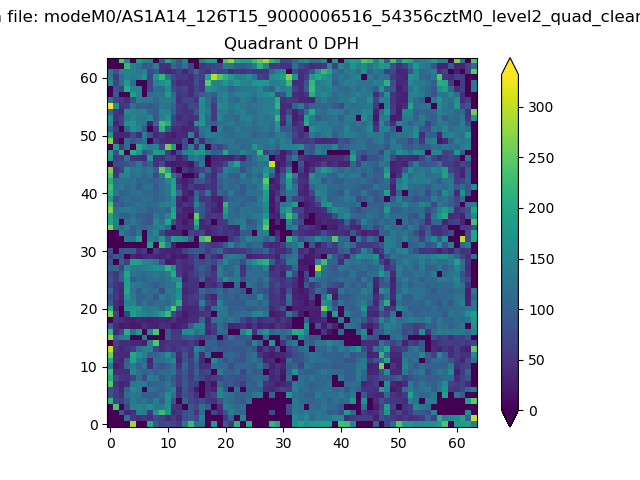 |
 |
Quadrant B |
|---|---|---|---|
| Quadrant D | 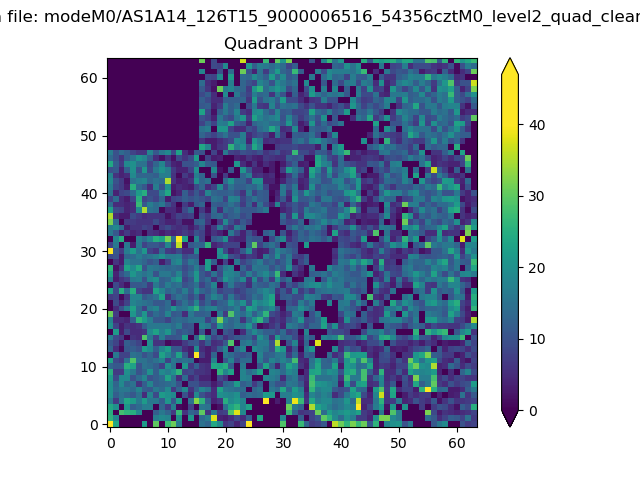 |
 |
Quadrant C |
| Plot type | Count rate plots | Images |
|---|---|---|
| Comparison with Poisson distribution Blue bars denote a histogram of data divided into 1 sec bins. Red curve is a Poisson curve with rate = median count rate of data. |
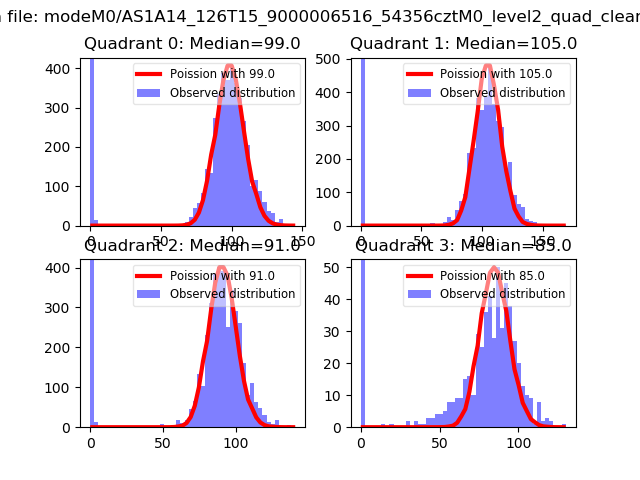 |
 |
| Quadrant-wise count rates Data is divided into 100 sec bins |
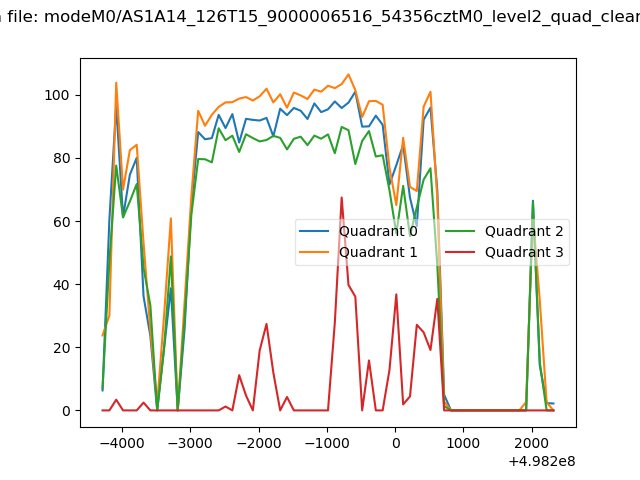 |
|
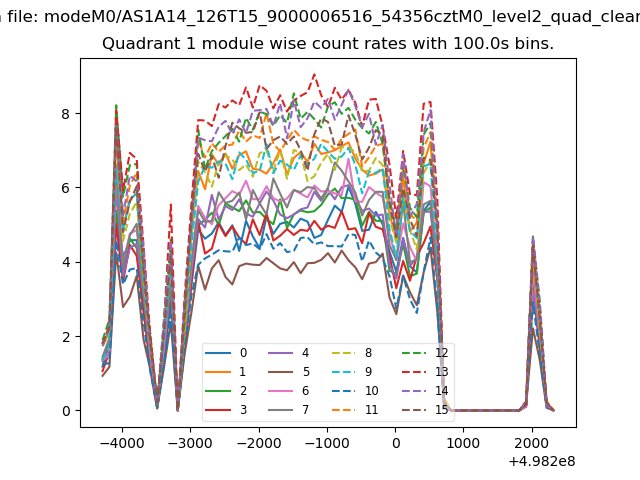
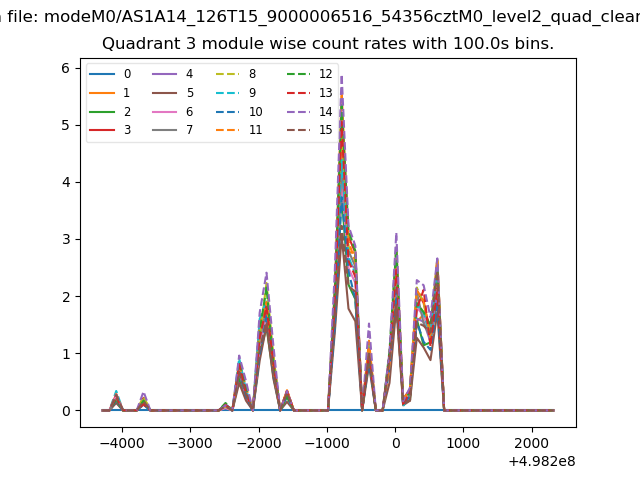
| Module-wise count rates for Quadrant A Data is divided into 100 sec bins |
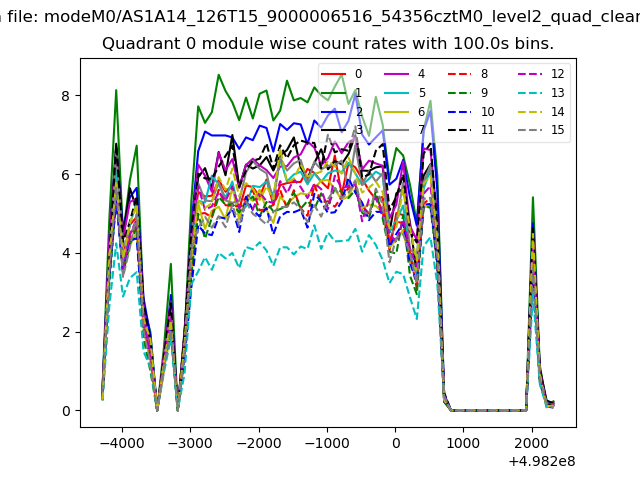 |
 |
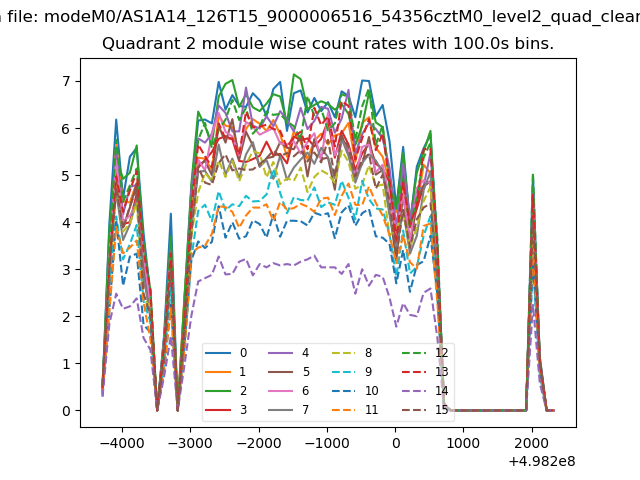
| Module-wise count rates for Quadrant B Data is divided into 100 sec bins |
 |
 |
| Module-wise count rates for Quadrant C Data is divided into 100 sec bins |
 |
 |
| Module-wise count rates for Quadrant D Data is divided into 100 sec bins |
 |
 |
| Parameter | Plot |
|---|---|
| CZT HV Monitor |  |
| D_VDD | 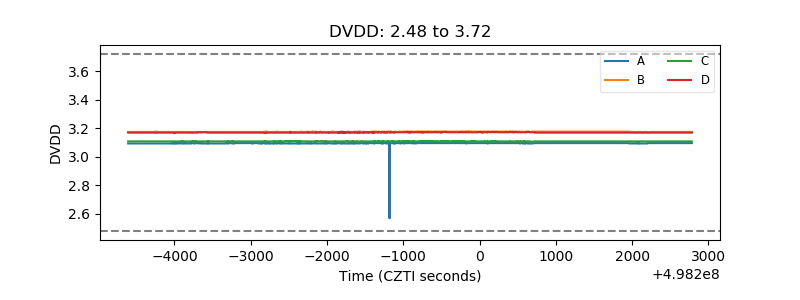 |
| Temperature 1 | 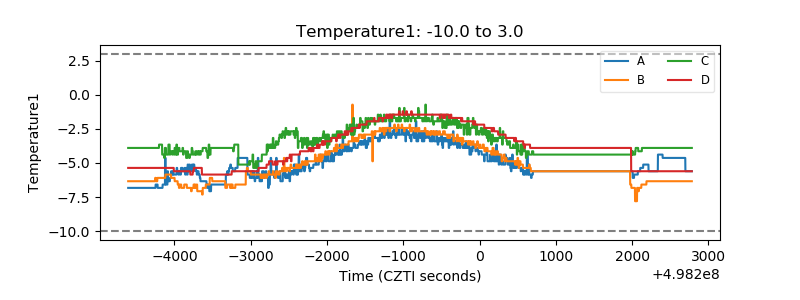 |
| Veto HV Monitor | 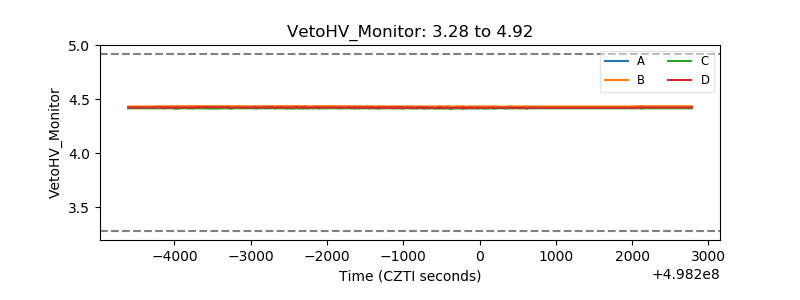 |
| Veto LLD | 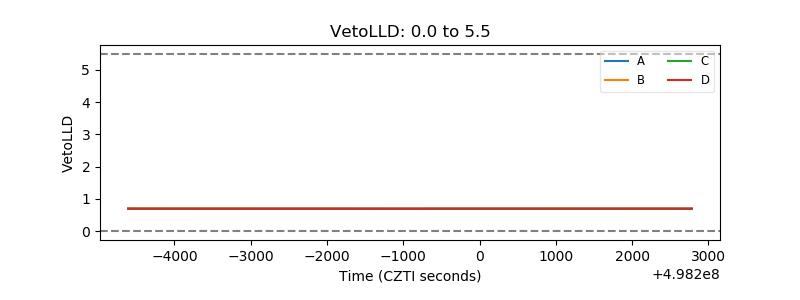 |
| Alpha Counter | 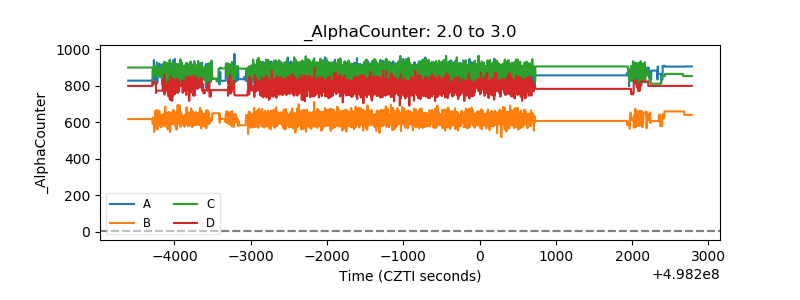 |
| _CPM_Rate | 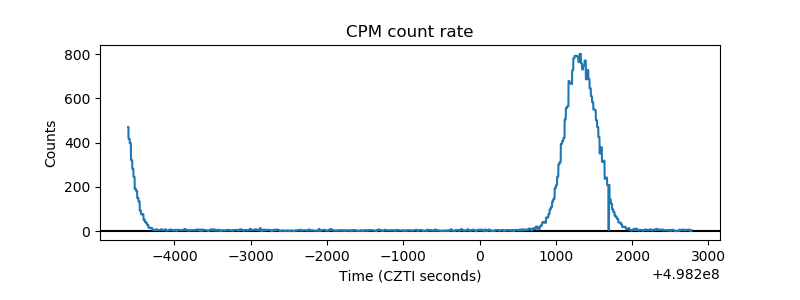 |
| CZT Counter | 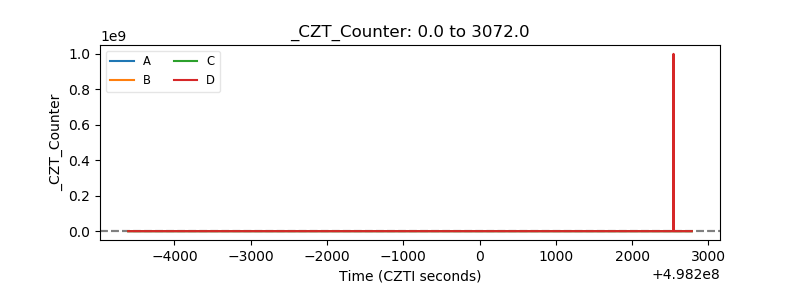 |
| +2.5 Volts monitor |  |
| +5 Volts monitor | 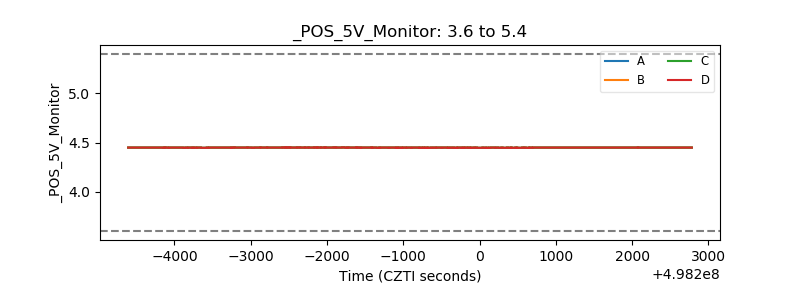 |
| _ROLL_ROT | 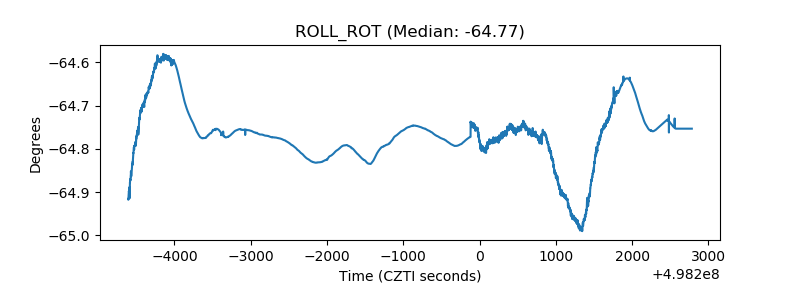 |
| _Roll_DEC | 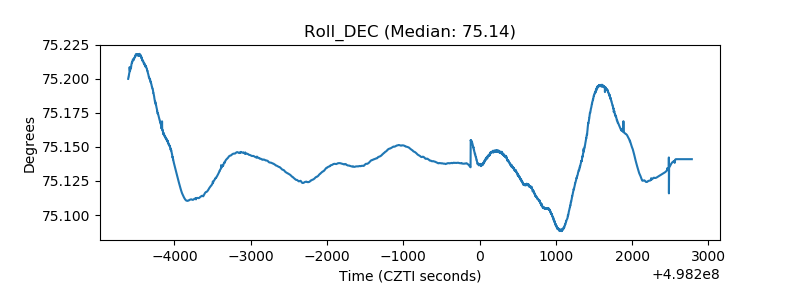 |
| _Roll_RA | 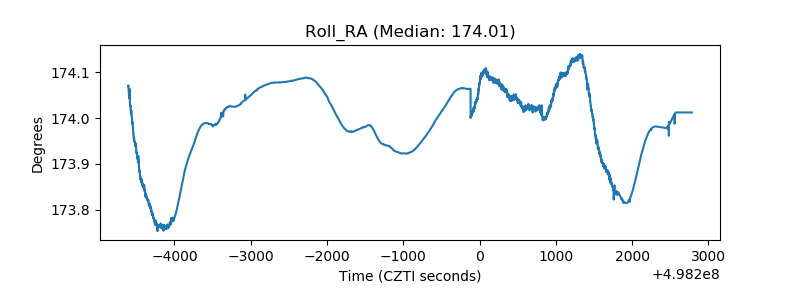 |
| Veto Counter | 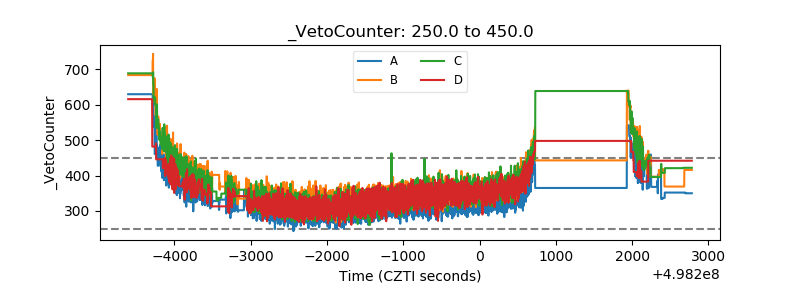 |